Top-5 tips for Top-Down Multiple Time Frame Analysis Trading
I am trading multiple time frame analysis for many years. After reviewing trading ideas from various traders on Tradingview, I noticed that many traders are applying that incorrectly
In this article, I will share with you 5 essential tips , that will help you improve your multiple time frame analysis and top-down trading.
The Order of Analysis Matters
Multiple time frame analysis is also called top-down analysis for a reason. When you trade with that, you should strictly start your analysis with higher time frames and then dive lower, investigating shorter-term time frames.
Unfortunately, most of the traders do the opposite . They start from a lower time frame and finish on a higher one.
Above are 3 time frames of EURGBP pair: daily, 4h, 1h.
To execute multiple time frames analysis properly, start with a daily, then check a 4h and only then the hourly time frame.
Limit the Number of Time Frames
Executing multiple time frame analysis, many traders analyse a lot of time frames.
They may start from a weekly and finish on 5 minute time frame, going through 5-8 time frames.
Remember that is it completely wrong . For execution of a multiple time frame analysis, it is more than enough to analyse 3 or even 2 time frames. Adding more time frames will overwhelm your analysis and make it too complex.
Analyse Particular Time Frames
Your multiple time frame analysis should be consistent and rule-based. It means that you should strictly define the time frames that you analyse.
For example, for day trading, my main trading time frames are daily, 4h, 1h. I consistently analyse ONLY these trading time frames and I look for day trades only analysing this combination of time frames.
Higher is the time frame, stronger the signal it provides
Trading with multiple time frame analysis, very often you will encounter controversial signals: you may see a very bullish pattern on a daily and a very bearish confirmation on 30 minutes time frame.
Always remember that the higher time frames confirmations are always stronger , and their accuracy and probability is always higher.
Above there are 2 patterns:
a head and shoulders pattern on a daily time frame with a confirmed neckline breakout, and an inverted head and shoulders pattern on a 4h time frame with a confirmed neckline breakout.
2 patterns give 2 controversial signals:
the pattern on a daily is very bullish and the pattern on a 4h is very bearish.
The signal on a daily time frame will be always stronger ,
so it is reasonable to be on a bearish side here.
You can see that the price dropped after a retest of a neckline of a head and shoulders on a daily, completely neglecting a bullish pattern on a 4H.
Each Time Frame Should Have Its Purpose
You should analyse any particular time frame for a reason.
You should know exactly what you are looking for there and what is the purpose of your analysis.
For example, for day trading, I analyse 3 time frames.
On a daily, I analyse the market trend and key levels.
On a 4H time frame, I analyse candlesticks.
On an hourly time frame, I look for a price action pattern as a confirmation.
On GBPAUD on a daily, I see a test of a key horizontal resistance.
On a 4H time frame, the price formed a doji candle.
On an hourly, I spotted a double top, giving me a bearish confirmation.
These trading tips will increase the accuracy of your multiple time frame analysis. Study them carefully and adopt them in your trading.
❤️Please, support my work with like, thank you!❤️
I am part of Trade Nation's Influencer program and receive a monthly fee for using their TradingView charts in my analysis.
Community ideas
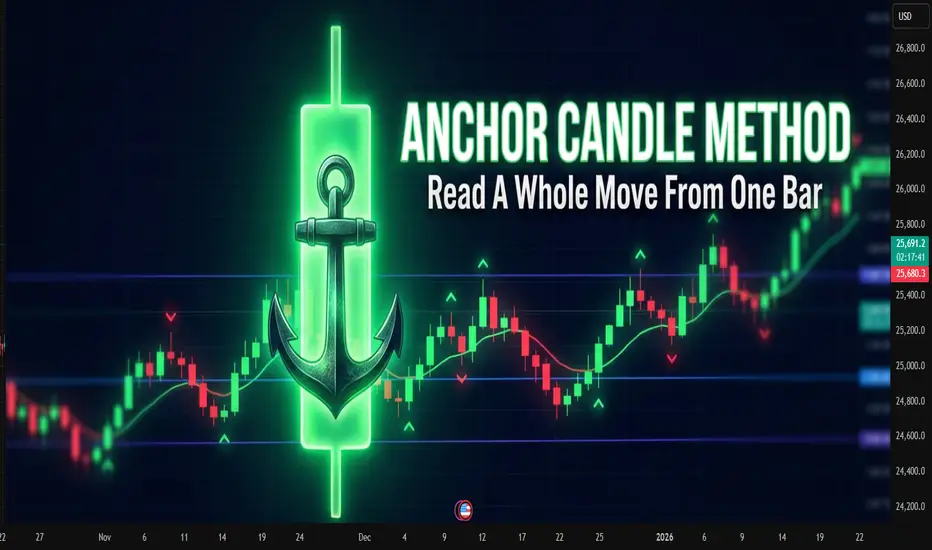
Anchor Candle MethodAnchor Candle Method: How To Read A Whole Move From One Bar
Many traders drown in lines, zones, patterns. One simple technique helps simplify the picture: working around a single “anchor candle", the reference candle of the pulse.
The idea is simple: the market often builds further movement around one dominant candle. If you mark up its levels correctly, a ready-made framework appears for reading the trend, pullbacks and false breakouts.
What is an anchor candle
Anchor candle is a wide range candle that starts or refreshes an impulse. It does at least one of these:
Breaks an important high or low
Starts a strong move after a tight range
Flips local structure from “choppy” to “trending”
Typical traits:
Range clearly larger than nearby candles
Close near one edge of the range (top in an up impulse, bottom in a down impulse)
Comes after compression, range or slow grind
You do not need a perfect definition in points or percent. Anchor candle is mostly a visual tool. The goal is to find the candle around which the rest of the move “organizes” itself.
How to find it on the chart
Step-by-step routine for one instrument and timeframe:
Mark the current short-term trend on higher timeframe (for example 1H if you trade 5–15M).
Drop to the working timeframe.
Find the last strong impulse in the direction of that trend.
Inside this impulse look for the widest candle that clearly stands out.
Check that it did something “important”: broke a range, cleared a local high/low, or started the leg.
If nothing stands out, skip. The method works best on clean impulses, not on flat, overlapping price.
Key levels inside one anchor candle
Once the candle is chosen, mark four levels:
High of the candle
Low of the candle
50% of the range (midline)
Close of the candle
Each level has a function.
High
For a bullish anchor, the high acts like a “ceiling” where late buyers often get trapped. When price trades above and then falls back inside, it often marks a failed breakout or liquidity grab.
Low
For a bullish anchor, the low works as structural invalidation. Deep close under the low tells that the original impulse was absorbed.
Midline (50%)
Midline splits “control”. For a bullish anchor:
Holding above 50% keeps control with buyers
Consistent closes below 50% shows that sellers start to dominate inside the same candle
Close
Close shows which side won the battle inside that bar. If later price keeps reacting near that close, it confirms that the market “remembers” this candle.
Basic trading scenarios around a bullish anchor
Assume an uptrend and a bullish anchor candle.
1. Trend continuation from the upper half
Pattern:
After the anchor candle, price pulls back into its upper half
Pullback holds above the midline
Volume or volatility dries up on the pullback, then fresh buying appears
Idea: buyers defend control above 50%. Entries often come:
On rejection from the midline
On break of a small local high inside the upper half
Stops usually go under the low of the anchor or under the last local swing inside it, depending on risk tolerance.
2. Failed breakout and reversal from the high
Pattern:
Price trades above the high of the anchor
Quickly falls back inside the range
Subsequent candles close inside or below the midline
This often reveals exhausted buyers. For counter-trend or early reversal trades, traders:
Wait for a clear close back inside the candle
Use the high of the anchor as invalidation for short setups
3. Full loss of control below the low
When price not only enters the lower half, but closes below the low and stays there, the market sends a clear message: the impulse is broken.
Traders use this in two ways:
Exit remaining longs that depended on this impulse
Start to plan shorts on retests of the low from below, now as resistance
Bearish anchor: same logic upside-down
For a bearish anchor candle in a downtrend:
Low becomes “trap” level for late sellers
High becomes invalidation
Upper half of the candle is “shorting zone”
Close and midline still help to judge who controls the bar
The structure is mirrored, the reading logic stays the same.
Practical routine you can repeat every day
A compact checklist many traders follow:
Define higher-timeframe bias
On working timeframe, find the latest clear impulse in that direction
Pick the anchor candle that represents this impulse
Mark high, low, midline, close
Note where price trades relative to these levels
Decide: trend continuation, failed breakout, or broken structure
This method does not remove uncertainty. It just compresses market noise into a small set of reference points.
Common mistakes with anchor candles
Choosing every bigger-than-average candle as anchor, even inside messy ranges
Ignoring higher timeframe bias and trading every signal both ways
Forcing trades on each touch of an anchor level without context
Keeping the same anchor for days when the market already formed a new impulse
Anchor candles age. Fresh impulses usually provide better structure than old ones.
A note about indicators
Many traders prefer to mark such candles and levels by hand, others rely on indicators that highlight wide range bars and draw levels automatically. Manual reading trains the eye, while automated tools often save time when many charts and timeframes are under review at once.
New Year rally: a seasonal move without the fairy taleNew Year rally: a seasonal move without the fairy tale
The “New Year rally” sounds like free money on holidays. In reality it is just a seasonal pattern that sometimes helps and sometimes only pushes traders into random entries.
The point is to understand what qualifies as a rally, when it usually appears, and how to plug it into an existing system instead of trading by calendar alone.
What traders call a New Year rally
A New Year rally is usually described as a sequence of trading sessions with a clear bullish bias in late December and in the first days of January.
Typical features:
several days in a row with closes near daily highs
local highs on indexes and leading names get taken out
stronger appetite for risk assets
sellers try to push back but fail to create real follow-through
On crypto the picture is less clean, but the logic is similar: toward year end, demand for risk often increases.
Why markets tend to rise into year end
The drivers are very down to earth.
Funds and year-end reports
Portfolio managers want their performance to look better on the final statement. They add strong names and trim clear losers.
Tax and position cleanup
In markets where taxes are tied to the calendar year, some players close losing trades earlier, then come back closer to the holidays with fresh positioning.
Holiday mood
With neutral or mildly positive news flow, participants are more willing to buy. Any positive surprise on rates, inflation, or earnings gets amplified by sentiment.
Lower liquidity
Many traders and funds are away. Order books are thinner and big buyers can move price more easily.
When it makes sense to look for it
On traditional stock markets, traders usually watch for the New Year rally:
during the last 5 trading days of December
during the first 2–5 trading days of January
On crypto there is no strict calendar rule. It helps to track:
behavior of major coins
dominance shifts
whether the trend is exhausted or still fresh
A practical trick: mark the transition from December to January for several past years on the chart and see what your market actually did in those windows.
How to avoid turning it into a lottery
A simple checklist before trading a “seasonal” move:
higher timeframes show an uptrend or at least a clear pause in the prior selloff
main indexes or key coins move in the same direction instead of diverging
no fresh, heavy supply zone sitting just above current price
risk per trade is fixed in advance: stop, position size, % of equity
exit plan exists: partial take-profit levels and a clear invalidation point
If one of these items fails, it is better to treat the move as market context, not an entry signal.
Common mistakes in New Year rallies
entering just because the calendar says “late December”
doubling position size “to catch the move before holidays”
buying right at the end of the impulse when distribution has already started
skipping the stop because “they will not dump the market into New Year”
Seasonal patterns never replace risk management. A setup that does not survive March will not magically improve in December.
A note on indicators and saving time
Many traders prefer not to redraw the whole market every December. It is convenient when an indicator highlights trend, key zones and momentum, and the trader only has to read the setup. In that case New Year rallies become just one more pattern inside a consistent framework, not a separate holiday legend.

six touches in 15 years...Bitcoin Has Entered a Level It Has Only Reached Six Times and the Dates Tell the Story
Bitcoin’s Weekly RSI has dropped to 36, a historically rare zone that the chart hits only during periods of extreme structural stress.
And when we overlay this with the timeline on the chart, every dip into this RSI basement aligns with major real-world events, each stamped by a specific date.
Let’s match every RSI-36 moment with what actually happened and when.
2011 — The Mt. Gox Hack (June 19, 2011)
BTC’s earliest major crash occurred on June 19, 2011, when Mt. Gox was breached and trading halted.
Liquidity evaporated instantly, triggering one of Bitcoin’s first violent drawdowns.
2015 — Mt. Gox Bankruptcy Confirmation (January 2015 – April 2015)
While Mt. Gox filed for bankruptcy protection earlier (February 2014), the real market shock hit in 2015 as court proceedings confirmed the exchange’s insolvency and creditors reported massive unrecoverable losses.
Key dates:
January 2015: BTC bottomed near $150
April 2015: Bankruptcy trustee disclosures shook the market again
2018 — The ICO Bubble Implosion (January 2018 – December 2018)
BTC peaked on December 17, 2017, then the unwind began:
January–February 2018: ICO failures and SEC actions
November 2018: Final capitulation during Bitcoin Cash hash war
2020 — Global COVID-19 Crash (March 12–13, 2020)
When the WHO declared COVID-19 a pandemic on March 11, 2020, global markets melted down.
On March 12, 2020 (“Black Thursday”), Bitcoin recorded one of its steepest single-day drops ever.
2022 — Terra Collapse → Crypto Contagion → FTX Implosion
Here are the exact dates of the triple-shock:
May 9–12, 2022: Terra/Luna death spiral
June 12, 2022: Celsius froze withdrawals
July 5, 2022: Voyager filed for bankruptcy
November 8–11, 2022: FTX collapsed and filed for Chapter 11
Each failure compounded systemic risk across crypto.
2025 — The Sixth Touch: Tariff Shock & Global Instability
The most recent RSI drop aligns with the 2025 macro-driven selloff, tied to:
Tariff escalations between major economies
Heightened geopolitical tensions
Risk-off flows hitting all high-beta assets
BONUS CHART EVIDENCE (NERD MODE):
Your chart clearly maps each RSI-low event to a real historical stress point:
Year Event Date Chart Marker
2011 Mt. Gox Hack June 19, 2011 MT. GOX HACK
2015 Mt. Gox Bankruptcy Fallout Jan–Apr 2015 MT. GOX COLLAPSE
2018 ICO Bubble Crash 2018 (Dec bottom) ICO BUBBLE
2020 COVID Crash March 12–13, 2020 COVID CRASH
2022 Luna → Celsius → FTX Collapse May–Nov 2022 TERRA / FTX COLLAPSE
2025 Macro + Geopolitical Stress 2025 TARIFF WAR & WARS
Each RSI drop perfectly aligns with the chart’s highlighted crisis zones.
The currencynerd Take
This RSI zone is more than a technical level, it’s a historical fingerprint.
Every time Bitcoin visits this region, the market is either:
wrapping up a generational panic, or
warming up for deeper chaos.
And based on the chart…
BTC is once again standing at a level touched only during the darkest moments in its history.
What happens next doesn’t just shape price, it shapes the entire cycle.
put together by : Pako Phutietsile as @currencynerd
courtesy of : @TradingView

Trading Plan - What should be included and how to improve it. I have been failing same like many traders are failing these days for same reason. Not having a plan and clearly defined when to trade , when not to trade and didn't have set barriers when to stop. Always wanted to make more. Yes it sounds boring and restrictive. But you will either lean on plan or on impulses.
Everything start with visualization of how your trade setup should looks like. You should know what exactly you are looking for and describe it as much as possible for example:
🧩 Basic Concept
Im looking for the fake break out of the range. Whether we call it manipulation or Stop hunt. It really doesn't matter. The idea is that once big candle is created it creates fomo and break out traders are entering continuation. I trade against them.
📍 Bullish continuation setups
Model 1 - Entry after manipulation - 50% target
Model 2 - Entry on pullback on level between 61.8 - 80% 📍 Bearish Continuation setups
Model 1 - Entry after manipulation - 50% target
Model 2 - Entry on pullback on level between 61.8 - 80% pullback This is your strategy, your pattern you are looking for in the specific situations and market conditions.
📍 Trading plan
is how, when and where , you are going to execute it. It's also good to describe your step by step process, so you remind it to yourself. I suggest to read it before every trading session. Especially beginners or if you adopted a new strategy. Describe every trade element as much as possible. With experiences you will be improving and shaping it. It has to be as simple as possible. 📍 Trading Pairs - If you are day trader / Intra week trader focus on 8 pairs maximum, You dont need more - DXY, EUR, GBP, CHF, BTC, ETH, SOL, XAU
📍 Market Bias - Describe how you analyze your Bias - Trend
Do you have HTF Trend / Liquidity ?
Internal LQ - Discount / Premium
External LQ - Significant HL taken
Monday, Friday, Weekly CLS Range
Key Level ? - If NO - NO trade
Liquidity Sweep + SMT
CIOD - Close - Model 1- 50% TP
📍 Down Trend - Trade Stop hunts above the highs
📍Up Trend - Trade Stop Hunt below the lows 📍 TF Alignment CLS Range + Entry - Structure of my Top Down analysis
Weekly / Daily Range - CLS Range
H4 / H1 / M30 / M15 - Entries
Don't overcomplicate it this works 📍 Setup Qualifications - If one of criteria is not met = No trade
High volatility Stop hunt
Stop run out of CLS range - 0.15%
Rejection from Key Level
CIOD on the LTF Model 1
Correct times - NY, LO , PM Sessions
📍 Entry Model 1
CIOD - the next candle below / above open
if the engulfing candle is too big, wait for a pullback
If range is too big take TP at 50%
Look for correlated pairs
If within HTF trend, target full range.
📍Bullish Scenario LTF Change in order flow is important aspect of the trade if you dont wait patiently for the candle close on the right timeframe, setup is invalid. 📍Bearish Scenario
as you can see price action never looks completely same you need to practice your eyes to see it, profiles, levels and what is happening on the edge of the range. Another and not less important part is knowing when not to trade. Also Im not perfect and even I have quite good plan sometimes I dont follow so reminding these mistakes and reading them in my trading plan is great way to eliminating them next time.
🧪 Low Probability Conditions
Day and Day before NPF, FOMC or CPI
Last and First day of a New Month
Dont buy or sell in the direction of overextended markets
An HTF objective has been met
Price tripped between two Key Levels
🧪 Don't trade IF
- Equal highs / Lows around your SL
- If stop run is to shallow
- Candle didn't closed yet
- If you didn't catch the initial move - don't fomo
- No room for at least 2RR
🧪 Recent Mistakes
- Trading within wrong market conditions
- Entering before CIOD confirmed
- Shallow manipulations
- Now waiting for the PWL / PDL Work on constant improvement, not by adding indicators or by looking for new strategy, commit to the one and master it . 1 Kick - 10 000 times
⁉️ This is questions Im asking myself when going thru past trades. It will help you improve as a trader and shape your trading plan.
- Was there a type of trade that did/didn’t work well?
- Was there a particular market that I did/didn’t trade well?
- Was there a particular day/time that I did/didn’t trade well?
- Did I enter trades too soon?
- Did I enter trades too late?
- Did I take profits too soon?
- Did I take profits too late?
- Did I put my stops loss too tight?
- Did I use an unnecessarily big stop loss?
- Did I take take any trades with poor Risk:Reward ratio?
- Did I risk too much?
- Did I risk too little?
- Did I deviate from my trading model?
- Did I deviate from my plan?
I promised myself I’d become the person I once needed the most as a beginner. Below are links to a powerful lessons I shared on Tradingview. Hope it can help you avoid years of trial and error I went thru.
📊 Sharpen your trading Strategy
⚙️ 100% Mechanical System - Complete Strategy
🔁 Daily Bias – Continuation
🔄 Daily Bias – Reversal
🧱 Key Level – Order Block
📉 How to Buy Lows and Sell Highs
🎯 Dealing Range – Enter on pullbacks
💧 Liquidity – Basics to understand
🕒 Timeframe Alignments
🚫 Market Narratives – Avoid traps
🐢 Turtle Soup Master – High reward method
🧘 How to stop overcomplicating trading
🕰️ Day Trading Cheat Code – Sessions
🇬🇧 London Session Trading
🔍 SMT Divergence – Secret Smart Money signal
📐 Standard Deviations – Predict future targets
🎣 Stop Hunt Trading
🧠 Level Up your Mindset
🛕 Monk Mode – Transition from 9–5 to full-time trading
⚠️ Trading Enemies – Habits that destroy success
🔄 Trader’s Routine – Build discipline daily
💪 Get Funded - $20 000 Monthly Plan
🛡️ Risk Management
🏦 Risk Management for Prop Trading
📏 Risk in % or Fixed Position Size
🔐 Risk Per Trade – Keep consistency
David Perk aka Dave FX Hunter ⚔️
Neckline Breaks and Trader Nerves: A Quick Guide to Bearish H&S The head and shoulders pattern is like the market’s way of clearing its throat and saying, “Things might be changing up here.” Once that neckline snaps, traders often sit up straighter — not because something magical happened, but because the chart finally drew a clean line between “maybe” and “now it matters.”
In this ZS (Soybean Futures) example, price slipped under the neckline and started wandering toward lower ground. Traders who work with this pattern usually focus on three things:
A possible bounce back toward the neckline (because markets love second chances),
A clear invalidation level (in this case, above 1136),
A logical downside objective such as the gap-and-support combo near 1070'4.
That simple trio turns a chaotic chart into a calm plan.
Contract specs matter too. The ZS contract moves in bigger bites:
Tick: 1/4 of one cent (0.0025) per bushel = $12.50 per contract
Margin: $2,000 per contract
The MZS (Micro Soybean Futures) contract takes smaller ones:
Tick: 0.0050 per bushel = $2.50 per contract
Margin: $200 per contract
Traders who want more precision sometimes choose the micro so their stop-loss distance and account size stay on speaking terms. Either way, the chart sets the idea, but the contract size sets the comfort level.
And of course, the golden rule in pattern-based trading: the market can still do whatever it wants. That’s why traders define their exit if wrong, their objective if right, and their size before clicking anything. A head and shoulders isn't about predicting — it's about organizing.
The chart example ties it all together: neckline break, resistance overhead, downside target below. Simple, structured, and practical — just the way traders like it.
Want More Depth?
If you’d like to go deeper into the building blocks of trading, check out our From Mystery to Mastery trilogy, three cornerstone articles that complement this one:
🔗 From Mystery to Mastery: Trading Essentials
🔗 From Mystery to Mastery: Futures Explained
🔗 From Mystery to Mastery: Options Explained
When charting futures, the data provided could be delayed. Traders working with the ticker symbols discussed in this idea may prefer to use CME Group real-time data plan on TradingView: www.tradingview.com - This consideration is particularly important for shorter-term traders, whereas it may be less critical for those focused on longer-term trading strategies.
General Disclaimer:
The trade ideas presented herein are solely for illustrative purposes forming a part of a case study intended to demonstrate key principles in risk management within the context of the specific market scenarios discussed. These ideas are not to be interpreted as investment recommendations or financial advice. They do not endorse or promote any specific trading strategies, financial products, or services. The information provided is based on data believed to be reliable; however, its accuracy or completeness cannot be guaranteed. Trading in financial markets involves risks, including the potential loss of principal. Each individual should conduct their own research and consult with professional financial advisors before making any investment decisions. The author or publisher of this content bears no responsibility for any actions taken based on the information provided or for any resultant financial or other losses.

Trend Shift Observed Can Rally ContinuationThe price structure shows a clear trend shift, indicating that momentum has changed direction. After this structure change, the chart suggests that the rally may continue based on current price behavior and follow-through. This idea focuses only on observing trend transition and continuation through price action.

The European equities remains attractive in terms of valuationWhile the US equity market is at a historic high in terms of stock market valuation—driven by the massive performance of the technology sector—the European equity market could represent a relative catch-up opportunity in the coming months, both technically and fundamentally. After a decade dominated by US stocks, Europe now appears to be a region where the combination of significantly lower valuations and the more accommodative monetary stance of the ECB creates an appealing relative opportunity. Let’s take a closer look.
1) Valuations: a historic gap with the United States
One of the most compelling arguments in favor of European equities remains their valuation, which is significantly lower than that of the US market. The CAPE ratio (Shiller PE), a valuation indicator smoothed over 10 years, perfectly illustrates this differential. Over recent decades, Europe has generally shown a lower CAPE than the United States, but today the observed gap has reached rarely seen levels.
The US CAPE is hovering around historically high levels, sometimes exceeding 35–38 depending on recent periods, reminiscent of the peaks observed before the bursting of the tech bubble or before the 2021–2022 cycle. In contrast, the European CAPE remains contained, fluctuating around the 20/22 level. In other words, European equities trade at a discount of nearly 40 to 50% according to the Shiller PE.
This divergence is explained by several factors: a sector composition more oriented toward industry and finance, lower exposure to technology, lower structural growth, and a higher perception of geopolitical risk. But for an investor seeking reasonable entry points, this gap opens a window of opportunity: it is rare to observe a developed market combining solid balance sheets, decent earnings visibility, and such a valuation discount relative to the US equity market.
2) Technical analysis: the EuroStoxx 50 breaks a key historical level
From a technical standpoint, the EuroStoxx 50 is also sending a positive signal. After failing for more than twenty years to break through the resistance zone around 5525 points, the main European index has finally managed to sustainably exceed this level, initially reached in March 2000 at the height of the tech bubble.
This breakout, confirmed on the monthly timeframe, constitutes a major technical signal. In chart analysis, breaking a long-term historical resistance validates the continuation of a structural bullish trend. This suggests that the market is potentially entering a new phase of appreciation, supported by earnings revisions and an improved perception of the European cycle. Naturally, this does not rule out short-term corrections.
With attractive valuations, a historic differential compared to the US market, and an encouraging long-term technical signal, European equities today offer a favorable investment profile. Caution, however, remains necessary: European growth remains fragile and geopolitical risks persist. Nevertheless, within a diversified portfolio construction logic, Europe is once again becoming a region difficult to ignore.
DISCLAIMER:
This content is intended for individuals who are familiar with financial markets and instruments and is for information purposes only. The presented idea (including market commentary, market data and observations) is not a work product of any research department of Swissquote or its affiliates. This material is intended to highlight market action and does not constitute investment, legal or tax advice. If you are a retail investor or lack experience in trading complex financial products, it is advisable to seek professional advice from licensed advisor before making any financial decisions.
This content is not intended to manipulate the market or encourage any specific financial behavior.
Swissquote makes no representation or warranty as to the quality, completeness, accuracy, comprehensiveness or non-infringement of such content. The views expressed are those of the consultant and are provided for educational purposes only. Any information provided relating to a product or market should not be construed as recommending an investment strategy or transaction. Past performance is not a guarantee of future results.
Swissquote and its employees and representatives shall in no event be held liable for any damages or losses arising directly or indirectly from decisions made on the basis of this content.
The use of any third-party brands or trademarks is for information only and does not imply endorsement by Swissquote, or that the trademark owner has authorised Swissquote to promote its products or services.
Swissquote is the marketing brand for the activities of Swissquote Bank Ltd (Switzerland) regulated by FINMA, Swissquote Capital Markets Limited regulated by CySEC (Cyprus), Swissquote Bank Europe SA (Luxembourg) regulated by the CSSF, Swissquote Ltd (UK) regulated by the FCA, Swissquote Financial Services (Malta) Ltd regulated by the Malta Financial Services Authority, Swissquote MEA Ltd. (UAE) regulated by the Dubai Financial Services Authority, Swissquote Pte Ltd (Singapore) regulated by the Monetary Authority of Singapore, Swissquote Asia Limited (Hong Kong) licensed by the Hong Kong Securities and Futures Commission (SFC) and Swissquote South Africa (Pty) Ltd supervised by the FSCA.
Products and services of Swissquote are only intended for those permitted to receive them under local law.
All investments carry a degree of risk. The risk of loss in trading or holding financial instruments can be substantial. The value of financial instruments, including but not limited to stocks, bonds, cryptocurrencies, and other assets, can fluctuate both upwards and downwards. There is a significant risk of financial loss when buying, selling, holding, staking, or investing in these instruments. SQBE makes no recommendations regarding any specific investment, transaction, or the use of any particular investment strategy.
CFDs are complex instruments and come with a high risk of losing money rapidly due to leverage. The vast majority of retail client accounts suffer capital losses when trading in CFDs. You should consider whether you understand how CFDs work and whether you can afford to take the high risk of losing your money.
Digital Assets are unregulated in most countries and consumer protection rules may not apply. As highly volatile speculative investments, Digital Assets are not suitable for investors without a high-risk tolerance. Make sure you understand each Digital Asset before you trade.
Cryptocurrencies are not considered legal tender in some jurisdictions and are subject to regulatory uncertainties.
The use of Internet-based systems can involve high risks, including, but not limited to, fraud, cyber-attacks, network and communication failures, as well as identity theft and phishing attacks related to crypto-assets.

All you need to know: WHEN and WHERE (short giude)Most traders lose money not because they’re wrong about direction… but because they’re wrong about WHEN and WHERE direction actually matters.
This is the missing piece in 99% of trading strategies.
Let’s break it down simply and clearly.
1. WHERE Matters First: Price Location Defines the Entire Trade
The market is not equally important at all prices.
There are only a few places where decisions actually have consequences:
🔹 1. Major Higher-Timeframe Levels
- Daily, Weekly and even monthly support, resistance, supply, demand.
- This is where big players care.
- Most BIG moves begin here.
🔹 2. Volatility Compression Zones
- Tight ranges, triangles, squeezes, etc
- When volatility compresses, potential energy builds.
- Breakouts here actually matter.
🔹 3. Break-and-Retest Structures
- The retest is where confirmation happens.
- It’s where weak hands exit and smart money enters.
🔹 4. Trend Extremes / Overextensions
- Parabolic rallies, vertical drops, stretched momentum.
- These locations create the most powerful reversals.
🔹 5. Liquidity Pools
- Above swing highs, below swing lows, around obvious trendlines.
- Institutions hunt these levels before moving the market.
If you’re not trading at one of these five locations, you are trading noise.
2. WHEN Matters Even More: Timing Is the Difference Between Chop and Trend
Even the best location is useless if the moment isn’t right.
Here are the only timing conditions that give your trade real probability:
🔸 1. Volatility Expansion After Compression
- Wait for candles to elongate, volume to increase, and the range to open up.
- Before expansion: fakeouts.
- After expansion: real moves.
🔸 2. Liquidity Sweeps
- The market clears stops → fills institutional orders → reveals true direction.
- You don’t act before the sweep; you act after it confirms.
🔸 3. Structural Confirmation
- Higher low in an uptrend.
- Lower high in a downtrend.
- Break → Retest → Continuation.
- Without structure, timing is random.
🔸 4. Active Market Sessions
- London open, NY open, session overlaps, major news events.
- The same setup at 03:00 means nothing — the same setup at NY open is a trade.
🔸 5. Multi-Timeframe Momentum Alignment
- HTF gives the bias
- MTF gives the setup
- LTF gives the entry
- When timeframes align, timing becomes obvious.
3. WHERE + WHEN = Non-Random Trades
This is what professional trading really is:
- WHERE = the place price must react
- WHEN = the moment price has conviction
Combine both and you no longer predict — you simply respond to high-probability situations.
- This is how you avoid chop.
- This is how you avoid forcing trades.
- This is how you become consistent.
4. The Psychological Shift
Retail traders think:
“I must forecast the next move.”
Professionals think:
“I only act at key locations, when timing conditions align.”
This removes:
- FOMO
- guessing
- impulsive entries
- emotional trading
You no longer chase the market.
You wait for the market to come to your WHERE and your WHEN.
That’s the edge.
5. Final Thoughts
You don’t need to predict the market.
You don’t even need to know what happens next.
You only need to know:
- WHERE the market becomes important
- WHEN a move becomes meaningful
Master these two, and everything else falls into place.
P.S.
I know this is easier said than done. Even after many years in the market, with a solid sense of direction and plenty of sniper-level entries, my WHEN is not always perfect either. That’s the part none of us ever truly “master” — we only learn to manage it better.
So take all of this as a blueprint, not a declaration that I execute flawlessly. I’m a professional, yes — but I’m also in a continuous process of adapting, refining, and learning from every new shift the market throws at us.
Experience helps, but the market keeps evolving, and so do I. Just like anyone else should.

How AI is Revolutionizing Risk ManagementIn a world where bots can fire off hundreds of orders in the time it takes you to sip your coffee, risk management isn't a checkbox at the end of your plan it's the core operating system.
AI has given traders incredible leverage:
Faster execution than any human
Exposure to more markets and instruments
Complex position structures that would be impossible to manage manually
But that same leverage cuts both ways. When something breaks, it doesn't trickle it cascades.
The traders who survive this era won't be the ones with the most aggressive models. They'll be the ones whose risk frameworks are built to handle both human mistakes and machine speed.
Why Old-School Risk Rules Aren't Enough Anymore
For years, the standard advice looked like this:
"Never risk more than 1–2% per trade"
"Always use a stop loss"
"Diversify across assets"
Those principles still matter so much. But AI and automation helped improve and changed the landscape:
Orders can hit the market in microseconds your "mental stop" is useless
Correlations spike during stress what looked diversified suddenly moves as one
Multiple bots can unintentionally stack risk in the same direction
Feedback loops between algos can turn a normal move into a cascade
In other words: the classic rules are the starting point , not the full playbook.
How AI Supercharges Risk Management (If You Let It)
Used well, AI doesn't just place trades it monitors and defends your account in ways a human never could.
Dynamic Position Sizing
Instead of risking a flat 1% on every trade, AI can adjust size based on:
Current volatility
Recent strategy performance
Correlation with existing positions
Market regime (trend, range, chaos)
When conditions are favorable, size can step up modestly.
When conditions are hostile, size automatically steps down.
The goal isn't to swing for home runs.
It's to press when the wind is at your back, and survive when it's in your face.
Smarter Stop Placement
Fixed stops at round numbers are magnets for liquidity hunts.
AI can analyze:
ATR-based volatility bands
Clusters of swing highs/lows
Liquidity pockets in the book
Option levels where hedging flows are likely
Stops get placed where the idea is broken, not where noise usually spikes.
Portfolio-Level Heat Monitoring
Most traders think in single trades. AI thinks in portfolios.
It can continuously measure:
Total percentage of equity at risk right now
Sector and theme concentration
Correlation clusters (everything tied to the same macro factor)
Worst-case scenarios under shock moves
If your "independent" trades are all secretly the same bet, a good risk engine will tell you.
The 4-Layer Risk Stack for AI Traders
Think of your protection as layered armor:
Trade Level
Clear stop loss
Defined target or exit logic
Position size tied to account risk, not feelings
Strategy Level
Max number of open positions per strategy
Daily loss limit per system
"Three strikes" rules after consecutive losing days
Portfolio Level
Total open risk cap (for example: no more than 2% at risk at once)
Limits by asset class, sector, and narrative
Rules to prevent over concentration in one theme (AI stocks, crypto, etc.)
Account Level
Maximum drawdown you're willing to tolerate
Hard kill switch when that line is crossed
Recovery plan (size reductions, pause period, review process)
AI can monitor all four layers at once every position, every second and trigger actions the moment a rule is violated.
Kelly, Edge, and Why "More" Is Not Always Better
The Kelly Criterion is a famous formula that tells you how much of your account you could risk to maximize long‑term growth.
Kelly % = W - ((1 - W) / R)
Where:
W = Win probability
R = Average Win / Average Loss
Example:
Win rate (W) = 60%
Average win is 1.5× average loss (R = 1.5)
Kelly = 0.60 - (0.40 / 1.5) ≈ 0.33 → 33%
On paper, that says "risk 33% of your account each trade." In reality, that's a fast path to a margin call.
Serious traders and any sane AI risk engine treat Kelly as the ceiling , then scale it down:
Half‑Kelly (≈ 16%)
Quarter‑Kelly (≈ 8%)
Or even less, depending on volatility and confidence
AI can recompute W and R as fresh trades come in, adjusting risk when your edge is hot and cutting risk when your edge is questionable.
Designing Your AI‑Era Risk Framework
You don't need hedge‑fund infrastructure to think like a pro. Start with five questions:
What is my absolute pain threshold?
At what drawdown (%) would I stop trading entirely?
Write that number down. Build backwards from it.
How many consecutive losses can I survive?
If you want to survive 10 straight losses at 20% max drawdown, your per‑trade risk must be ~2% or less.
How will I shrink risk when volatility spikes?
Tie your size to ATR, VIX‑style measures, or your own volatility index.
What are my circuit breakers?
Daily loss limit
Weekly loss review trigger
Conditions where all bots shut down automatically
Is everything written down?
If it's not in rules, it's just a wish.
Rules should be clear enough that a bot could follow them.
Four AI Risk Mistakes That Blow Accounts Quietly
Over‑optimization - Training models until the backtest is perfect… and live trading is a disaster.
Ignoring tail risk - Assuming the future will look like the backtest, and underestimating rare events.
No true kill switch - Letting a "temporary" drawdown turn into permanent damage.
Blind trust in the model - Assuming "the bot knows best" without understanding its logic.
AI should be treated like a high‑performance car: powerful, fast, and absolutely deadly if you drive it without brakes.
Discussion
How are you handling risk in the age of automation?
Do you size positions dynamically or use fixed percentages?
Do you cap total portfolio risk, or just think trade by trade?
Do your bots or strategies have clear kill switches?
Drop your thoughts and your best risk rules in the comments. In the future of trading AI will be the one watching your back.....
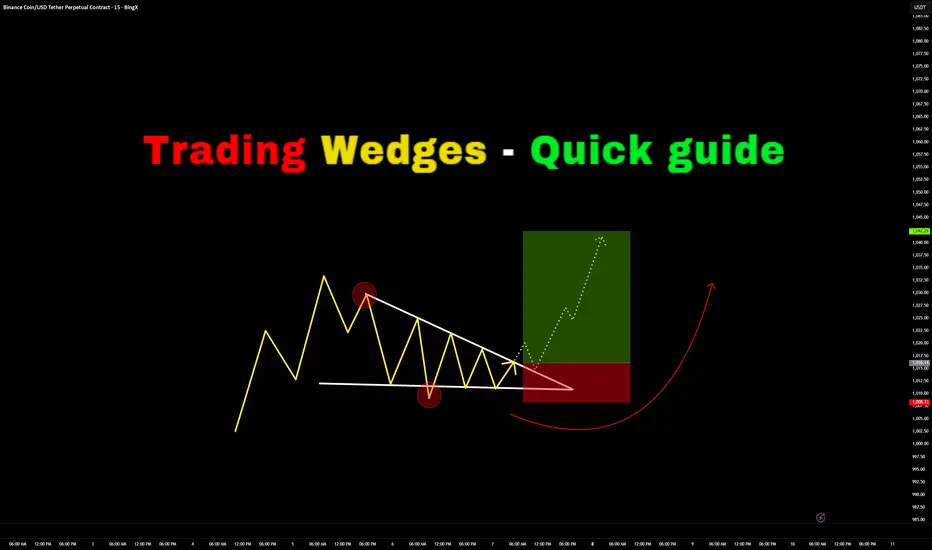
Trading Wedges - Quick Guide in 5 StepsWelcome back everyone to another guide, today we will speed run "Trading wedges" in a quick 5 step guide. Be sure to like, follow and join the community!
1) Identify the wedges:
- Falling Wedge
- Rising Wedge
- Symmetrical Wedge (Triangle)
2) Identify Breakout Direction:
- Falling Wedge > Bullish Breakout Expected
- Rising Wedge > Bearish Breakout Expected
- Symmetrical Wedge (Triangle) > Consolidation Expected
Breakout should show a candle closing outside the wedge.
3) Wait for retest to take place on previous key level or resistance (which would now be support)
If the retest holds with a strong rejection candle or consolidation - begin to long.
4) Enter Trade:
Enter on successful retest confirmation
SL for longs should be below previous low's
SL for shorts should be above previous highs.
5) TP levels:
TP 1) First high target
TP 2) Second high target
TP 3) Third high target.
RESULTS:
Price has soared up high and hit all three Take profits.
For trader who are wanting more profits you can potentially enable TP trailing afterwards - however I don't recommend this as you need to factor in your emotions of "GREED"
Thank you all so much for reading! Hopefully this is a useful guide in the future or present! If you would like me to make any simplified guides, let me know in the comments below or contact me through trading view!
How the Fed’s Next Move Could Reshape Stocks, Gold and BitcoinPowell’s Big December Decision 🏛️
The December 2025 Fed meeting is a big deal because the US economy is in a tricky spot:
Inflation is still a bit too high 📈
Growth and jobs are starting to weaken 📉
Most traders expect the Fed to cut interest rates by 0.25%, but not everyone at the Fed agrees. If Jerome Powell does something different from what markets expect, we could see either a strong rally in risk assets or a nasty risk‑off move.
What the Fed might do ⚙️
The Fed has three main options:
1. Cut rates and sound “dovish” 🕊️
They cut 0.25% and say they’re ready to help the economy more if needed.
Markets usually like this: cheaper money, easier credit.
2. Cut rates but sound “hawkish” 🦅
They cut, but Powell keeps warning a lot about inflation.
This sends a mixed signal: some good news, some bad news.
3. No cut (a pause) 😐
This would surprise markets because most people expect a cut.
Could scare investors and cause a quick sell‑off in risk assets.
What it could mean for gold and Bitcoin
1. Gold
Loves lower real yields and weaker dollar.
A clear cut with a dovish message could push gold to new highs.
A surprise pause or hawkish tone could trigger a quick pullback.
2. Bitcoin & crypto
Rate cuts usually mean more liquidity and more risk‑taking, which helps crypto.
If the Fed delivers the cut and hints at more easing in 2026, BTC could break out of its correction and start a new leg up.
If Powell disappoints (no cut or very hawkish talk), crypto can dump first as traders de‑risk.
Bottom line ✅
This meeting is important because it sets the tone for 2026:
A friendly, dovish Fed = more chances for a risk‑on environment in stocks, gold and Bitcoin 🚀
A cautious or hawkish Fed = more volatility and possible corrections before any new uptrend 🔁
Traders should watch not just what the Fed does with rates, but also how Powell talks about inflation, growth and future cuts.

If you don’t know this pattern, you’ll miss out the main profits🌀 Complete Guide to Rounded Bottom and Rounded Top Patterns for Traders
The rounded bottom and rounded top patterns are among the most reliable reversal patterns in technical analysis. They form gradually and usually indicate a major trend reversal in the market.
🔵 Rounded Bottom Pattern
📌 Definition
A rounded bottom forms when the price gradually declines and then slowly starts to rise.
This pattern looks like a large U-shape or semicircle.
📌 Nature of the Pattern
Downtrend → exhausted
Sellers → weakening
Buyers → gradually entering
📌 Key Features
1️⃣ Gradual Formation
Unlike double bottoms or twin peaks that form quickly, this pattern takes time.
2️⃣ Gradual Volume Decrease
Volume decreases at first
Lowest volume occurs in the middle
Volume rises again as the price recovers
⚠️ In low-volume markets (e.g., some crypto assets), be cautious.
3️⃣ No Sharp Candlestick Shadows
Candles usually have smooth and steady movement.
4️⃣ Curved Path
The price moves along a curved trajectory.
🔍 How to Identify a Rounded Bottom
The prior trend must be downward. Without a preceding downtrend, the pattern is meaningless.
Candles should start from a point and move with low volatility, indicating a “tired” market.
The middle of the pattern has lowest price fluctuation and volume, like the bottom of a bowl.
After the midpoint, candles gradually become larger and buyers gain strength.
If a curved line is drawn, the price should not break it; otherwise, the pattern is invalid.
🔵 Rounded Top Pattern
Same as the rounded bottom, but in reverse.
Prior trend: uptrend
Buyer enthusiasm decreases
Price gradually reverses
Price begins to decline
🎯 Best Timeframes
H1, H4, D1
Smaller timeframes (1m, 5m, 15m) are noisy and can produce false breakouts.
🧠 Entry Points (Trading Setup)
1️⃣ Entry after Breakout (Safer)
Rounded Bottom: draw a resistance line at the highest peak on the right → enter when candle closes above it.
Rounded Top: draw a support line → enter short after a confirmed breakout.
2️⃣ Entry on Pullback (Lower Risk + Higher Reward)
Wait for the price to pull back after the breakout
Enter after confirmation of the reversal
🛑 Stop Loss
Rounded Bottom: below the center or lowest point on the right
Rounded Top: above the center or highest peak on the right
🎯 Take Profit
Set the target equal to the height of the pattern from the breakout point.
Subsequent targets can be set at next support/resistance levels.
✔️ Psychological Aspect on Chart
Rounded Bottom: 🟢 from despair to hope
Rounded Top: 🔴 from euphoria to selling pressure
🎯 Professional Confirmation Filters
Positive divergence in rounded bottom
Negative divergence in rounded top
Volume increase after breakout
Strong breakout candle
⚠️ Common Mistakes
Using very small timeframes → fractal patterns look like rounded but are false
Entering before breakout → most common cause of losses
Drawing wrong curve → sharp spikes or shadows invalidate the pattern
Ignoring volume → shallow markets (e.g., small altcoins) can distort the pattern
📌 Golden Rule for Traders
Rounded Bottom → signals the start of a long-term uptrend
Rounded Top → signals a correction or temporary decline
✅ Best practice: enter at the breakout point and ride the main trend

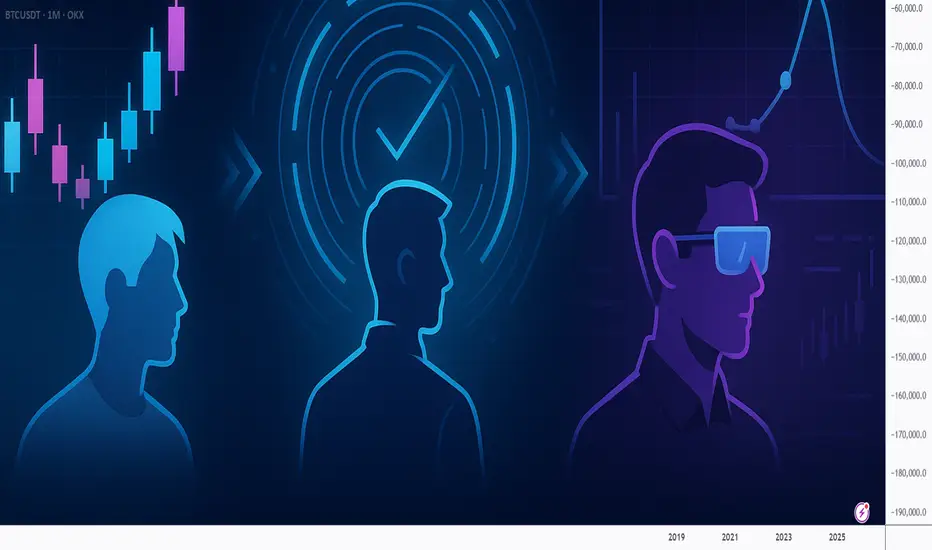
The Transformation Every Trader Must Make!!!Every trader begins with the same goal: “I want to make money.”
But the traders who last, the ones who grow, evolve, and eventually become consistent, go through a quiet transformation:
They shift from thinking about money...
to thinking about probability, structure, and process.
Here’s the transformation in three stages:
1️⃣From Outcome-Driven → Process-Driven
Beginners measure success by whether a trade wins or loses.
Professionals measure success by whether they followed their plan.
- Because a good trade can lose.
- And a bad trade can win.
- Confusing the two destroys growth.
Your job is not to win every trade!
Your job is to execute with integrity.
2️⃣From Prediction → Preparation
Beginners try to guess where the market will go.
They draw a level… then hope.
Professionals don’t predict, they prepare.
They plan both sides:
- If price does X, I do Y.
- If price breaks Z, I step aside.
- If the structure shifts, I adapt.
Prediction feeds the ego.
Preparation feeds the account.
3️⃣From Emotional → Probabilistic Thinking
Beginners think every trade is “the one.”
Professionals think in sample sizes.
- One trade means nothing.
- Five trades mean nothing.
- Fifty trades reveal the truth.
When you think probabilistically:
- Fear shrinks.
- Confidence grows.
- Discipline becomes natural.
Because now you see the market for what it is:
a place where anything can happen, but certain behaviors win over time.
📚 The Real Lesson
Trading becomes easier when you stop trying to force results and start building a process that produces results over the long run.
The market doesn’t reward intensity.
It rewards consistency, clarity, and adaptability.
Your transformation begins the moment you shift from:
“I need this trade to win”
to
“I need to follow my plan.”
That’s when you stop gambling… and start trading.
⚠️ Disclaimer: This is not financial advice. Always do your own research and manage risk properly.
📚 Stick to your trading plan regarding entries, risk, and management.
Good luck! 🍀
All Strategies Are Good; If Managed Properly!
~Richard Nasr
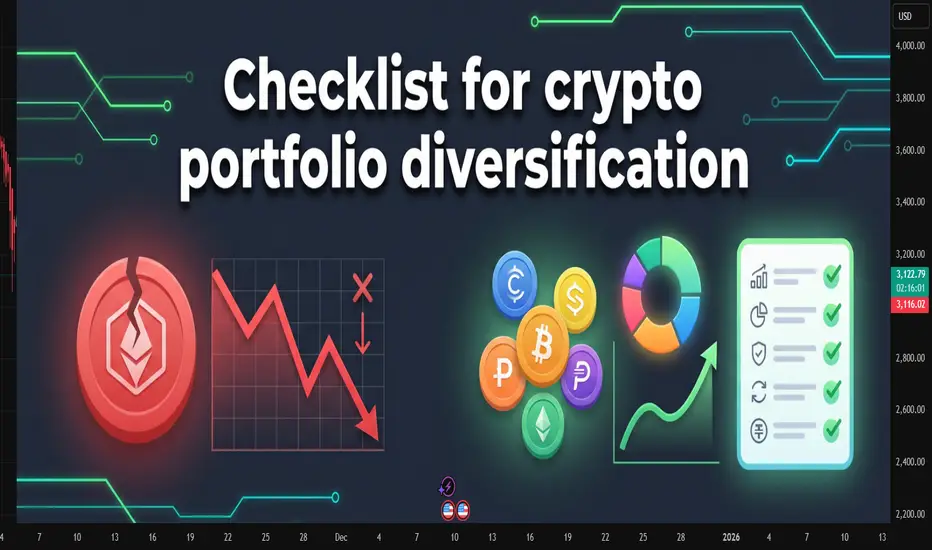
Crypto diversification checklist for your portfolioCrypto diversification checklist for your portfolio
When the market runs hot, it feels tempting to dump all capital into one coin that moves right now. The story usually ends the same way. Momentum fades, the chart cools down, and the whole account depends on one or two tickers. Diversification does not make every decision perfect. It simply keeps one mistake from breaking the account.
What a diversified crypto portfolio really means
Many traders call a mix of three alts and one stablecoin a diversified basket. For crypto it helps to think in a few clear dimensions:
asset type: BTC, large caps, mid and small caps, stablecoins
role in the portfolio: capital protection, growth, high risk
sector: L1, L2, DeFi, infrastructure, memecoins and niche themes
source of yield: spot only, staking, DeFi, derivatives
The more weight sits in one corner, the more the whole portfolio depends on a single story.
Checklist before adding a new coin
1. Position size
One coin takes no more than 5–15% of total capital
The total share of high risk positions stays at a level where a drawdown does not knock the trader out emotionally
2. Sector risk
The new coin does not fully copy risk you already have: same sector, same ecosystem, same news driver
If the portfolio already holds many DeFi names, another similar token rarely changes the picture
3. Liquidity
Average daily volume is high enough to exit without massive slippage
The coin trades on at least two or three major exchanges, not on a single illiquid venue
The spread stays reasonable during calm market hours
4. Price history
The coin has lived through at least one strong market correction
The chart shows clear phases of accumulation, pullbacks and reactions to news, not only one vertical candle
Price does not sit in a zone where any small dump is enough to hurt the whole account
5. Counterparty risk
Storage is clear: centralized exchange, self-custody wallet, DeFi protocol
Capital is not concentrated on one exchange, one jurisdiction or one stablecoin
There is a simple plan for delisting, withdrawal issues or technical outages
6. Holding horizon
The time frame is defined in advance: scalp, swing, mid term, long term build
Exit rules are written: by price, by time or by broken thesis, not only “I will hold until it goes back up”
Keeping the structure stable
Diversification helps only when the rules stay in place during noise and sharp moves. A simple base mix already gives a frame:
core: BTC and large caps, 50–70%
growth: mid caps and clear themes, 20–40%
experiments: small caps and new stories, 5–10%
cash and stablecoins for fresh entries
Then the main routine is to rebalance back to these ranges every month or quarter instead of rebuilding the whole portfolio after each spike.
A short note on tools
Some traders keep this checklist on paper or in a spreadsheet. Others rely on chart tools that group coins by liquidity, volatility or correlation and highlight weak spots in the structure. The exact format does not matter. The key is that the tool makes it easy to run through the same checks before each trade and saves time on charts instead of adding more noise. Many traders simply lean on indicators for this routine work because it feels faster and more convenient.
HOW TO WATCHLIST ADVANCE VIEW IN TRADINGVIEWThis video explains how to watchlist advanced view in Trading-View. It shows where the watchlist advanced view option is available and how the advanced view works inside the watchlist. The focus is only on understanding how to watchlist advanced view clearly within the Trading-View interface.

Perfect Execution - Waiting for Confirmation Saves AccounsKey levels attract attention, but attention alone rarely produces good trades. A level gains meaning only when price shows how it behaves around it. Many traders understand where important levels are, yet still lose money because they enter too early, assume a breakout will continue, or anticipate a reversal before the market confirms it.
Patience at these levels is what separates disciplined execution from unnecessary losses.
A key level acts like a pressure point. Liquidity gathers above highs, below lows, and around clear support or resistance.
When price approaches these zones, it does not move cleanly. It probes, sweeps, hesitates, or accelerates depending on who holds control. Entering at the first touch is often an emotional decision disguised as confidence. Entering after confirmation is a structured decision grounded in evidence.
Confirmation begins with a reaction. A legitimate bounce or rejection has intent behind it. You will see displacement, cleaner momentum, or a defined shift in micro-structure. A candle wick alone is not confirmation.
A single green or red candle is not confirmation. Confirmation comes when the market shows that a level is respected or rejected with conviction, as several conditions align.
One of the clearest signs of confirmation is the break of micro-structure after the level is touched. If price sweeps a low and then breaks a minor high, the narrative changes. The same applies to resistance: a sweep followed by a failed attempt to push lower is evidence of buyers stepping in.
This structural shift shows that the reaction is more than a random bounce.
Another layer of confirmation is the retest. Strong moves often return to the level they broke to validate participation.
Traders who enter before this retest expose themselves to unnecessary volatility. Traders who wait allow the market to prove that the move is real, not a trap.
The retest reduces risk naturally and improves the reward-to-risk ratio without changing the strategy itself.
Patience does not slow you down. It filters out trades that look attractive but lack substance. Key levels attract liquidity, manipulation, and emotional behaviour.
Waiting for confirmation keeps you grounded when the market is trying to provoke a reaction. It prevents you from turning strong levels into weak trades through premature entries.
The goal is not to catch the exact top or bottom of a move. The goal is to participate in moves that show clear strength and clear intent.
When you treat key levels as decision points rather than entry signals, your trading becomes structured, disciplined, and far more consistent. Patience is not passive. It is an active skill that protects your account and elevates your execution.

ESG Investing and Green Finance1. Understanding ESG: Environmental, Social, and Governance
ESG investing involves evaluating companies not only on financial performance but also on how well they manage environmental, social, and governance risks and opportunities. It helps investors identify sustainable businesses that are better positioned for long-term growth.
1.1 The Environmental Component (E)
This dimension examines how a company impacts the planet. Key factors include:
Carbon emissions and climate impact
Energy efficiency and renewable energy usage
Waste management and recycling
Water usage and conservation
Biodiversity protection
Investors focus on whether a company has strategies to reduce climate risk, comply with environmental regulations, and transition towards greener operations.
1.2 The Social Component (S)
This pillar evaluates a company's relationship with people—employees, customers, suppliers, and communities. It includes:
Labor rights, wages, and workplace safety
Diversity, equity, and inclusion (DEI)
Customer privacy and data protection
Human rights across supply chains
Community development and social welfare initiatives
Companies with strong social practices tend to have better employee retention, improved brand reputation, and lower legal risks.
1.3 The Governance Component (G)
Governance is about the ethical and transparent management of a company. Criteria include:
Board independence and diversity
Shareholder rights and protections
Anti-corruption policies
Executive compensation linked to performance
Transparent reporting and accountability
Good governance reduces the chances of scandals, fraud, and mismanagement, making the company a safer long-term investment.
2. ESG Investing in Practice
2.1 ESG Screening Methods
Investors use different strategies to integrate ESG:
Negative Screening: Excludes harmful industries (tobacco, weapons, coal).
Positive Screening: Selects companies with high ESG scores.
Best-in-Class Selection: Chooses top performers in each sector.
Integration Approach: Combines ESG data into financial analysis.
Active Ownership: Investors influence companies through voting and engagement.
2.2 ESG Ratings and Data Providers
Agencies like MSCI, Sustainalytics, Refinitiv, and S&P Global provide ESG scores. These ratings help investors compare companies and assess risks.
2.3 Why ESG Investing Is Growing Rapidly
Several forces are driving global adoption:
Climate change concerns
Government regulations and carbon policies
Demand from millennials and Gen-Z investors
Corporate transparency and pressure from stakeholders
Better long-term risk-adjusted returns
Research shows that companies with high ESG performance often deliver higher resilience during economic downturns and more stable cash flows.
3. Green Finance: Capital for a Sustainable Future
Green finance refers to financial instruments and investments specifically designed to support environmentally friendly projects. While ESG investing evaluates companies broadly, green finance channels capital exclusively toward environmental sustainability.
3.1 Key Components of Green Finance
Green Bonds
These are debt instruments where funds are used for climate or environmental projects such as solar plants, wind farms, green buildings, or pollution reduction.
They are issued by governments, corporations, and global institutions.
Green Loans
Loans provided to businesses for sustainable and energy-efficient projects.
Sustainability-Linked Bonds (SLBs)
Interest rates vary depending on a company’s achievement of sustainability targets such as emission reductions.
Climate Funds
Investment pools dedicated to renewable energy, carbon reduction, and environmental innovation.
Carbon Markets and Credits
Companies purchase carbon credits to offset emissions, promoting global decarbonization.
Green Banks
Specialized financial institutions supporting low-carbon infrastructure.
3.2 Priority Sectors in Green Finance
Green finance focuses on sectors with high environmental impact:
Renewable energy (solar, wind, hydro)
Electric mobility and battery technologies
Green buildings and energy-efficient infrastructure
Waste management and recycling
Water treatment and desalination
Sustainable agriculture
Climate adaptation and resilience projects
4. How ESG and Green Finance Work Together
While ESG investing evaluates a broad spectrum of ethical factors, green finance is narrowly targeted at environmental impact. Yet, both frameworks complement each other:
ESG encourages companies to adopt sustainable behavior, improving overall corporate responsibility.
Green finance provides funding for environmentally beneficial projects.
Together, they push global markets toward decarbonization, resource efficiency, and ethical governance.
For example, an energy company with strong ESG scores may issue green bonds to finance its transition from coal to renewable energy. Institutional investors, looking for sustainable portfolios, buy these bonds—creating a cycle of positive environmental impact and financial returns.
5. Benefits of ESG Investing and Green Finance
5.1 For Investors
Better risk management (climate, legal, and reputational).
Potential for long-term stable returns.
Alignment with future regulatory trends.
Access to innovative sectors like clean energy and sustainable tech.
5.2 For Companies
Lower cost of capital due to ESG-focused investors.
Stronger brand identity and customer loyalty.
Enhanced operational efficiency through sustainable practices.
Better compliance with environmental regulations.
5.3 For Society and the Environment
Reduced carbon emissions and pollution.
Promotion of clean energy and green technologies.
Improved labor conditions and community welfare.
More ethical and transparent corporate behavior.
6. Challenges and Criticisms
Despite rapid growth, ESG and green finance face several obstacles.
6.1 Greenwashing
Some companies exaggerate sustainability claims to attract investors. This undermines trust and calls for stricter reporting standards.
6.2 Lack of Standardization
Different ESG rating agencies use different methodologies, leading to inconsistent scores.
6.3 Data Quality Issues
Many companies do not disclose complete or accurate ESG data.
6.4 Balancing Returns vs Sustainability
Some investors believe ESG restrictions may limit short-term profits. However, long-term benefits are increasingly evident.
7. The Future Outlook
ESG investing and green finance are expected to dominate global markets.
Key trends include:
Mandatory climate disclosures by companies
Rise of sustainable index funds and ETFs
Growth in green bond markets
AI-driven ESG analytics
Government incentives for clean energy
Integration of biodiversity and natural capital into finance
Financial institutions, governments, and corporations are aligning capital flows with sustainability goals such as the Paris Agreement and UN SDGs.
Conclusion
ESG investing and green finance mark a new era where profits and purpose converge. Investors are no longer satisfied with traditional financial metrics; they want companies to deliver long-term value while safeguarding the environment and society. ESG frameworks help identify responsible businesses, and green finance mobilizes capital for sustainable projects. Together, they build a financial ecosystem that promotes resilience, ethical conduct, and environmental protection. As global challenges intensify, ESG and green finance will continue shaping the future of economic development—driving the world towards a greener, more inclusive, and more sustainable future.
Invest Globally for Great Growth1. Why Invest Globally?
1. Diversification Beyond Local Risks
Every country faces its own economic cycles, policy changes, political uncertainties, and currency fluctuations. By investing globally, you spread your capital across different markets, reducing the risk that any one economy’s downturn will harm your overall portfolio. For example, if India or the US slows down, growth in Europe, Southeast Asia, or Latin America may balance the impact.
2. Access to Innovation Worldwide
No single country leads in every industry.
The US dominates technology and biotech.
Europe is strong in automation, renewable energy, and luxury goods.
China excels in manufacturing, EVs, and AI hardware.
Emerging markets lead in digital payments, mobile users, and consumption-led growth.
Global investing allows you to “own the best of the world.”
3. Capture Growth in Emerging Markets
Fast-growing countries like India, Vietnam, Indonesia, Brazil, and the Philippines grow faster than many developed nations. Rising incomes, urbanization, young populations, and new industries create high-growth opportunities that are unavailable in slow-growing economies.
4. Protection Against Currency Risk
A global portfolio naturally hedges currency exposure. When one currency depreciates, another may strengthen, which stabilizes your investment value in your home currency.
2. Key Global Asset Classes for Great Growth
1. Global Equities
Stocks provide the highest long-term returns among major asset classes. Global equity investing includes:
Developed Markets (US, UK, Japan, Germany)
Emerging Markets (India, China, Brazil, South Africa)
Frontier Markets (Vietnam, Nigeria, Bangladesh)
You may invest through:
Global index funds
Country-specific ETFs
International mutual funds
ADRs (American Depository Receipts)
The biggest advantage: exposure to global giants like Apple, NVIDIA, Samsung, Toyota, Nestlé, LVMH, and more.
2. Global ETFs
Exchange-Traded Funds provide diversified exposure at low cost. Popular categories include:
MSCI World ETF
MSCI Emerging Markets ETF
S&P 500 ETF
Global Tech ETF
Global Healthcare & Pharma ETF
Clean Energy ETF
ETFs allow you to invest in hundreds of companies across nations in one trade.
3. International Bonds
Bonds provide stability and income. Investing globally gives access to:
US Treasuries (most stable globally)
Eurozone bonds
Asian government bonds
Global corporate bonds
These act as ballast in a volatile portfolio.
4. Real Assets and REITs
You can invest in:
Global REITs
Infrastructure funds
Global commodity ETFs (gold, oil, metals)
These assets protect against inflation and provide diversification.
5. Alternative Global Investments
Venture capital funds
Private equity
Global hedge funds
International startups (via crowdfunding platforms in some regions)
These offer high potential returns but also higher risk.
3. Global Investing Strategies for Great Growth
1. Core–Satellite Strategy
Your portfolio is built in two layers:
Core (70–80%): diversified global index funds or ETFs (MSCI World, S&P 500, Global Emerging Markets).
Satellite (20–30%): high-growth sectors like AI, EVs, biotech, clean energy, robotics, or country-specific themes.
This balances stability with aggressive growth.
2. Thematic Global Investing
The world is driven by megatrends. High-growth themes include:
Artificial Intelligence
Electric Vehicles & Battery Technology
Green Energy & Climate Tech
Robotics & Automation
Digital Health & Genomics
Cybersecurity
Space Technology
Semiconductors
Investing in global thematic funds lets you catch long-term exponential trends.
3. Country Rotation Strategy
Different countries outperform at different times.
Examples:
US leads in technology
India leads in consumption & digital payments
China leads in EVs
Japan leads in robotics
Europe leads in luxury & renewable energy
Rotating positions across countries can capture high phases of growth.
4. Dollar-Cost Averaging (DCA) Globally
Investing fixed amounts regularly (monthly/quarterly) reduces timing risk and steadily builds global exposure.
5. Risk-Parity Global Allocation
Allocate based on risk, not just geography:
Stocks (global): 60%
Bonds (global): 20%
REITs: 10%
Commodities: 10%
This provides long-term balance across cycles.
4. Risks in Global Investing and How to Manage Them
1. Currency Risk
Foreign currencies fluctuate compared to your home currency.
Solution: Use hedged funds or diversify across many currencies.
2. Political & Regulatory Risk
Geopolitical tensions, sanctions, trade wars, and domestic policy changes impact returns.
Solution: Invest through diversified ETFs instead of concentrating in one high-risk nation.
3. Market Liquidity Risk
Some emerging markets have lower liquidity.
Solution: Prefer large, reputable ETFs and funds.
4. Overexposure to One Country
Many investors buy too many US tech stocks, ignoring Europe or Asia.
Solution: Maintain a balanced global mix.
5. Example of a Balanced Global Growth Portfolio
Aggressive Growth Portfolio Example:
40% US Equities (S&P 500 / Nasdaq)
20% India & Emerging Markets
20% Global Tech / AI / Semiconductor ETFs
10% Europe & Japan Equities
5% Global REITs
5% Gold or global commodities ETF
This mix taps into worldwide growth engines.
6. Benefits of Long-Term Global Investing
1. Higher Compounding Potential
When you own the fastest-growing companies globally, your wealth compounds at a higher pace.
2. Reduced Volatility
A global portfolio is more stable because downturns in one region are offset by growth in another.
3. Access to Worldwide Innovation
You can own stocks driving future revolutions—AI, space, clean tech, biotech.
4. Inflation Protection
Global assets usually hedge long-term inflation.
7. How to Start Investing Globally
Open an international brokerage account (e.g., Interactive Brokers, Webull, Vested, or your region’s global access broker).
Start with broad global ETFs.
Add specific regions (US, Europe, Japan, emerging markets).
Gradually include thematic funds.
Rebalance yearly.
Invest consistently.
Conclusion
Investing globally is one of the smartest ways to achieve great long-term growth. It lets you diversify across continents, participate in worldwide innovation, and capture opportunities unavailable in your home market. A well-structured global portfolio combines stability, growth, and resilience, ensuring your wealth compounds over decades.
Whether you are a beginner or an experienced investor, the world is now open to you. Start small, remain consistent, stay diversified, and allow global compounding to work in your favor.

Global Stock Exchanges1. What Is a Stock Exchange?
A stock exchange is a regulated marketplace where securities such as equities, bonds, and derivatives are traded. It provides:
A platform for buying and selling: Ensures fair and efficient transactions between investors.
Regulation and oversight: Protects market participants via rules, surveillance, and disclosure requirements.
Price discovery: Supply and demand determine the price of a stock; exchanges provide the infrastructure to update prices in real time.
Liquidity: Investors can enter and exit positions easily because exchanges bring thousands to millions of participants together.
Capital raising for companies: By issuing shares in an IPO, businesses grow, expand, and innovate.
2. Key Functions of Global Stock Exchanges
a. Facilitating Capital Formation
Corporate expansion depends heavily on capital. Exchanges allow companies to raise funds from the public by selling ownership (shares). This is more efficient than borrowing because equity does not require regular repayment.
b. Providing Liquidity
A liquid market ensures that securities can be traded quickly without large price fluctuations. High liquidity lowers transaction costs, reduces volatility, and makes markets more attractive to investors.
c. Ensuring Transparency and Fairness
All listed companies must meet stringent disclosure requirements. Real-time price updates, audited annual reports, and regulatory filings prevent information asymmetry.
d. Enabling Diversification
Exchanges offer thousands of instruments across sectors—technology, finance, healthcare, manufacturing, commodities—helping investors build balanced portfolios.
e. Supporting Economic Growth
A well-developed stock exchange promotes efficient capital allocation, encourages entrepreneurship, and attracts global investment.
3. Major Global Stock Exchanges
Around the world, there are dozens of stock exchanges, but a handful dominate in size, technology, and global influence.
a. New York Stock Exchange (NYSE), USA
The world’s largest exchange by market capitalization. Home to giants like Apple, Microsoft, and ExxonMobil. Known for high regulatory standards and deep liquidity.
b. NASDAQ, USA
A fully electronic exchange famous for technology-heavy listings—Google, Amazon, Tesla, Facebook, and Netflix. NASDAQ is often seen as the heart of global innovation.
c. Tokyo Stock Exchange (TSE), Japan
Asia’s largest exchange hosting companies such as Toyota, Sony, and SoftBank. It plays a crucial role in global manufacturing and technology sectors.
d. Shanghai Stock Exchange (SSE) & Shenzhen Stock Exchange (SZSE), China
Two of the fastest-growing exchanges. They reflect China’s economic rise and attract massive domestic and foreign investment despite capital flow restrictions.
e. Hong Kong Stock Exchange (HKEX)
Global gateway to Chinese companies. HKEX allows international investors to access mainland firms via Stock Connect programs.
f. London Stock Exchange (LSE), UK
One of the oldest exchanges. LSE is known for global listings, strong derivatives trading, and its role in European financial markets.
g. Euronext
A pan-European exchange operating across multiple countries like France, Netherlands, Belgium, and Portugal. It unifies European financial markets.
h. Bombay Stock Exchange (BSE) & National Stock Exchange (NSE), India
Two of the world’s most active exchanges by volume. NSE’s NIFTY50 and BSE’s SENSEX serve as benchmarks for one of the fastest-growing major economies.
4. How Global Stock Exchanges Operate
a. Listing Requirements
Companies must meet criteria such as minimum market capitalization, profitability, governance standards, and public shareholding norms. These requirements ensure only credible businesses list on the exchange.
b. Trading Mechanisms
Most modern exchanges use electronic limit order books where computers match buy and sell orders based on price and time priority.
c. Clearing and Settlement
Clearing houses act as intermediaries ensuring both sides of a trade fulfill their obligations. Settlement cycles, such as T+1 or T+2, dictate how quickly ownership transfers and money exchanges hands.
d. Circuit Breakers & Market Surveillance
To prevent crashes or excessive volatility, exchanges impose trading halts if indices move beyond a threshold. Surveillance systems track suspicious activity such as insider trading or price manipulation.
5. Global Interconnectivity of Exchanges
Stock exchanges worldwide are interconnected. Events in one region quickly influence others due to:
International investors and institutions moving capital across borders.
Cross-listings, where a company is listed on multiple exchanges.
ETF and derivative products tied to global indices.
Macroeconomic linkages like interest rates, GDP, inflation, and oil prices.
Technology, enabling instant order execution across continents.
For example, a similar technology sell-off in the U.S. NASDAQ may affect Asian markets the next day, as investors re-allocate risk globally.
6. Globalization and the Rise of Electronic Trading
Technology has radically transformed stock exchanges.
a. High-Frequency Trading (HFT)
Uses algorithms to execute trades within microseconds. It increases liquidity but sometimes amplifies volatility.
b. Online Brokers
Platforms like Robinhood, Zerodha, and Interactive Brokers allow retail investors worldwide to participate in global markets at low cost.
c. Crypto Exchanges
Though not traditional exchanges, platforms like Binance and Coinbase mirror exchange functions for digital assets.
d. 24-Hour Trading
Some exchanges now offer extended hours, allowing investors in different time zones to trade almost anytime.
7. Importance of Global Stock Exchanges in the World Economy
a. Wealth Creation for Investors
Stock exchanges help households grow wealth through equity investments, retirement funds, and long-term portfolios.
b. Channels for Foreign Investment
Foreign institutional investors (FIIs) move billions into emerging markets, fueling growth and globalization.
c. Benchmarking Economic Performance
Indices like S&P 500, FTSE 100, Nikkei 225, and NIFTY 50 act as indicators of economic health.
d. Risk Distribution
Through derivatives and diversified holdings, risk spreads across market participants, reducing systemic vulnerabilities.
e. Encouraging Innovation
Capital raised on stock exchanges helps fund research, expansion, and technological advancement.
8. Challenges Facing Global Stock Exchanges
a. Volatility from Geopolitics
Trade wars, conflicts, and political instability often trigger sudden market movements.
b. Differences in Regulations
Global exchanges operate under varying laws, creating complexity for multinational investors.
c. Cybersecurity Risks
Electronic systems are vulnerable to hacking, technical outages, and data breaches.
d. Dominance of Big Tech
Concentration of market capitalization in a few mega-caps sometimes distorts index performance.
e. Slowing IPO Markets
Tighter regulations and private funding alternatives make some firms stay private longer.
Conclusion
Global stock exchanges play a vital role in shaping the modern financial world. They facilitate capital flow, support economic growth, and act as hubs for investment, innovation, and wealth creation. As technology continues to evolve, stock exchanges are becoming faster, more connected, and more accessible. Yet, they also face growing challenges in regulation, cybersecurity, and global competition. Understanding their structure and dynamics helps investors, policymakers, and businesses navigate an increasingly interconnected global financial system.

US Federal Reserve Policy and Global Interest Rates1. What Is the Federal Reserve’s Monetary Policy?
The Fed’s primary goals, set by Congress, are:
Price stability (keeping inflation in control)
Maximum employment
Moderate long-term interest rates
To achieve these goals, the Fed uses policy tools such as:
Federal Funds Rate (short-term interest rate at which banks lend to each other)
Open Market Operations (buying or selling government securities)
Quantitative Easing (QE) (large-scale bond purchases)
Quantitative Tightening (QT) (reducing bond holdings)
Forward Guidance (communicating expected future actions)
When inflation is high, the Fed raises interest rates. When growth slows or unemployment rises, it cuts interest rates.
Because the US dollar dominates global reserves, trade, and debt markets, these decisions extend far beyond American borders.
2. Why the Fed Influences Global Interest Rates
Several unique factors make Fed policy globally powerful:
a) The US Dollar as the World’s Reserve Currency
Around 60% of global foreign-exchange reserves are held in USD. Many commodities—including oil—are priced in dollars. Thus, changes in US interest rates influence global liquidity and trade.
b) Dollar-Denominated Debt
Many emerging economies, corporations, and banks borrow in dollars. When the Fed raises rates, it becomes costlier to repay these loans.
c) Global Capital Flows
US Treasury bonds are seen as the safest assets in the world. Higher US interest rates attract global investors toward US assets, draining capital from other countries.
d) Synchronization of Financial Cycles
When the Fed changes policy, other central banks often adjust their own rates to prevent currency volatility or capital flight.
These mechanisms explain why the Fed is sometimes referred to as the world’s central bank.
3. How Fed Rate Hikes Affect Global Interest Rates
When the Fed raises the Federal Funds Rate, the effects spread across the world in multiple ways.
a) Strengthening of the US Dollar
Higher US rates mean higher returns for investors holding US securities. As capital flows in, the dollar strengthens.
A stronger dollar puts pressure on other currencies, particularly in emerging markets such as India, Brazil, or Indonesia. Their central banks may raise local interest rates to defend their currency, control inflation, or stabilize capital flows.
b) Rising Global Borrowing Costs
Because global finance heavily relies on USD:
Dollar loans become costlier.
International trade financing becomes expensive.
Countries with large external debt face repayment challenges.
This can trigger slowdowns in emerging markets.
c) Decline in Global Liquidity
When the Fed raises rates or conducts QT, it reduces the amount of money circulating globally. As a result:
Risky assets decline
Global stock markets fall
Investments shift from emerging markets to US Treasuries
Financial tightening spreads internationally even if local central banks do not change policy.
d) Pressure on Other Central Banks
To avoid currency depreciation or capital flight, central banks worldwide often follow the Fed by raising their own interest rates. This phenomenon is known as interest rate contagion.
Even strong economies like the EU, UK, and Japan face pressure to respond—although Japan often operates independently due to its unique monetary policies.
4. How Fed Rate Cuts Impact the World
When the Fed cuts interest rates, the international effects reverse.
a) Weaker Dollar and Stronger Global Currencies
Lower US yields reduce the attractiveness of dollar assets. Investors move money to faster-growing markets, causing the dollar to weaken.
Emerging market currencies strengthen, reducing inflationary pressures.
b) Increase in Global Liquidity
Lower US rates inject more capital into the global system. This increases:
Stock market growth
Investment in emerging markets
Commodity demand
This environment often benefits economies seeking foreign investment.
c) Cheaper Dollar-Denominated Debt
Countries holding USD debt find repayments easier. Capital becomes accessible for expansion, infrastructure, and corporate investment.
d) Monetary Easing Worldwide
Lower Fed rates give other central banks room to cut their own rates without risking capital outflows or currency depreciation.
Thus, Fed easing stimulates global growth.
5. Case Studies Illustrating Fed Impact
a) 2008 Global Financial Crisis – QE Era
After the 2008 crisis, the Fed launched massive Quantitative Easing, buying trillions of dollars in bonds.
Effects included:
Record-low global interest rates
Huge capital flows to emerging markets
Commodity boom
Global stock market recovery
Central banks worldwide followed with their own easing programs.
b) 2013 Taper Tantrum
When the Fed hinted at reducing QE:
Bond yields spiked
Global markets fell
Currencies like INR, BRL, TRY depreciated sharply
EM central banks raised rates to defend currencies
This demonstrated how sensitive global markets are to Fed communication alone.
c) 2022–2023 Inflation Cycle – Rapid Rate Hikes
To control post-pandemic inflation, the Fed raised rates at the fastest pace in decades.
Consequences:
Dollar surged to multi-decade highs
Global interest rates rose
Many countries experienced currency depreciation
Debt burdens increased
Capital fled to US markets
This period highlights the Fed’s power over global monetary tightening.
6. Why Some Countries Are More Affected Than Others
Highly Affected Countries:
Emerging markets with high dollar-denominated debt
Nations heavily reliant on foreign investment
Economies with weaker currencies
Countries running current account deficits
Examples: Turkey, Argentina, India (moderate), Indonesia, Brazil.
Less Affected Countries:
Economies with strong reserves
Countries with low dollar exposure
Export-driven economies benefiting from a weak local currency
Examples: China (to some extent), Japan, Switzerland.
7. Fed Forward Guidance and Global Markets
Even before changing actual interest rates, the Fed influences global markets through forward guidance—signals about future policy.
Markets price in:
Rate hike expectations
Economic outlook
Inflation forecasts
This anticipation affects bond yields, stock markets, and currency valuations globally.
A single line from the Fed Chair can shift billions of dollars across borders within minutes.
8. The Bottom Line – Why Fed Policy Shapes the Global Economy
The Federal Reserve influences global interest rates because:
The US dollar anchors global finance.
Global trade and debt depend on USD.
Investors react instantly to US yields.
Other central banks adjust policy to protect stability.
Financial markets are highly interconnected.
In essence, Fed policy changes set off a chain reaction across global markets—impacting foreign exchange rates, capital flows, inflation, borrowing costs, and overall economic growth.
Conclusion
The Federal Reserve’s monetary policy is not just an American concern—it is a global variable. Whether raising, cutting, or maintaining interest rates, the Fed influences global economic conditions more than any other central bank on earth. Countries adapt their policies based on Fed decisions to protect currencies, control inflation, and maintain financial stability. As long as the US dollar remains the world’s dominant reserve currency, the Fed will continue to shape global interest rates and the broader financial landscape.
Institutions Impact Stability1. Understanding Institutions and Stability
Institutions are not just buildings or government departments. They include formal systems like courts, central banks, legislatures, regulators, and law-enforcement bodies, as well as informal norms such as cultural values, social trust, and community expectations. Stability, on the other hand, means a condition where economic, political, and social systems operate smoothly without frequent shocks, conflicts, or disruptions.
Strong institutions create stability by:
Providing predictability
Reducing risk and uncertainty
Encouraging investment and innovation
Maintaining law and order
Ensuring fairness and accountability
Preventing fraud, corruption, and exploitation
Weak institutions produce the opposite: uncertainty, volatility, corruption, inequality, and conflict.
2. Political Institutions: The Foundation of Governance Stability
Political institutions include governments, parliaments, electoral systems, and administrative bodies. They shape how power is gained, exercised, and transferred.
Key Impacts on Stability:
a) Predictable Governance and Rule of Law
A stable political system enforces rules consistently. When laws apply equally to all—citizens, businesses, and politicians—confidence increases. Investors step forward, businesses expand, and citizens feel secure.
But when laws are arbitrary or frequently changed, societies experience unrest and economic stagnation.
b) Peaceful Power Transitions
Countries with strong electoral systems manage leadership changes smoothly. This reduces political shocks, coups, and civil unrest. Conversely, weak democratic mechanisms fuel instability, protests, and violence.
c) Reduced Corruption
Institutions like anti-corruption bureaus, independent media, and transparency laws help suppress misuse of power. Corruption erodes trust and creates social anger, which disrupts stability.
d) Effective Public Administration
Efficient bureaucracies ensure services like healthcare, education, infrastructure, and welfare programs reach people. When governments fail to deliver basic services, societies become vulnerable to crises and radicalization.
3. Economic Institutions: Ensuring Market Stability
Economic stability depends heavily on institutions like property rights frameworks, competition authorities, labour laws, taxation systems, and regulatory bodies.
a) Protection of Property Rights
When individuals and businesses are confident that their property, capital, and intellectual work will not be illegally taken or misused, they invest more. Secure property rights reduce uncertainty and support entrepreneurship.
b) Stable Regulatory Framework
Clear and consistent economic regulations prevent market manipulation and monopolistic practices. This protects consumers and ensures healthy competition, reducing economic volatility.
c) Sound Fiscal Policies
Institutions responsible for government budgeting and taxation maintain stability by controlling deficits, managing public debt, and preventing financial shocks. Mismanaged fiscal systems often lead to inflation, defaults, and economic collapse.
d) Labour and Employment Systems
Labour institutions—trade unions, employment laws, social security systems—balance the relationship between employers and workers. They protect workers from exploitation and ensure businesses retain flexibility.
4. Financial Institutions: Anchors of Economic and Market Stability
Financial institutions are the nerve centers of modern economies. They include central banks, commercial banks, securities markets, insurance regulators, and investment funds.
a) Central Banks: Guardians of Monetary Stability
A credible central bank ensures currency stability, controls inflation, and responds to financial crises. Predictable monetary policy boosts investor confidence and reduces economic shocks.
Weak central banks, on the other hand, create hyperinflation, currency collapse, and market panic.
b) Banking System Stability
Robust banking institutions maintain trust in the financial system. Strict regulations, risk-management standards, and deposit insurance prevent bank runs and protect savings.
c) Strong Capital Markets
Stock exchanges, bond markets, and mutual fund systems create liquidity and investment opportunities. Market regulators like SEBI, SEC, or FCA ensure transparency and prevent fraud, insider trading, and market manipulation—all essential for market stability.
d) Crisis-Management Institutions
Institutions such as financial-stability boards and resolution authorities help prevent systemic failures. They step in to support failing banks, restructure debt, and maintain market confidence during crises.
5. Legal Institutions: Protecting Rights and Ensuring Justice
The judiciary, law-enforcement agencies, arbitration systems, and dispute-resolution bodies form the core of legal institutions.
a) Contract Enforcement
A fair and efficient legal system enforces contracts reliably. Businesses operate smoothly when disputes are resolved quickly and justly, reducing uncertainty and transaction costs.
b) Human Rights Protection
Courts and constitutional bodies protect basic freedoms and prevent discrimination. A society with strong legal safeguards enjoys social stability because citizens feel protected from injustice.
c) Crime Control
Effective policing and law enforcement reduce crime, violence, and disorder. When legal institutions fail, societies experience insecurity, vigilantism, and social collapse.
6. Social Institutions: Strengthening Community and Cultural Stability
Social institutions include families, schools, religious organizations, community groups, media, and cultural norms.
a) Social Trust and Cohesion
Communities with high trust levels experience less crime, fewer conflicts, and stronger cooperation. Trust creates resilience during economic or political crises.
b) Education Systems
Educational institutions develop skilled individuals, reduce inequality, and support social mobility. A well-educated population is more productive and less vulnerable to manipulation or extremist ideologies.
c) Media and Information Institutions
Independent media promotes transparency, accountability, and informed citizenship. It exposes corruption and supports democratic stability. On the other hand, biased or captured media can spread misinformation, increasing polarization and instability.
7. Global Institutions and International Stability
Institutions like the IMF, World Bank, WTO, UN, and regional alliances promote global stability.
a) Financial Aid and Crisis Support
The IMF stabilizes currencies and helps countries overcome debt crises. The World Bank funds development, reducing poverty-related instability.
b) Trade Peace
WTO resolves trade disputes and ensures smooth global trade. Without such frameworks, global markets would face frequent conflicts and disruptions.
c) Peacekeeping Efforts
The UN and regional bodies prevent wars, mediate negotiations, and send peacekeeping forces to stabilize conflict zones.
These international institutions reduce systemic risk, promote cooperation, and maintain global economic and political stability.
8. How Institutional Weakness Leads to Instability
Weak or corrupt institutions cause:
High levels of corruption
Political turmoil
Currency devaluation
Investor flight
Poor economic growth
Civil unrest and riots
Social divisions and crime
Market collapses
Inefficient public services
Countries with weak institutions often experience recurring crises, regardless of their natural wealth or population size.
9. Conclusion: Institutions Are the Engines of Stability
Stability is not simply a product of strong leadership or economic growth; it is the result of robust, transparent, and accountable institutions that create order, protect rights, enforce laws, and support economic activity. From central banks to courts, from parliaments to schools, institutions shape the stability of nations.
Strong institutions create a cycle of:
Trust → Investment → Growth → Stability → Prosperity
Weak institutions generate the opposite:
Uncertainty → Corruption → Conflict → Instability → Decline
Therefore, the strength, credibility, and effectiveness of institutions are the single most important determinants of long-term stability in any society or economy.
Digital Dominates the Market & Old Methods Fall Behind1. Digital Transformation: Speed, Scalability, and Efficiency
Digital systems offer lightning-fast operations that traditional methods cannot match.
Where old systems depend on manual processes, paperwork, or physical presence, digital models operate instantly across the globe.
Speed
Transactions take seconds, from online banking to e-commerce checkout.
Supply chain decisions update in real time through sensors and AI dashboards.
Digital communication—emails, messaging, cloud collaboration—moves faster than traditional mail, memos, or in-person coordination.
Old methods, built on slower bureaucratic workflows, lose relevance when consumers and businesses expect instant outcomes.
Scalability
Digital platforms scale globally with minimal marginal cost.
A software company can serve millions without building new factories, whereas traditional businesses must invest heavily in infrastructure to grow.
This is why:
Digital streaming beats physical CDs and DVDs.
Online education reaches millions vs. classroom limits.
E-commerce expands without opening new stores.
Traditional models built around physical capacity struggle to expand at the same pace.
2. Data: The New Competitive Advantage
In the digital marketplace, data is the new oil—but more importantly, it becomes actionable instantly through analytics and AI.
How Digital Uses Data
Customer behavior tracking enhances precision marketing.
AI models predict demand, optimize pricing, and improve logistics.
Businesses personalize product recommendations—a feature impossible with old marketing tools.
Traditional methods like:
manual customer surveys,
limited market studies,
guess-based advertising,
cannot provide the accuracy or real-time insights needed for modern competition.
Because digital systems learn and adapt continuously, they grow more efficient over time, while old methods remain static.
3. Digital Consumer Behavior: Convenience Wins
Digital dominates markets because consumers have shifted online. Convenience is king.
What consumers now prefer:
Online shopping with home delivery
Digital payments over cash
OTT streaming over cable TV
Mobile banking over in-branch visits
Ride-hailing apps over traditional taxis
Food delivery apps over calling restaurants
Old methods fail because they require more effort, more time, and often more cost.
The demand for personalization
Algorithms tailor:
ads,
shopping experiences,
search results,
content recommendations.
Traditional one-size-fits-all approaches—newspapers, radio, physical catalogs—cannot match personalized digital experiences.
4. Automation and AI: Replacing Manual Workflows
Automation is a central reason digital dominates.
AI, machine learning, and robotic process automation reduce errors and costs while increasing throughput.
Digital automation examples:
Chatbots replacing customer service centers
AI underwriting replacing manual loan officers
Algorithmic trading outperforming human traders in speed
Robotic assembly lines increasing manufacturing efficiency
Smart warehouses with automated inventory systems
Old methods relying on manual labor or human-only operations lag because they are costly, slow, and prone to inconsistency.
5. Platform Economies Beat Traditional Business Models
Digital platforms like Amazon, Uber, Airbnb, and Google transformed markets by connecting millions of users through online ecosystems.
Advantages of digital platforms:
Zero inventory models (e.g., Uber owns no cars)
Low cost per additional user
Global user networks
Winner-take-all dynamics powered by data
Traditional industries with fixed assets, limited reach, and physical infrastructure cannot compete with the platform model’s efficiency.
6. Marketing: Digital Ads Crush Traditional Advertising
Advertising is one area where the shift is most obvious.
Digital marketing benefits:
performance tracking,
precise targeting,
retargeting,
demographic insights,
cost efficiency.
Platforms like Google Ads, Facebook Ads, and Instagram Reels allow businesses to reach exact audiences.
By contrast:
print ads,
billboards,
radio,
TV commercials
provide no precise data on who viewed or acted on the message.
Thus, traditional marketing budgets shrink every year as businesses migrate to digital channels.
7. Digital Finance & Payments Overtake Cash-Based Systems
FinTech has become one of the biggest disruptors.
Digital finance innovations such as:
UPI
e-wallets
algorithmic credit scoring
digital lending
automated KYC
blockchain transactions
are outcompeting traditional banking models.
Old cash-heavy methods or manual paperwork-based banking slow down transactions, increase risk, and limit accessibility.
Digital finance, being efficient, borderless, and transparent, dominates modern monetary flows.
8. E-Commerce and the Fall of Traditional Retail
E-commerce has redefined how people shop.
Digital advantages:
24/7 availability
more product variety
faster price comparison
personalized recommendations
doorstep delivery
easy returns and refunds
Traditional retail, despite offering physical experience, struggles with:
limited store hours,
higher operational costs,
smaller inventory,
regional restrictions.
Digital-first retailers with online-only models take the lead.
9. Remote Work & Cloud Systems Replace Traditional Office Models
The digital workplace has become dominant.
Digital tools:
Zoom, Google Meet
Slack, Teams
Cloud storage
Virtual project management tools
enable businesses to collaborate without needing physical offices.
Old workplaces requiring physical presence are falling behind due to:
higher real estate costs,
long commutes,
reduced flexibility.
Digital work increases productivity and widens talent pools globally.
10. Innovation Cycles: Digital Evolves Faster
Digital technology evolves at breakneck speed.
Every year brings:
faster processors,
smarter algorithms,
new apps,
improved networks,
enhanced automation.
Traditional industries, requiring physical upgrades, machinery, or labor restructuring, cannot update at the same pace.
Thus, over time, digital companies innovate exponentially while old industries evolve linearly—creating an ever-widening gap.
Conclusion: The Digital Wins Because It Is Faster, Smarter, Cheaper, Global
Digital methods dominate because they:
scale rapidly,
rely on data,
adapt through AI,
offer personalization,
reduce cost,
improve convenience,
operate globally with minimal friction.
Old methods fall behind because they:
depend on slower manual workflows,
require physical presence,
lack real-time data,
cannot personalize experiences,
involve higher costs and limited reach.
In today’s hyperconnected world, digital is not just an alternative—it is the primary driver of global markets. Old methods still exist, often for tradition or regulatory reasons, but their influence continues to shrink. The future belongs to systems that can evolve quickly, use data intelligently, and meet consumers’ expectations for instant, frictionless service. Digital does all this—and more—ensuring it remains the dominant force shaping the global economy.