Gold vs Real Estate: Which Is Safer?Gold vs Real Estate: Which One Truly Keeps Your Money Safe in Uncertain Times?
When markets turn unstable, the first question that always comes up is: “ How do I keep my money safe ?”
Almost immediately, two familiar names are put on the scale: gold and real estate .
One is a globally recognized defensive asset.
The other is a tangible asset tied to land and long-term growth cycles.
But safety does not lie in the name of the asset — it lies in how you use it .
Safety does not mean “never going down”
Many people mistakenly believe that a safe asset is one that never declines in price. In reality, every asset goes through corrections .
True safety means:
When you need cash, can you actually convert it?
When markets deteriorate, can you withstand the psychological and cash-flow pressure?
When the cycle shifts, does that asset help you survive?
And this is exactly where gold and real estate begin to diverge.
Gold — safety through liquidity and defense
Gold is considered safe because it does not depend on a single economy . When inflation rises, crises emerge, or confidence in fiat currencies weakens, gold is often chosen as a safe haven.
Gold’s greatest strength is liquidity . It can be converted into cash almost instantly, nearly anywhere in the world. This makes gold an effective defensive tool during periods of strong market volatility.
However, gold does not generate cash flow . Its price can also move sideways for long periods, requiring patience and a capital-preservation mindset rather than a get-rich-quick mentality.
Real estate — safety through tangibility and long-term value
Real estate feels safe because it is tangible and familiar . The land remains. The property remains. Over the long term, real estate tends to appreciate alongside economic growth and urbanization.
In addition, real estate can generate rental income , something gold cannot offer. For investors with stable capital and no pressure to rotate funds quickly, this is a major advantage.
The trade-off, however, is low liquidity . When markets weaken or credit conditions tighten, selling property can take a long time. If leverage is involved, this so-called “safe asset” can quickly become a financial burden.
The core difference: time horizon and flexibility
Gold suits investors who value flexibility and fast response .
Real estate suits those with long-term vision, substantial capital, and the ability to endure cycles .
Gold helps you defend in the short to medium term .
Real estate helps you build wealth over the long term .
No asset replaces the other.
They differ only in their role within your financial strategy .
Signals

What Is the Bull Side – and What Is the Bear Side?In trading, there are concepts that everyone has heard of , but not everyone truly understands correctly . “ Bull side ” and “ Bear side ” are two such terms. Many traders use them every day, yet often assign them overly simplistic meanings: bulls mean buying, bears mean selling.
In reality, behind these two concepts lies how the market operates , how capital flows think , and how traders choose which side to stand on .
What Is the Bull Side?
The Bull side (bulls) represents those who expect prices to rise . However, bulls are not simply about buying .
The true essence of the bull side is the belief that the current price is lower than its future value , and that the market has enough momentum to continue moving upward .
The bull side typically appears when:
Price structure shows that an uptrend is being maintained
Active buying pressure controls pullbacks
The market reacts positively to news or fresh capital inflows
More importantly, strong bulls do not need price to rise quickly . What they need is a structured advance , with healthy pauses and clear support levels to continue higher.
What Is the Bear Side?
The Bear side (bears) represents those who expect prices to fall . Like bulls, bears are not merely about selling .
The core of the bear side is the belief that the current price is higher than its true value , and that selling pressure will gradually take control .
The bear side tends to strengthen when:
An uptrend begins to weaken or breaks down
Price no longer responds positively to good news
Every rally is met with clear selling pressure
A market dominated by bears does not always collapse sharply . Sometimes, it shows up as weak rebounds , slow and extended , but unable to travel far .
When Does the Market Lean Toward Bulls or Bears?
The market is never fixed to one side . It is constantly shifting .
There are periods when bulls are in control , times when bears dominate , and moments when neither side is truly strong .
Professional traders do not try to predict which side is right . Instead, they observe:
Which side controls the main move
Which side is reacting more weakly over time
What price is respecting more: support or resistance
These price reactions reveal who is in control , not personal opinions or emotions.
Common Mistakes When Talking About Bulls and Bears
Many traders believe they must “ choose a side ” and remain loyal to it . In reality, the market does not require loyalty .
The market only demands adaptation .
Today’s bulls can become tomorrow’s bears .
A skilled trader is someone who is willing to change perspective when the data changes , rather than defending an outdated view .

Why Consistency Beats Talent in TradingWelcome all to another post! In today's post we will review the difference between Talented trading and consistent trading.
Why Consistency Beats Talent in Trading
Many new traders usually enter trading believing that success belongs to the most intelligent individuals, the most analytical, or the most “naturally gifted.” In any field.
When in reality, the market only rewards something that is far less glamorous, and that is.. consistency.
Talent can help you understand charts faster and/or grasp concepts a lot quicker, but it is consistency that determines and shows whether you survive long enough to become profitable and make a positive return.
Talent Creates Potential | Consistency Creates Results
Talent shows up early, like in the first week or two.
You might spot patterns instantly, win a few trades, or feel like trading “just makes sense” to you.
Consistency shows up later and it’s far rarer.
The market does not care how smart you are.
It only responds to:
- How often you follow your rules and system.
- How well you manage risk ( or gamble it. )
- How disciplined you are under pressure and stress
- A talented trader who trades emotionally will eventually lose, ( always lose. )
- A consistent trader with average skills can compound them steadily over time.
Why Talented Traders Often Struggle
Ironically, talent can be a disadvantage ( keep on reading )
Talented traders often:
- Rely on intuition instead of their own rules or the games rules ( or common sense. )
- Take trades outside their plan ( like above, not following their rules. )
- Increase risk after a few wins ( again, not following RM rules. )
- Ignore data because “ they feel confident ”
This leads to inconsistency big wins followed by bigger losses. ( Gambling )
The market eventually punishes anyone who treats probability like certainty.
Consistency Turns Probability into an Edge
Trading is not about being right it’s about commencing the same process over and over.
Consistency means:
- Taking only the setups you’ve defined. (Defined what A+ is)
- Risking the same amount per trade. (Risk Management)
- Accepting losses without deviation. (Moving on after a loss)
- Following your plan even after losing streaks. (Maintaining consistency)
One trade means nothing.
A hundred trades executed the same way reveal your edge.
Consistency allows probability to work for you, not against you.
The Market Rewards Discipline, Not Brilliance
The best traders in the world are not constantly trying to outsmart the market.
They:
- Trade fewer setups
- Keep their approach simple
- Protect capital first
- Let time and repetition do the work
- They understand that survival is the first goal.
- You can’t compound an account you’ve blown.
Consistency Is Boring and That’s the Point
Consistencty lacks excitement.
There are no adrenaline rushes, no heroic trades, no all-in moments.
Just repetition, patience, and restraint. This is why most people fail.
The market filters out those who chase excitement and rewards those who treat trading like a business, not entertainment.
Talent Without Consistency Is Temporary
Many traders experience early success.
Very few maintain it.
Short-term success often comes from:
- Favorable market conditions
- Random luck
- Overconfidence
Long-term success comes from:
- Process
- Risk control
- Emotional discipline
Consistency is what turns a good month into a sustainable career.
How to Build Consistency as a Trader
Consistency is a skill not a personality trait.
You build it by:
- Defining clear trading rules
- Using fixed risk per trade
- Journaling every trade honestly
- Reviewing performance regularly
- Trading less, not more
Your goal isn’t to be impressive.
Your goal is to be repeatable.
Final Thoughts
Talent may get you interested in trading.
Consistency keeps you in the game.
In a profession driven by uncertainty, the trader who shows up the same way every day will always outperform the one chasing brilliance.
In trading, consistency doesn’t just beat talent > it replaces it.
Thank you all so much for reading, I hope everyone enjoys it and that it benefits you all!
Let me know in the comments below if you have any questions or requests.
ESG and Carbon Credit TradingThe New Architecture of Sustainable Finance
In the modern global economy, sustainability has shifted from being a moral consideration to a strategic and financial imperative. At the center of this transformation lie ESG (Environmental, Social, and Governance) principles and carbon credit trading, two closely linked frameworks that are reshaping how businesses, investors, and governments measure value, manage risk, and pursue long-term growth. Together, they form the backbone of sustainable finance and climate-aligned markets.
Understanding ESG: Beyond Profits
ESG refers to a set of non-financial criteria used to evaluate a company’s operations and long-term resilience.
Environmental (E): How a company manages its impact on nature—carbon emissions, energy usage, waste management, water conservation, and biodiversity.
Social (S): How it treats employees, customers, and communities—labor practices, human rights, diversity, workplace safety, and customer responsibility.
Governance (G): How it is managed—board structure, executive compensation, transparency, shareholder rights, and ethical conduct.
Unlike traditional financial metrics that focus mainly on short-term profitability, ESG frameworks aim to capture long-term sustainability and risk-adjusted performance. Investors increasingly believe that companies with strong ESG practices are better positioned to handle regulatory changes, reputational risks, climate shocks, and social disruptions.
Why ESG Matters in Capital Markets
ESG has become a decisive factor in global capital allocation. Institutional investors, sovereign wealth funds, pension funds, and asset managers now integrate ESG scores into portfolio decisions. This shift is driven by three powerful forces:
Risk Management: Climate change, social unrest, and governance failures can destroy shareholder value. ESG analysis helps identify hidden risks.
Regulatory Pressure: Governments worldwide are mandating ESG disclosures, forcing companies to report sustainability metrics alongside financial results.
Investor Preference: A growing base of investors prefers companies aligned with ethical, environmental, and social responsibility.
As a result, ESG is no longer a “nice-to-have” feature—it directly affects stock valuations, borrowing costs, and access to global capital.
Carbon Credit Trading: Putting a Price on Pollution
Carbon credit trading is a market-based mechanism designed to reduce greenhouse gas emissions by assigning a monetary value to carbon dioxide and other greenhouse gases.
A carbon credit typically represents the right to emit one metric ton of CO₂ (or equivalent gases). Companies that emit less than their allowed quota can sell surplus credits, while high emitters must buy credits to offset excess emissions.
There are two major carbon markets:
Compliance Markets: Mandated by governments (e.g., cap-and-trade systems). Companies must comply with legally binding emission limits.
Voluntary Carbon Markets (VCMs): Companies voluntarily purchase credits to meet sustainability goals, net-zero pledges, or ESG commitments.
By attaching a financial cost to emissions, carbon trading incentivizes businesses to innovate, adopt cleaner technologies, and improve energy efficiency.
The Link Between ESG and Carbon Credit Trading
Carbon credit trading is a practical tool that directly supports the Environmental pillar of ESG. Companies with strong ESG strategies often use carbon credits to:
Offset unavoidable emissions
Achieve carbon neutrality or net-zero targets
Demonstrate measurable climate action to investors
Improve ESG ratings and sustainability scores
In essence, carbon markets convert climate responsibility into a tradable financial instrument, aligning environmental goals with market incentives.
Carbon Credits as a Financial Asset
Over time, carbon credits have evolved from regulatory instruments into tradable assets. They are now bought and sold by:
Corporations managing emissions
Financial institutions and hedge funds
ESG-focused investment funds
Commodity traders and exchanges
This financialization has increased liquidity, price discovery, and global participation, while also introducing volatility and speculation. Carbon prices now respond to policy changes, economic growth, energy transitions, and geopolitical developments—much like traditional commodities.
ESG Ratings and Corporate Strategy
Companies are increasingly embedding ESG into their core strategies rather than treating it as a compliance exercise. Carbon credit trading plays a critical role in this shift:
Operational Strategy: Firms invest in renewable energy, efficiency upgrades, and carbon offsets to reduce exposure to carbon costs.
Reputation Management: Transparent use of high-quality carbon credits enhances credibility with stakeholders.
Capital Access: Strong ESG performance lowers financing costs and attracts long-term investors.
However, the effectiveness of ESG depends on authentic action, not cosmetic compliance.
Challenges and Criticism
Despite their promise, ESG and carbon credit markets face several challenges:
Greenwashing: Some companies exaggerate ESG claims or rely excessively on low-quality carbon offsets.
Lack of Standardization: ESG ratings vary widely across agencies, creating confusion and inconsistency.
Carbon Credit Quality: Not all credits deliver real, additional, and permanent emission reductions.
Market Transparency: Voluntary carbon markets still lack unified oversight and pricing benchmarks.
These issues have sparked calls for stricter regulation, better disclosure standards, and improved verification mechanisms.
The Role of Technology
Technology is accelerating trust and efficiency in ESG and carbon markets:
Blockchain: Ensures traceability and prevents double-counting of carbon credits.
AI and Data Analytics: Improve ESG scoring, emissions tracking, and risk assessment.
Satellite Monitoring: Verifies forest conservation, renewable energy output, and land-use projects.
These innovations are helping transform ESG and carbon trading into more reliable and scalable systems.
Future Outlook: ESG and Carbon Trading as Economic Pillars
Looking ahead, ESG and carbon credit trading are expected to become central pillars of the global financial system. As climate risks intensify and governments tighten emissions regulations, carbon prices are likely to rise, making sustainability a competitive advantage rather than a cost burden.
Key future trends include:
Integration of carbon pricing into mainstream financial models
Expansion of regulated carbon markets across emerging economies
Greater convergence of ESG reporting standards
Increased investor scrutiny of carbon offset quality
Conclusion
ESG and carbon credit trading represent a fundamental shift in how markets define value, risk, and responsibility. By embedding environmental and social costs into financial decision-making, they bridge the gap between economic growth and planetary limits. While challenges remain, their evolution signals a future where sustainability and profitability are no longer opposing goals—but interconnected drivers of long-term success.
In this new financial architecture, companies that adapt early and authentically will not only comply with regulations but also gain strategic, reputational, and financial advantages in a rapidly changing world.

Cross-Border Payments: The Future of Global Money MovementUnderstanding Cross-Border Payments
At its core, a cross-border payment occurs when the payer and the recipient are located in different countries and the transaction involves at least two different currencies or financial systems. Examples include an Indian exporter receiving payment from a US buyer, a migrant worker sending money to family back home, or a multinational company paying overseas suppliers.
Unlike domestic payments, cross-border payments must navigate differences in currencies, banking regulations, time zones, compliance standards, and settlement systems. This makes them slower, costlier, and more complicated than local transactions.
How Cross-Border Payments Work
Traditional cross-border payments are typically processed through correspondent banking networks. In this system, banks maintain relationships with foreign banks (correspondent banks) to facilitate international transfers. When a payment is initiated, it may pass through multiple intermediary banks before reaching the final beneficiary. Each intermediary charges a fee and adds processing time.
The SWIFT (Society for Worldwide Interbank Financial Telecommunication) network plays a major role by providing secure messaging between banks. However, SWIFT itself does not move money; it only sends payment instructions. Actual fund settlement happens through bank accounts held across borders.
In recent years, alternative mechanisms have emerged, including fintech platforms, digital wallets, and blockchain-based systems, which aim to simplify and speed up cross-border transfers.
Key Participants in Cross-Border Payments
Several entities are involved in the cross-border payment ecosystem:
Banks and Financial Institutions: Provide traditional wire transfers and trade finance services.
Payment Service Providers (PSPs): Companies like PayPal, Wise, and Stripe offer faster and more transparent international payments.
Central Banks: Regulate currency flows and oversee payment systems.
Clearing and Settlement Systems: Ensure final transfer of funds between institutions.
Businesses and Individuals: End users such as exporters, importers, freelancers, students, and migrant workers.
Costs and Fees in Cross-Border Payments
One of the biggest challenges in cross-border payments is cost. Fees may include:
Transfer fees charged by banks or PSPs
Currency conversion or foreign exchange (FX) margins
Intermediary bank charges
Compliance and documentation costs
For small-value transactions like remittances, these costs can be disproportionately high. Reducing fees has become a global priority, especially for developing economies where remittances are a major source of income.
Speed and Transparency Issues
Traditional cross-border payments can take anywhere from one to five business days to settle. Delays occur due to manual processing, time zone differences, compliance checks, and multiple intermediaries. Additionally, senders often lack transparency on where their money is during the transfer process and what total fees will be deducted.
Modern digital payment platforms are addressing these issues by offering near real-time transfers, upfront fee disclosure, and end-to-end tracking.
Regulatory and Compliance Challenges
Cross-border payments are subject to strict regulatory requirements, including anti-money laundering (AML), combating the financing of terrorism (CFT), and know-your-customer (KYC) rules. Each country has its own regulatory framework, which can create friction and increase compliance costs.
Sanctions, capital controls, and geopolitical tensions further complicate cross-border transactions. Financial institutions must continuously monitor regulatory changes to avoid penalties and ensure smooth operations.
Role of Technology in Cross-Border Payments
Technology is transforming the cross-border payments landscape. Fintech innovations are reducing reliance on correspondent banking and improving efficiency. Key technological trends include:
Blockchain and Distributed Ledger Technology (DLT): Enables faster settlement and reduced intermediaries.
Application Programming Interfaces (APIs): Allow seamless integration between payment systems.
Real-Time Payment Networks: Enable instant or near-instant transfers across borders.
Artificial Intelligence (AI): Enhances fraud detection and compliance monitoring.
These innovations are making cross-border payments more accessible, especially for small businesses and individuals.
Cross-Border Payments and Global Trade
International trade depends heavily on efficient cross-border payment systems. Exporters need timely payments to manage cash flows, while importers seek secure and cost-effective settlement options. Trade finance instruments such as letters of credit, bank guarantees, and documentary collections are closely linked to cross-border payment mechanisms.
Efficient payment systems reduce transaction risks, improve trust between trading partners, and support global supply chains.
Importance of Cross-Border Remittances
Remittances are one of the most significant components of cross-border payments, particularly for emerging economies. Millions of migrant workers send money home regularly to support families, education, healthcare, and housing. These flows contribute significantly to national income and economic stability.
Improving the affordability and speed of remittance services can have a direct positive impact on financial inclusion and poverty reduction.
The Future of Cross-Border Payments
The future of cross-border payments is moving toward greater speed, lower cost, and enhanced transparency. Central bank digital currencies (CBDCs), global payment interoperability, and standardized compliance frameworks are expected to play a major role.
Collaboration between banks, fintech firms, regulators, and international organizations will be crucial in building efficient global payment infrastructure. As technology evolves, cross-border payments are likely to become as seamless as domestic transactions.
Conclusion
Cross-border payments are a vital pillar of the global financial system, enabling trade, investment, and personal financial connections across nations. While traditional systems face challenges related to cost, speed, and complexity, technological innovation and regulatory cooperation are driving meaningful improvements. As the world becomes more interconnected, efficient and inclusive cross-border payment systems will be essential for sustainable global economic growth.

Commodity Market Analysis1. Fundamental Analysis of Commodities
Fundamental analysis focuses on demand and supply. Unlike stocks, commodities have no earnings or balance sheets — they are influenced by production, consumption, and global events.
Below are key fundamental factors that move different commodities:
A. Energy Commodities (Crude Oil, Natural Gas)
Crude Oil
Crude oil prices depend mainly on:
OPEC+ decisions (production cuts or increases)
US crude inventory reports
Middle East geopolitical tensions
Global economic growth (energy consumption)
US Dollar Index (inverse relation)
Example:
If OPEC announces a production cut, supply decreases → crude oil prices rise.
Natural Gas
Natural gas is influenced by:
Weather conditions (winter increases heating demand)
Storage inventory levels
Gas production & LNG exports
High summer temperatures also increase electricity demand (air conditioners), boosting gas usage.
B. Precious Metals (Gold, Silver)
Gold is not just a commodity — it's a safe-haven asset.
Factors affecting gold:
Inflation data (higher inflation → higher gold)
Interest rate decisions (Federal Reserve)
Dollar Index (strong dollar → weak gold)
Global uncertainties (wars, recession fears)
Silver moves with:
Industrial demand (solar panels, electronics)
Gold correlation
Economic cycles
C. Base Metals (Copper, Aluminium, Zinc, Nickel)
Base metals depend heavily on global economic activity.
Key drivers:
China’s economic data (largest consumer of industrial metals)
Infrastructure spending worldwide
Manufacturing & construction demand
Mining output and strikes
Example:
If China announces a stimulus package → copper demand rises → copper prices increase.
D. Agricultural Commodities (Wheat, Soybean, Cotton, Sugar)
Agri-commodities depend on:
Weather (rainfall, drought, frost)
Government MSP policies
Crop cycles
Exports & imports
Example:
A weak monsoon in India → lower wheat production → wheat prices rise.
2. Technical Analysis in Commodity Markets
Technical analysis studies price action, chart patterns, volume, market structure, and indicators to identify trade setups.
Traders commonly use:
A. Candlestick Patterns
Bullish engulfing at support in gold
Shooting star in crude oil after a rally
Hammer in natural gas at bottom levels
Candlestick analysis helps identify market psychology.
B. Chart Patterns
Popular patterns in commodities:
Double tops (crude oil reversal)
Triangles (gold consolidation during FOMC weeks)
Channels (copper trending phases)
Head and Shoulders (major reversals)
Patterns show potential breakout and breakdown zones.
C. Indicators Used in Commodity Trading
Moving Averages (20, 50, 100, 200 MA)
Used to identify the trend direction.
RSI
Identifies overbought/oversold conditions.
MACD
Shows momentum shifts.
Bollinger Bands
Useful in gold and silver for breakout entries.
Volume Profile
Helps identify high-volume zones (strong support/resistance).
Since you like volume profile, this becomes important in crude & metals.
D. Market Structure Analysis
Study of:
Higher highs / higher lows
Supply and demand zones
Break of structure (BOS)
Liquidity zones
Commodities often respect clean market structure because institutions heavily participate.
Example:
Crude oil forms HH-HL structure above 50 EMA → bullish trend confirmed.
3. Sentiment & Intermarket Analysis
Commodity markets react strongly to sentiment and cross-asset relationships.
A. Dollar Index (DXY) Impact
Gold and silver move opposite to DXY
Crude also weakens when dollar strengthens
Reason: Commodities are priced in USD globally.
B. Bond Yields
High bond yields → gold falls
Low bond yields → gold rises
Gold is a zero-yielding asset, so yields compete with gold.
C. Risk-On vs Risk-Off Sentiment
Risk-off: War, recession fear → gold ↑
Risk-on: Economic growth → crude, copper ↑
Sentiment plays a huge role in short-term movements.
D. Inventory Reports
Weekly reports that move markets sharply:
EIA Crude Oil Inventory
API Inventory
Natural Gas Storage Report
Lower inventories → prices rise
Higher inventories → prices fall
4. How to Do Practical Commodity Market Analysis
Here’s a simple but powerful approach you can use daily:
Step 1: Check Global News & Macroeconomic Events
Look for:
Fed speeches
Inflation data
OPEC announcements
Weather updates
War-related headlines
These set the market bias.
Step 2: Identify Trend Using Technicals
Use:
50 & 200 EMA
Market structure
Volume profile zones
Mark supply-demand areas.
Step 3: Use Sentiment Indicators
Check:
Dollar Index
Bond yields
Equity market sentiment
VIX (volatility index)
These help you understand whether safe-haven commodities or industrial commodities will move.
Step 4: Wait for Price Action Confirmation
Look for:
Breakouts
Retests
Reversal candlestick patterns
Volume confirmation
This protects you from false moves.
Step 5: Apply Risk Management
Commodity markets are volatile.
Keep:
Proper stop-loss
Limited position sizing
Avoid over-trading during news events
5. Why Commodity Market Analysis Is Important
High Volatility = Good Opportunities
Commodities give wide movements, helpful for intraday and swing traders.
Hedge Against Inflation
Gold, silver, and crude move sharply during inflation cycles.
Global Market Connectivity
Commodity prices influence stock sectors like:
Oil & gas
Metals & mining
FMCG and agriculture
Useful for Investors and Traders Both
Whether you trade MCX, futures, or ETFs, analysis gives clarity.
6. Conclusion
Commodity market analysis is a powerful combination of fundamentals, technicals, sentiment and intermarket relationships. A successful commodity trader understands how global events, economic trends, weather patterns, and institutional activity influence price movements.
By studying:
Supply–demand fundamentals
Chart structure and volume profile
Dollar index and bond yields
Inventory reports and geopolitical news
…you can predict commodity market trends more accurately and make informed trading decisions.
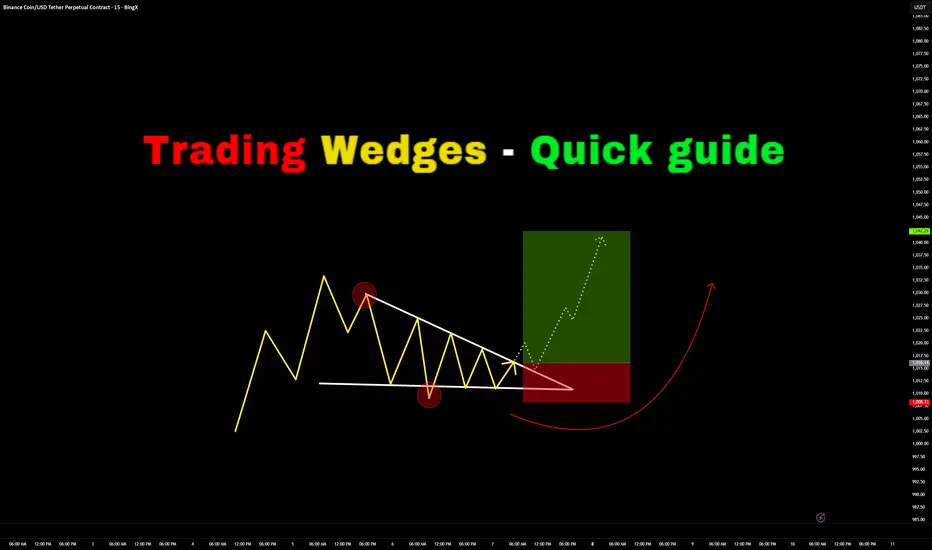
Trading Wedges - Quick Guide in 5 StepsWelcome back everyone to another guide, today we will speed run "Trading wedges" in a quick 5 step guide. Be sure to like, follow and join the community!
1) Identify the wedges:
- Falling Wedge
- Rising Wedge
- Symmetrical Wedge (Triangle)
2) Identify Breakout Direction:
- Falling Wedge > Bullish Breakout Expected
- Rising Wedge > Bearish Breakout Expected
- Symmetrical Wedge (Triangle) > Consolidation Expected
Breakout should show a candle closing outside the wedge.
3) Wait for retest to take place on previous key level or resistance (which would now be support)
If the retest holds with a strong rejection candle or consolidation - begin to long.
4) Enter Trade:
Enter on successful retest confirmation
SL for longs should be below previous low's
SL for shorts should be above previous highs.
5) TP levels:
TP 1) First high target
TP 2) Second high target
TP 3) Third high target.
RESULTS:
Price has soared up high and hit all three Take profits.
For trader who are wanting more profits you can potentially enable TP trailing afterwards - however I don't recommend this as you need to factor in your emotions of "GREED"
Thank you all so much for reading! Hopefully this is a useful guide in the future or present! If you would like me to make any simplified guides, let me know in the comments below or contact me through trading view!
Trading Global Assets: An Overview1. Types of Global Assets
Global assets can be broadly classified into several categories:
Equities (Stocks): International stocks allow investors to participate in the growth of companies worldwide. For example, investing in technology firms in the U.S., consumer goods companies in Europe, or emerging market businesses in Asia can provide diversified exposure to global economic trends. Stocks are typically traded on exchanges like the NYSE, NASDAQ, London Stock Exchange, or Tokyo Stock Exchange.
Bonds: Sovereign and corporate bonds issued by foreign governments or companies offer opportunities for income generation and portfolio diversification. For instance, U.S. Treasury bonds are considered safe-haven assets, whereas emerging market bonds may offer higher yields but higher risks.
Currencies (Forex): The foreign exchange market is the largest financial market in the world, with daily trading volumes exceeding $6 trillion. Investors trade currency pairs, such as EUR/USD or USD/JPY, to speculate on exchange rate movements or hedge against currency risks. Forex trading is highly liquid and operates 24 hours, providing constant opportunities for global traders.
Commodities: Gold, oil, silver, and agricultural products are traded globally through futures and spot markets. Commodities are influenced by global supply-demand dynamics, geopolitical tensions, and economic growth trends. For instance, oil prices may react to conflicts in the Middle East, while gold often acts as a safe haven during financial instability.
Derivatives: Options, futures, and swaps allow investors to speculate on the price movement of underlying global assets or hedge existing positions. For example, currency futures can protect multinational companies from adverse currency fluctuations, while equity derivatives can help traders leverage their market positions.
ETFs and Mutual Funds: Global exchange-traded funds (ETFs) and international mutual funds pool investor capital to invest in multiple international assets, providing diversification with relatively lower costs. These funds can focus on specific countries, regions, sectors, or themes, such as emerging markets, technology, or green energy.
2. Benefits of Trading Global Assets
Trading global assets offers several strategic advantages:
Diversification: Investing in multiple countries reduces reliance on a single economy or currency. For example, if the U.S. market underperforms, gains in Asia or Europe can offset losses.
Growth Opportunities: Emerging markets often experience higher growth rates compared to developed economies, offering potential for higher returns.
Hedging Against Domestic Risks: Global investments can protect portfolios from domestic inflation, interest rate changes, or political instability. For instance, holding foreign bonds or currencies may offset domestic stock market volatility.
Access to Innovative Sectors: Some sectors or companies may be dominant in specific regions, such as technology in the U.S., renewable energy in Europe, or manufacturing in China. Global trading allows investors to access these growth drivers.
3. Challenges and Risks in Global Asset Trading
While the opportunities are compelling, trading global assets carries specific risks:
Currency Risk: Investments denominated in foreign currencies are exposed to exchange rate fluctuations. A strong domestic currency can erode returns when foreign earnings are converted back.
Political and Regulatory Risks: Changes in government policies, regulations, or trade restrictions can impact asset prices. For instance, sudden capital controls in an emerging market can limit liquidity and access to investments.
Market Liquidity and Volatility: Some global markets, especially in developing countries, may have lower liquidity, leading to higher volatility and transaction costs.
Time Zone Differences: Global trading requires monitoring markets across different time zones, which can be challenging for individual traders. Major market sessions in New York, London, Tokyo, and Sydney affect liquidity and price movements.
Economic and Geopolitical Factors: Global macroeconomic events, such as interest rate changes, recessions, or conflicts, significantly influence asset prices. Commodity-dependent economies, for example, are vulnerable to fluctuations in oil or metal prices.
4. Trading Strategies for Global Assets
Investors and traders employ various strategies to navigate global markets:
Fundamental Analysis: Evaluating macroeconomic indicators, company earnings, interest rates, inflation, and geopolitical conditions helps investors identify undervalued assets and long-term growth opportunities.
Technical Analysis: Traders use price charts, trends, and technical indicators to forecast market movements. Technical analysis is particularly common in currency, commodity, and equity trading.
Arbitrage: Exploiting price differences of the same asset across multiple markets can generate risk-free or low-risk profits. For example, currency or commodity arbitrage takes advantage of exchange rate discrepancies.
Hedging: Corporations and institutional investors use derivatives like options, futures, and swaps to protect against price fluctuations, currency volatility, or interest rate changes.
Thematic and Sectoral Investing: Targeting specific global trends such as renewable energy, artificial intelligence, or emerging market consumerism allows investors to capitalize on long-term growth themes.
5. Role of Technology in Global Trading
Advancements in technology have revolutionized global asset trading:
Electronic Trading Platforms: Online brokerages and trading platforms enable retail and institutional investors to access international markets instantly.
Algorithmic Trading: Automated trading systems analyze market data and execute trades based on pre-set rules, improving efficiency and reducing emotional bias.
Mobile and Cloud Technology: Traders can monitor portfolios, execute orders, and analyze markets from anywhere in real-time.
Data Analytics and AI: Advanced analytics provide insights into market trends, risk management, and predictive modeling for better decision-making.
6. Regulatory Considerations
Trading global assets requires understanding and compliance with international laws and regulations. Each country has specific rules regarding foreign ownership, taxation, reporting, and trading practices. Regulatory bodies, such as the U.S. Securities and Exchange Commission (SEC), European Securities and Markets Authority (ESMA), and local central banks, govern trading activities to ensure transparency and investor protection. Investors must also be aware of tax implications for capital gains, dividends, and foreign income.
7. Conclusion
Trading global assets opens a world of opportunities for diversification, growth, and risk management. It allows investors to participate in the performance of companies, currencies, commodities, and financial instruments across continents. However, it requires careful consideration of risks, including currency fluctuations, geopolitical instability, regulatory differences, and market volatility. A well-structured approach—combining fundamental and technical analysis, leveraging technology, and adhering to risk management principles—can help investors navigate the complexities of global markets successfully.
In the modern financial landscape, globalization, technology, and innovative financial instruments have made global asset trading more accessible than ever. For long-term investors, it offers exposure to growth engines around the world. For traders, it provides opportunities to capitalize on short-term market inefficiencies. Understanding the dynamics of global economics, market psychology, and risk management is essential for anyone aiming to succeed in this interconnected financial ecosystem.
Global Trade Supply and Demand1. The Foundation of Global Supply and Demand
Supply in Global Trade
Global supply refers to how much of a particular good or service producers around the world can provide. Supply depends on:
Natural resources (oil, metals, agricultural land, minerals)
Industrial capacity (manufacturing plants, energy availability, labor force)
Technology and productivity (automation, robotics, digital infrastructure)
Cost efficiency (labor cost, taxation, energy cost)
Trade policies (tariffs, quotas, subsidies)
Geopolitical stability (war, sanctions, alliances)
For example:
Saudi Arabia influences global oil supply.
China dominates manufactured goods supply.
Brazil contributes heavily to agricultural supply.
Any disruption in these regions, such as war or drought, instantly affects global supply chains.
Demand in Global Trade
Global demand represents how much consumers, businesses, and governments worldwide want to purchase. Demand depends on:
Population growth
Income levels and economic growth
Consumer preferences
Technological adoption
Interest rates and inflation
Government spending
For instance:
Rising incomes in India increase global demand for electronics, oil, and automobiles.
The U.S. has high demand for consumer goods, creating massive trade flows from Asia.
Europe’s shift to green energy increases demand for lithium, cobalt, and rare earth metals.
2. How Global Trade Supply Meets Demand
The world is connected through supply chains, transportation networks, and financial systems. These create a structure where goods move efficiently from areas of high supply to areas of high demand.
Trade Routes and Logistics
Key supply–demand connections rely on:
Shipping lanes (Suez Canal, Panama Canal)
Rail networks (China–Europe rail corridors)
Air freight (high-value goods)
Digital trade platforms
Port infrastructure
When a major route is disrupted (e.g., Suez Canal blockade), supply delays cause global price spikes.
Global Value Chains (GVCs)
Most products today are not made in one country; they involve multiple supply chains:
iPhones: designed in the U.S., assembled in China, components from Japan, Korea, and Taiwan.
Automobiles: global sourcing of steel, electronics, engines, and software.
These interconnected systems allow nations to specialize in what they do best, optimizing global supply.
3. Imbalances Between Supply and Demand
Global trade often experiences gaps where supply does not match demand. These imbalances lead to price volatility and economic consequences.
Excess Supply
Occurs when production exceeds consumption:
Oil surpluses cause price crashes.
Overproduction of steel in China creates global price suppression.
Oversupply in agriculture reduces farmers’ income.
Excess Demand
Occurs when demand outstrips supply:
Semiconductor shortages (2020–2022) stopped automobile production.
High demand for housing materials during economic booms increases lumber and steel prices.
Increased energy consumption leads to shortages and higher fuel prices.
These imbalances often spark inflation, currency fluctuations, and government interventions.
4. Factors Influencing Global Supply and Demand
A. Economic Growth Cycles
During economic expansions, demand for commodities, raw materials, and manufactured goods increases. During recessions, global demand falls, pushing down prices.
B. Technological Changes
Automation, artificial intelligence, and digital tools reduce production cost, increasing supply capacity. Meanwhile, technology creates new demand sectors—electric vehicles, smartphones, green energy infrastructure.
C. Geopolitics
Wars, sanctions, and diplomatic tensions directly affect supply:
Russia–Ukraine war disrupted global grain and energy supply.
U.S.–China trade tensions impacted electronics and chip manufacturing.
Middle East conflicts threaten global oil supply routes.
D. Climate Change
Extreme weather disrupts agricultural supply, energy networks, and shipping infrastructure. Rising temperatures reduce crop yields, creating demand pressure for food imports.
E. Demographics and Urbanization
Countries with young populations (India, Africa) generate massive future demand. Aging societies (Japan, Europe) shift demand to healthcare and services rather than manufacturing goods.
5. Pricing Mechanism in Global Trade
Prices act as a bridge between supply and demand. When demand rises faster than supply, prices increase. When supply rises faster than demand, prices fall.
Commodity Prices
Oil, gold, natural gas, and metals are highly sensitive to global events. They are traded on international exchanges where prices adjust instantly.
Currency Influence
Exchange rates impact trade flows:
A weaker currency boosts exports (cheaper for foreign buyers).
A stronger currency increases imports (cheaper to buy from abroad).
Central banks indirectly shape global supply and demand through monetary policy.
Transportation and Freight Costs
Global freight rates significantly influence trade economics. For example, during the pandemic, container shipping prices rose nearly tenfold, affecting supply and causing inflation worldwide.
6. Global Supply Chain Disruptions
Modern trade depends on smooth logistics and political stability. Disruptions include:
Pandemics (COVID-19 halted production and shipping)
Natural disasters (Earthquakes in Japan disrupted electronics supply)
Strikes (Port strikes slow imports and exports)
Energy crises
Cyberattacks on infrastructure
Such disruptions create domino effects across industries and borders.
7. The Future of Global Supply and Demand
The global trade landscape is currently undergoing transformation. Several trends will shape the future:
A. Nearshoring and Friend-shoring
Companies are moving supply chains closer to home or to politically aligned countries to reduce risk.
B. Automation and Digital Trade
Robotics, 3D printing, and e-commerce reduce dependence on global labor and physical supply chains.
C. Renewable Energy Demand
The shift from fossil fuels to solar, wind, and electric mobility is increasing demand for lithium, nickel, copper, and rare earth metals.
D. Evolving Consumer Preferences
Sustainability, ethical sourcing, and climate-friendly production are becoming decisive factors.
E. Multipolar World Economy
Trade is shifting from U.S.–China dominance to a more diversified pattern involving India, ASEAN, Africa, and Latin America.
Conclusion
Global trade supply and demand form the backbone of the world economy. They determine how goods flow across nations, influence prices, shape geopolitical strategies, and affect the daily lives of billions. The interaction between how much countries can produce and how much the world wants to consume drives growth, development, technology, and innovation.
As globalization evolves, understanding global supply–demand dynamics becomes crucial for governments, businesses, traders, and consumers alike. The countries that manage supply efficiently and meet shifting global demand will remain dominant players in the world market.
5 Key Trading Tips for BeginnersWelcome back everyone to another post! In this article we will be explaining 5 key pointers (tips) for new individuals entering the trading space.
When it comes to trading first there is “ understanding ” before we begin the 5 keys steps. Let me assist you in understanding what will happen when you take on trading.
Trading is a challenge. Not a video game challenge, not a math test challenge – a * Challenge * One that will break you. Trading will break you mentally, physically, spiritually and financially. It is an eye-opening journey.
Trading will teach you a lot about yourself, and it will teach you a lot about discipline, patience and how you can analyze markets.
I saw a quote somewhere, it said trading: “ Trading is the hardest way, to make easy money ” and they are right.
You will be learning how to manage risk, control your emotions, understand your own decision-making patterns. These are all invaluable lessons for life, as well as trading.
Sounds great! But then there are the losses, what you lose to gain all this. Trading isn’t something that you can learn overnight – all those posts you see about a young 17-year-old “ cracking the code ” is rubbish. Why? Because they haven’t learnt life lessons.
You can make money fast, but you will lose it faster if you don’t know how to manage it.
Trading will drain every bit of energy out of you. You will feel like you’re falling behind, you will eventually collapse at every loss and become frustrated. The market will test you; the market doesn’t give a damn about you – you accept the risk when you take on trading and since you’re the one making the trades, it’s you VS you.
You’re testing yourself. You agree to test your patience, your confidence, your mindset. Doing so will make progress feel nonexistent or slow.
Every day, and every trade you will question yourself, wondering if “trading” is even for you. Sometimes it will feel like you’re going in circles. You will continue to make mistakes repeatedly. It will become exhausting but remember – only experience and your own strengths will allow you to succeed. Only those who can endure the grind without giving up will make it.
So, let’s start off the 5 key pointers that will prepare you.
1) Prioritize Risk Management Over Profits:
Most newbies focus first on “ making money ” rather than safeguarding capital. The reality is that surviving in the market is way more important than winning every trade you see or come across.
Key Points:
Determine risk per trade: A common rule is risking no more than 1-2% of your trading account on a single trade. This way even a string of losses will not wipe you out.
Always use stoploss: A defined maximum loss per trade enforces discipline and emotions to stay in check.
Position sizing: Your sizing should be proportional to what you’re willing to lose on each trade. Bigger trades amplify the losses, but they also amplify the profits.
Why it matters:
Without strong risk management, even a high win-rate strategy can fail. Protecting capital ensures you’re still in the game when opportunities arise.
2) Develop a trading plan and stick to it .
Random reactive trading is the best way to lose money. Build your plan overtime.
Key points:
Define your strategy: Building your strategy is the longest part, constant back testing and forward testing, refining and rebuilding. You’re not “switching” your strategy if you’re adding something small to it, you’re changing it if you eliminate the whole thing.
Identify your form of trades, short, mid, long term or swing trades.
Set clear rules: Don’t leave anything to chance, for example “I only enter trades if price closes above the 50ema and RSI is above 50”
Journalling trades: Ensure to journal all your trades, “How do I journal” Easy. Record the time, date, symbol, pair, what model/system you used, images, your entry, tp and exit, why and for how long you’ll have it open.
Why it matters:
Consistency is a key, it pairs with discipline, psychology and lingers with risk management. Traders who follow a disciplined system perform better than those to trade off an impulsive feeling. Other words “Gamble”
3) Master one market and one system first:
Beginners usually spread themselves too thin, trying forex, crypto, stocks and commodities all at once – Unfortunately for me I made this mistake at the start which made it very difficult! – Don’t do this. Stick to one market.
Key points:
Pick one market: Each market has its own rhythm, volatility, and liquidity. Teaching one thoroughly allows you to understand everything about it.
Focus on one system: Instead of trying every new system from you tubes or forums, master one approach and refine it onwards e.g. – you trade FVGs, Win rate is 50% once you add Fibonacci it might be e.g. 65%
Avoid information overload: Social media and trading forums are filled with conflicting advice, stick to your chosen approach and refine it. People say you need to have 12-hour trading days. If you do this, you will FAIL. You will grind yourself into the ground and face burnout making it very difficult to get back up again. Limit yourself to how much trading and trading study you do a day. Eg 10 back test trades, 3 real trades, 3 journaled trades, 1 hour of studying and researching the market.
Without strong risk management, even a high win-rate strategy can fail. Protecting capital ensures you’re still in the game when opportunities arise.
Why it matters
Depth beats breadth early on. Mastering a single market and system will allow you to build confidence and improve your edge.
4) Understand the Psychology of trading.
Trading isn’t just numbers: as mentioned in “understanding” it’s a test of emotional control, fear, greed and impatience.
Key points:
Emotions vs logic: ensure you recognize emotional reactions like FOMO (Fear of missing out) or revenge trading. Pause before reacting to a trade that will go against you.
Set realistic expectations : Markets move slowly. Sometimes for months, don’t expect huge gains overnight. Just like DCA focus on compounding. Compound your knowledge and skill set.
Mindset training: Techniques like medication and journaling as well as visualization can help reduce stress and maintain discipline.
Why it matters:
Even a diamond system can still fail if emotions drive your actions. Psychology often determines long term success, more than technical skill.
5) Prioritize learning. Then earning.
Beginners fall into the trap of trading being a “get rich quick” scheme. But the real investment is learning how the market works.
Key points:
Paper and demo trade first: Practice on demo accounts before you use real money – you will be surprised how many times you will fail. It’s better to fail with simulation money than your McDonalds weekly wage.
Review every trade: Analyze your losing trades, but also your winning trades. Find patterns and areas to improve.
Continuously educate yourself: Read books about the mind, about habits, watch market analysis but critically, apply what you learn and don’t just collect information and not use it.
Why it matters:
Earnings are just the byproduct trading. The faster you learn and adapt, the sooner your profits will appear. Treat early losses as tuition. Not failure.
Thank you all so much for reading.
I hope this benefits all those who are starting off their trading journey. If you have any questions, let me know in the comments below!

Understanding Discipline in TradingWelcome back everyone to another post. In today’s article we will dive deeper into the 3 keys of Trading success! As attached below.
Today we will be reviewing the Key “DISCIPLINE”
Just like risk management and Psychology this is also a difficult skill to maintain.
In the modern world it’s considered a skill now, because most of society doesn’t have any discipline in any field.
Let’s get started.
Definition:
When it comes to Trading Discipline. Trading Discipline means one user has the mental ability ( strength ) to follow their system. Their Trading Plan, risk management and maintain their psychology regardless of what events happen.
Trading Discipline separates profitable traders from the gamblers.
(Below I have attached the article Trader or Gambler as it relates to this post, make sure to give it a read!)
Discipline ensures that the user makes the right decisions based on strategy and logic instead of FOMO, ego and greed.
It is not just about following rules though. Discipline relates to the outside world of cultivating habits, mindsets and self-control too.
1) Understanding Trading Discipline
Firstly, you must truly grasp what it actually means. Most individual traders confuse it with stubbornness. They think it’s about holding on to trades or forcing a system. In reality, it’s only about consistency and self-control! Simple right?
Example:
Imagine, you have a system. A trading plan. It has the 1% rule where you don’t risk more than 1% of your account per trade. Understanding discipline means you must know why that rule is in place. It’s too protected your capital! Not breaking it after a few losses just to catch up.
Real Life Analogy:
A professional runner trains every day. They do it even when they are sad, tired, unhappy and unmotivated. This is discipline. Discipline drives long term results. Discipline is continuing it no matter what the current situation is.
2) Implementing Trading Discipline
The process of implementation is nothing complicated. It’s only turning knowledge into action. Knowing about it won’t do anything, you must maintain the effort of consistently applying it to each step in your system.
How to implement it:
- Follow your plan: Before each trading day starts, read out your system and tell yourself you will follow it. Even if no set ups appear, you will still succeed because you followed your plan.
- Set risk rules: Apply proper risk management and lot management so you don’t cave into fear. Apply the 1:3 Rule or 1:4 Rule.
- JOURNAL your TRADES Damn it: Record every trade, your reasoning, and whether you actually followed your rules. Don’t just add a screen shot and nothing else. YOU won’t succeed if you don’t journal your trades properly.
Example:
A novice trader may plan to place an entry when price is at $50 and exit at $55 with a 2% risk per trade. Even if it dips to price $48, they hold to the stop loss accepting the loss instead of moving it and hoping it “recovers”
Real Life analogy:
Think of it as budgeting every day, or for a holiday, or your next maccas run. You set a weekly budget plan and stick to it. Even when tempted by special deals, sticking to your budget allows for long term financial health to take place. Just like risk management but with real life.
3) Maintaining Trading Discipline
Discipline can’t act overnight, it’s the process of small steps working your way up to solid consistency over time. Even when feelings run high – discipline isn’t one time. It’s daily practice.
Some strategies are:
- Reviewing your previous trades daily or at the end of each week during a market close. Assess your wins and losses.
- Build up emotional awareness, be aware of what fear, greed and overconfident emotions take place.
- Reward yourself to the rules of your system, not just profitable outcomes.
If you reward yourself for not trading in one day because not a single set up appeared, you were still successful because you didn’t “force” a set up and take a gamble.
Example:
A trader might experience 3 losses in the first hour of the day, even if they were all A++ set ups. Instead of revenge trading, he sticks to his plan, accepts the L and leaves the charts for the rest of the day to reset mentally and gain a win in another field, eg – Gym.
Real-life analogy:
By maintaining a healthy lifestyle, you must apply the same approach. You don’t stop exercising after a few days off. Discipline keeps you aligned even when your motivation and mental strength fades.
4) Adapting without breaking your Discipline
Long story short, Markets move, Markets change, Markets can and WILL evolve.
Traders must adapt. Not just allows their system to adapt, but their psychological mindset of discipline.
Adapting can be confusing but it can be done by:
- Don’t switch up new strategies, adjust your current system slightly then back test and forward test it on demo accounts. Eg Paper trading.
- Update your trading system based on data and monthly results, not emotions.
- Avoid making sudden changes right after losses.
Example:
Let’s say a forex strat no longer works due to low volume and volatility. A strict trader tests adjustments in their demo accounts, then incorporates them into the plan after they have received positive data from tests.
Real-life analogy:
A chef might change his recipe based on a specific ingredient availability but will not ignore the core cooking principles. It’s about adapting strategically, not impulsively.
5) Reinforcing Discipline Through mindset and daily life.
Discipline in the trading field is just amplified by the discipline process outside of trading. It follows the exact same process. Daily habits and mindset directly impact one’s trading performance.
To reinforce discipline, you can:
- Maintain routines: Wake up at consistent times. Don’t wake up at 3:00am to “grind” if you do that, you’re stupid – you’ll burn yourself out and make the process harder.
Plan your day and review goals. Eg do a brain dump every morning, write down or type out all ideas, thoughts and emotions and sort it out.
- Practice mental training: People suggest doing personal journaling or meditation. Just go for a walk in the morning for 5 minutes. First thing in the morning, feel the fresh breeze, air, sunlight and nature. You simulate the mind and body in a natural way allowing for you to think clearly and train your mind.
- Change your environment: surround yourself with work dogs, people who are strict on routines, self-improvement, self-development, individuals who don’t slack off.
Example:
Traders who can control their time well, exercise, eat healthy can maintain their stress in trading better than one who does not focus on outside habits.
Real-life analogy:
A school student who studies consistently every day and night rather than squishing it all in before exams perform better. Just like a trader who can maintain structured habits inside and outside of the market.
Conclusion:
Trading discipline is more than following rules, it’s a mindset and a lifestyle, it relates to the world outside of trading. Just like psychology, if you can’t master it outside, you won’t master it inside.
It's about understanding your own weaknesses and adjusting the system to hold structured rules that will allow it to be more easily achievable for yourself.
Remember, trading is not sunshine and rainbows.
It’s about building a system and following it. It is the hardest way to make “ easy ” money.
To find out what the other 2 keys are, review the 3 posts below where I explain the 3 keys to trading success, and go deeper into each of them!

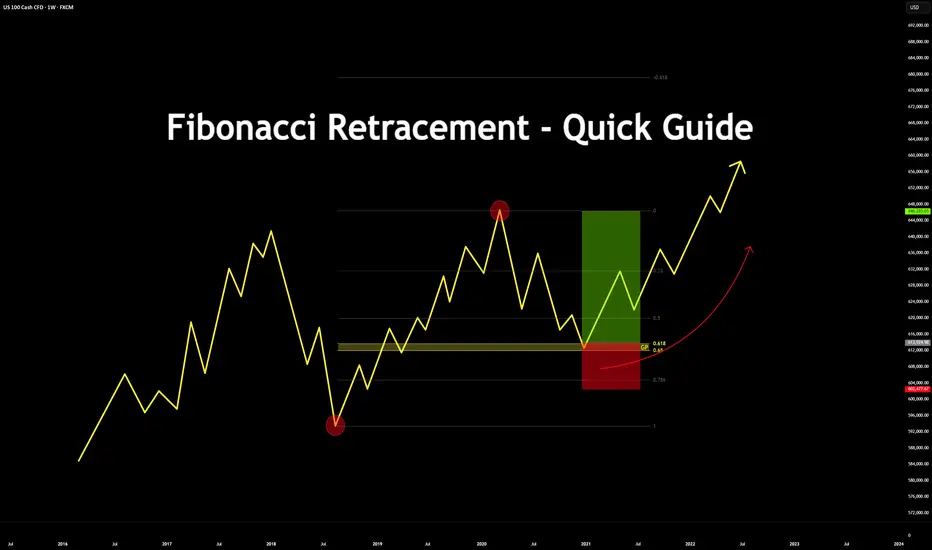
Fibonacci Retracement - Quick Guide in 5 StepsTrading the Fibonacci Retracement - Quick Guide in 5 Steps.
What is the Fibonacci tool?
The Fib Retracement Tool is a tool used widely across many charts. From crypto to stocks.
It assists in identifying the Golden Pocket, along with any potential Support and Resistance zones based on the sequence in Fibonacci.
Investors & Traders draw it from a previous high/low or low/high.
On a chart, each key level shows where price might pause or reverse during a pull back, before it continues the trend.
In this guide you will learn how to use the Fibonacci tool in 5 steps.
1. Configurations
Open up your Fib Retracement Tool's settings, apply the below configurations.
(You can change the color to your choice)
2. Identify High/Low's
Identify, recent highs and lows of your current chart/pair.
3. Applying Fib Retracement
Select your Fib Retracement tool. Place it on your chart starting from the swing low to the swing high.
4. Once completed
Highlight the Golden Pocket Field in the zone (0.65-0.618)
5. Review Entry
Price will eventually make it's way back down to the Golden Pocket to retest and reverse.
SL Placement would be on a previous low or key level, TP placement would be at a previous high or key level.
Bonus:
See the real time example below:
Please like, comment and follow if this guide was useful to you.
If you have any requests on analysis or tutorial requests, let me know and I'll be happy to make one!
Understanding Psychological LevelsDefinition:
In Trading, Psychological levels are often called round numbers or psy levels.
This is because the price ends in zeros and fives naturally attracting a trader’s attention.
Examples:
• Forex: 1.0000, 1.0500, 1.1000
• Stocks: $50, $100, $150, $200, $250
• Cryptocurrency: $10,000, $15,000, $20,000, $25,000
These levels are crucial as traders instinctively see targets in round numbers. (Or Incremental levels such as 5, 10, 15, 20, 25, 30 and so on...
This causes many buy, sell, and stop orders to cluster around the same price zones, creating self-reinforcing areas of interest in the market. Again, price sits at 113.2k – Psychological level is 115k.
___________________________________________________________________________________
Why Psychological Levels Matter in Trading
1) Human Bias:
Traders and investors often place orders at simple, rounded numbers. This makes their charts and order list “Clean.”
2) Institutional Targeting:
Large groups, whales or organizations use these levels to find liquidity or trigger stops. (Eg, BTC swept 125k before dumping)
3) Market Memory:
When a Psychological level reacts, traders remember it, and it often becomes relevant again in the future. (Turns into a prev liquidity sweep.)
5) Order Clustering:
Stop losses, take profits, and pending orders frequently build up around these areas. (As above, it builds liquidity.)
__________________________________________________________________________________
How to Identify Psychological Levels
Begin with marking clean, round (or quarterly) numbers on your chart. These are often major levels such as 4.0000, 5.0000, or 6.0000.
See the example below:
Then identify the midpoints/quarter points between them, like 4.5, 5.5, 6.5, 7.5, 8.5
See the example below:
For stronger assessments, look for psychological levels that align with other forms & tools of technical confluence—such as previous S & R, Supply/Demand, Highs & Lows, Fibonacci retracements, trendlines, or volume clusters.
See the example below:
When multiple forms of technical evidence converge near a round number, the level tends to have greater impact.
__________________________________________________________________________________
Trading Around Psychological Levels
When price approaches a psychological level, three common behaviors can occur:
1) Rejection:
Price touches the level and reverses quickly, suggesting strong defense by buyers or sellers. (Liquidity Sweep)
2) Break and Retest:
Price breaks through the level, then revisits it to confirm it as new support or resistance.
3) Compression or Grind:
Price consolidates near the level before a breakout as liquidity builds up.
Practical Application:
Enable alerts slightly before major psychological levels to observe reactions in real time (for example, 4.45 instead of 4.5 ). Wait for confirmation using price action such as a clear rejection wick, an engulfing candle, or a BOS (Break of Structure). Combine this analysis with liquidity or other forms of technical tools for a stronger assessment.
__________________________________________________________________________________
Trader Behavior at These Levels
Market reactions at psychological levels are largely directed by emotion and herd (Group) behavior. Fear of missing out can push price through a round number with momentum & speed while profit-taking can trigger short-term reversals & rejections. Stop hunts are also common, where smart money briefly pushes prices beyond a round level to collect liquidity before reversing. (From 4.0 up to 4.25 then down again)
Because many traders watch these same levels, reactions often repeat, reinforcing their significance.
__________________________________________________________________________________
Example: BTC/USD for $125k
When Bitcoin approaches $125k, many retail traders view it as a significant threshold. They might place short orders just below it or stop just above. Institutions recognize this and may intentionally push prices above $125k (sweeping $126k) to trigger those stops and fill large positions.
Once that liquidity is collected, price can reverse, and the $125k area may later serve as a new resistance zone.
This type of liquidity hunt and reversal pattern occurs frequently across all markets.
__________________________________________________________________________________
Practical Tips
1) Never trade purely based on a round number. Always wait for confirmation through structure or price action. (Retests, MSS, BOS, candle patterns etc)
2) Use alerts & alarms rather than fixed lines; prices often wick slightly above or below the exact level.
3) On higher timeframes, psychological levels often act as major turning zones. On lower timeframes, they tend to attract short-term reactions. (Lower the time frame, the more reactions = constant noise)
4) Combine psychological levels with liquidity, order flow, or volume analysis for a more complete view.
__________________________________________________________________________________
Summary
Psychological levels are where human reactions and liquidity meet. They represent areas of emotional and institutional/organizational interest rather than fixed points of reversal.
By understanding how traders behave around these zones and observing how price reacts to them, you can determine key movements with greater confidence.

Fibonacci Arcs in Stock TradingFibonacci Arcs in Stock Trading
Fibonacci arcs, derived from the renowned Fibonacci sequence, offer a compelling blend of technical analysis and market psychology for traders. By mapping potential support and resistance areas through arcs drawn on stock charts, these tools provide insights into future price movements. This article delves into the practical applications of Fibonacci arcs in trading, their interplay with market psychology, and best practices for effective use.
Understanding Fibonacci Arcs
The Fibonacci arc indicator is a unique tool in technical analysis derived from the famed Fibonacci sequence. It’s crafted by drawing arcs at the key Fibonacci retracement levels - 38.2%, 50%, and 61.8% - from a high to a low point on a stock chart. Each curve represents potential support or resistance areas, offering insights into the stock’s future movements.
The art of arc reading, meaning interpreting these curves, is crucial for traders. When a stock approaches or intersects with an arc, it reflects a significant reaction level. For instance, if a stock price touches or nears an arc, it could face arc resistance, indicating a potential halt or reversal in its trend.
Applying Fibonacci Arcs in Trading
In the stock market, these arcs serve as a guide for traders seeking to anticipate future price movements. When applied correctly, they can provide critical insights into potential support and resistance levels. Here's a step-by-step look at how you may use them effectively:
- Identifying High and Low Points: Begin by selecting a significant high and low point on the stock's chart. In an uptrend, it’s the most recent swing high to a previous swing low, and vice versa. These are the anchor points.
- Drawing the Arcs: Once the points are selected, draw the arcs at the Fibonacci retracement levels of 38.2%, 50%, and 61.8%. They radiate from the chosen low point to the high point (or vice versa), cutting across the chart.
- Interpretation: Watch how the stock interacts with these lines. When the price approaches an arc, it might encounter resistance or support, signalling a potential change in trend or continuation.
- Timing Entries and Exits: Traders can use the arcs in the stock market as a tool to time their trading decisions. For instance, a bounce could be a signal to enter a trade, whereas the price breaking through might suggest it's time to exit.
Fibonacci Arcs and Market Psychology
The effectiveness of Fibonacci arcs in trading is deeply intertwined with market psychology. They tap into the collective mindset of traders, who often react predictably to certain price levels. The Fibonacci sequence, underlying this tool, is not just a mathematical concept but also a representation of natural patterns and human behaviour.
When a stock nears a curve, traders anticipate a reaction, often leading to a self-fulfilling prophecy. If many traders make an arc stock forecast, they might sell as the price approaches a certain point, causing the anticipated resistance to materialise. Similarly, seeing support at an arc can trigger buying, reinforcing the tool’s power.
This psychological aspect makes Fibonacci arcs more than just technical tools. They are reflections of the collective expectations and actions of market participants, turning abstract mathematical concepts into practical indicators of market sentiment and potential movements.
Best Practices
Incorporating Fibonacci arcs into trading strategies involves nuanced techniques for better accuracy and efficacy. Here are some best practices typically followed:
- Complementary Tools: Traders often pair this tool with other indicators like moving averages or RSI for a more robust analysis.
- Accurate Highs and Lows: It's best to carefully select the significant high and low points, as the effectiveness of the curves largely depends on these choices.
- Context Consideration: Understanding the broader market context is crucial. Traders usually use Fibonacci arcs in conjunction with fundamental factors to validate their analysis.
- Watch for Confluence: Identifying areas where Fibonacci levels converge with other technical signals can provide stronger trade setups.
- Practice Patience: Traders typically avoid making hasty decisions based solely on Fibonacci levels. It's usually better to wait to see additional confirmation from the price action.
Advantages and Limitations of Fibonacci Arcs
Fibonacci arcs are a popular tool in technical analysis, offering distinct advantages and some limitations in analysing stock movements. Understanding these can help traders leverage the tool more effectively.
Advantages
- Intuitive Nature: The Fibonacci sequence is a natural pattern, making the tool intuitive for traders to understand and apply.
- Dynamic Support and Resistance Levels: They provide dynamic levels of support and resistance, unlike static lines, adapting to changing market conditions.
- Versatility: Effective in various market conditions, the arcs can be used in both trending and sideways markets.
Limitations
- Subjectivity in Selection: The effectiveness largely depends on correctly identifying the significant high and low points, which can be subjective.
- Potential False Signals: Like all technical tools, they can generate false signals, especially in highly volatile markets.
- Requires Complementary Analysis: To maximise effectiveness, these curves are usually used alongside other technical indicators, as they are not infallible on their own.
The Bottom Line
Fibonacci arcs are invaluable tools in stock analysis, providing insights into market trends and potential price movements.
This article represents the opinion of the Companies operating under the FXOpen brand only. It is not to be construed as an offer, solicitation, or recommendation with respect to products and services provided by the Companies operating under the FXOpen brand, nor is it to be considered financial advice.
Wait for your EDGE...
Discipline is what separates professionals from amateurs.
Stay patient. Wait for your edge. Let the probabilities work in your favor.
👉 “Agree with this? Hit Boost to spread the message.”
#TradingPsychology #Discipline #BTC #Bitcoin #Forex
#TradingMindset #AlBrooks #TradingDiscipline #PriceAction #ForexTrading #CryptoTrading #StockMarket #MJTrading #TradingQuotes #TraderLife #MindOverMarkets

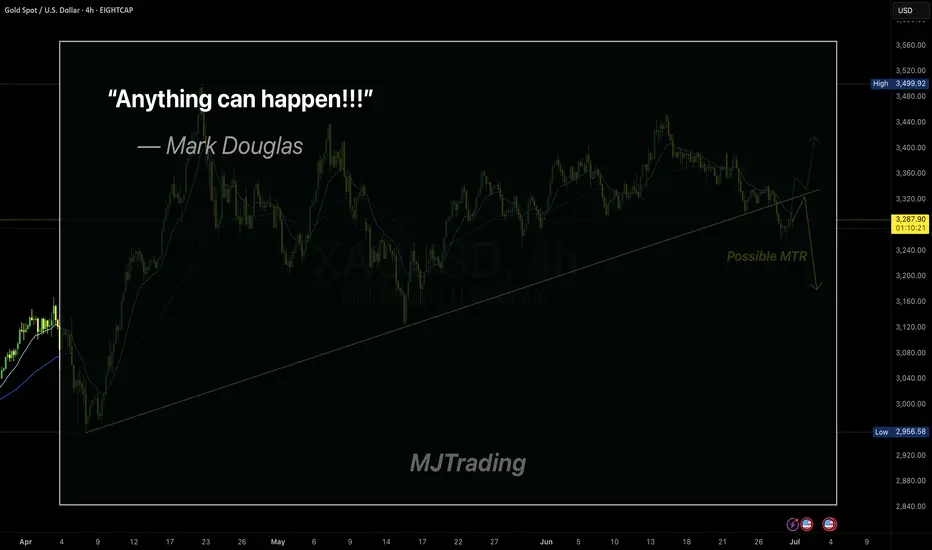
Embracing Uncertainty
In trading, the illusion of certainty is often our biggest enemy.
Even the cleanest setups—like a MTR (Major Trend Reversal)—can fail.
Mark Douglas said it best:
“Anything can happen.”
This simple truth is what keeps professional traders humble and disciplined.
Respect the market, manage your risk, and never assume you know what comes next.
Stay sharp.
#MJTrading
#GoldTrading #XAUUSD #TradingPsychology #AnythingCanHappen #MarkDouglas #ForexMindset #TradingQuotes #PriceAction #RiskManagement #MindOverMarkets #ChartOfTheDay #MJTrading
AI Algo Systems vs. Manual Trading: Which Delivers Real Results?AI Algo Systems vs. Manual Trading: Which Delivers Real Results? ⚖️
________________________________________
Introduction
With the explosive rise of artificial intelligence (AI) in financial markets, traders everywhere are asking the million-dollar question:
Should I trust my trades to automation, or keep my hands on the wheel? 🧠🤖
This guide offers a real-world, side-by-side comparison between AI-powered algorithmic trading systems and traditional manual trading. We’ll highlight where each method dominates, when they fail, and how you can combine both to build a system that outperforms the rest. 💡
What Are AI Algo Systems? 🤖
AI trading systems use advanced machine learning models to:
• Analyze huge volumes of historical and real-time data 📈
• Detect patterns and trading opportunities faster than any human
• Automatically execute trades using coded logic, without emotion
🔬 Real-World Examples:
• Neural networks (LSTM, CNN): Predicting EUR/USD direction based on years of tick data
• Reinforcement learning agents: Managing position sizing dynamically in crypto scalping
• Predictive classifiers: Spotting likely trend reversals on S&P 500 based on 20+ indicators
Key Benefits:
• 🔄 Emotionless execution: No fear, no greed, just rules
• ⏱️ Lightning-fast trades: React to price action instantly
• 📊 Pattern recognition: Finds subtle correlations people miss
________________________________________
What Is Manual Trading? 👤
Manual trading is powered by human intelligence and judgment. Traders use:
• Price action and SMC/ICT techniques (e.g., order blocks, BOS)
• Fundamental analysis: News, sentiment, macro reports
• Intuition and experience: Reading between the lines the way only humans can
🧑💼 Real-World Examples:
• A trader spots an untested order block on GBP/JPY and waits for liquidity sweep before entering
• Reading a dovish tone in FOMC minutes and fading the initial spike on DXY
• Using “market structure shifts” after a big news event to catch a reversal
Key Benefits:
• 🔍 Contextual awareness: Understand the full market story
• 🎯 Real-time adaptability: Adjust plans on the fly
• 🧠 Creative edge: Find setups no algorithm can code for
________________________________________
Side-by-Side Comparison Table 📋
Feature AI Algo Trading 🤖 Manual Trading 👤
Execution Speed Instant Slower, can lag
Emotions Involved None Prone to fear/greed
Adaptability Limited (needs retrain) High
Learning Curve High (coding/tech) Medium (market logic)
Strategy Flexibility Pre-coded only Unlimited creativity
Backtesting Automated Manual/semi-auto
Session Monitoring 24/5 via server Human-limited hours
________________________________________
When AI Algo Systems Work Best 💾
AI is unbeatable when you need:
• Scalability: Watching 10, 20, or even 100+ pairs 24/5
• High-frequency execution: Entering/exiting trades within milliseconds
• Repetitive strategies: Like mean reversion, breakout scalps, or arbitrage
📈 Example:
• Strategy: EUR/USD London open breakout
• Process: AI model detects volume and volatility spike, enters trade with 0.3% risk, targets FVG
• Results: 60% win rate, 1.8R average reward over 3 months
________________________________________
When Manual Trading Wins 🧠
Manual skills shine when you need:
• Discretionary entries: Especially with complex SMC/ICT structures
• Adapting to breaking news: Sudden CPI, FOMC shocks, geopolitical headlines
• Making sense of market narrative: When volatility is off the charts and AI gets confused
🗞️ Example:
• News: Surprise ECB rate hike
• Setup: Price sweeps liquidity and forms new order block
• Action: Trader enters based on confluence of structure, sentiment, and news
• Why AI fails: Model trained on normal volatility might get stopped out or miss entry entirely
________________________________________
Hybrid Strategy: The Best of Both Worlds 🌐
Elite traders combine the power of AI with human oversight.
Hybrid Workflow:
1. AI scans markets: Flags setups (order blocks, FVGs, volume spikes)
2. You review: Confirm bias with news, sentiment, or higher time frame
3. Entry:
o Manual (you pull the trigger)
o Semi-automated (AI suggests, you approve)
🔁 You save time, avoid missing setups, but keep critical discretion and control.
________________________________________
Risk Management: Algo vs. Manual 📊
AI:
• Stops, lot size, SL/TP are auto-calculated
• Consistent, never emotional
• Example: EA manages all USD pairs with 0.5% fixed risk per trade
Manual:
• Trader might override risk plan
• Discipline needed—easy to “revenge trade” after a loss
• Example: You up your risk size after a losing streak, breaking your rules
Best Practice:
📌 Let AI calculate risk size. Manually approve or override the entry. Double safety net.
________________________________________
Trader Case Study 👤
Name: Ray – $100K funded prop trader
Style: Hybrid (AI scanner + manual ICT confirmations)
Process:
• Sets HTF bias each morning
• AI scans for OB/BOS setups during NY session
• Manual review before entry
Performance:
• Win rate: 63%
• Avg R: 2.5
• Monthly gain: 9.7%
Ray’s Words:
“AI catches what I can’t see. I catch what it can’t understand.”
________________________________________
Mistakes to Avoid ❌
• 🚫 Blindly trusting black-box AI: Always verify signals
• 🚫 Micromanaging every tick: Let automation work, don’t over-interfere
• 🚫 Running AI during high-impact news: Most bots aren’t built for chaos
• 🚫 Ignoring psychology: Even if AI executes, your mindset impacts risk and management
________________________________________
Conclusion ✅
There’s no one-size-fits-all answer. The best traders in 2025 master both worlds. Here’s the winning formula:
• Harness AI’s speed and pattern recognition
• Lean on manual judgment for narrative and nuance
• Blend them with intention and structure for a trading system that’s fast, flexible, and resilient.
💥 Don’t pick sides. Master both.
That’s how the top 1% trade today—and win. 🚀⚙️📊

How to Secure Prop Firm Funding: Proven Strategies to Pass1️⃣ How to Secure Prop Firm Funding: Proven Strategies to Pass Challenges 📈
Introduction ✨
Securing prop firm funding opens the door to trading substantial capital and achieving financial freedom. However, passing these evaluations requires meticulous strategy, disciplined execution, and smart risk management. This article provides actionable strategies, optimized trading setups, and insights on leveraging AI to ensure you successfully navigate and pass your prop firm challenges.
Understanding Prop Firm Evaluations 📊🔍
Prop firm challenges typically include specific trading objectives:
💰 Profit targets (8–10% within 30 days)
⛔ Daily loss limits (usually 5%)
📉 Maximum drawdown limits (typically 10%)
💡 Tip: Print the rules and display them at your workspace to avoid rule breaches.
Focus on One High-Probability Strategy 📌🎯
Consistently profitable traders use one rigorously tested strategy. For example, a popular setup:
🔄 Liquidity Sweep: Wait for price to clear stops above recent highs or lows.
⚡ Market Structure Break (BOS): Enter after price breaks and confirms a new trend.
📥 Entry: Order block (OB) or Fair Value Gap (FVG).
Example Trade:
🔗 Pair: EUR/USD
🔽 Entry: OB after sweep at 1.0800
🛑 Stop Loss (SL): 1.0820
🎯 Take Profit (TP): 1.0740
📊 Risk-to-Reward Ratio (RRR): 3:1
Start Small, Think Big 🧠🌱
Initially, risk only 0.5% per trade to maintain psychological comfort and buffer against drawdowns. Increase risk gradually once you have a profit cushion.
Leverage AI Insights 🤖📊
Modern traders enhance decision-making using AI-driven tools:
🟢 AI indicators for real-time liquidity detection
🔵 Predictive analytics for entry confirmations
Efficient Risk Management 🛡️⚖️
Set daily and weekly risk limits. For instance:
⏳ Maximum daily risk: 1%
📅 Weekly drawdown cap: 3%
Practical Example:
💵 If trading a $100,000 account, never risk more than $1,000 in a single day.
Journaling for Improvement 📒📝
Record every trade’s rationale, execution details, and outcome. This fosters accountability and improvement.
Conclusion ✅
Securing prop funding isn't about luck but disciplined, strategic execution. Optimize your trading, leverage technology, and strictly manage risk to ensure long-term success. 🏆

TradingView Telegram Webhook Alert [TradingFinder] No Extra Code🔷 Introduction
In this tutorial, you will learn how to send TradingView alerts automatically and instantly to Telegram without the need for coding. This system is based on the TradingView webhook, which enables receiving trading signals in Telegram channels.
Using this method, you can receive buy and sell signals for Forex, Crypto, and Stocks without any delay. The Telegram alert bot supports real-time TradingView alerts and is compatible with all technical indicators, price-based signals, and Pine Script alerts.
This method allows you to establish a direct and fast connection between TradingView and Telegram without requiring any programming knowledge. Additionally, this tool is free and does not require registration.
In this tutorial, you will first create a Telegram bot to receive trading alerts, then connect the TradingView webhook to Telegram, and finally, learn how to manage trading signals automatically and without delay.
🔷 HOW TO SET UP TRADINGVIEW ALERT WEBHOOK FOR TELEGRAM WITHOUT CODING?
Now, let’s go through the step-by-step process of setting up TradingView alerts to be sent instantly to Telegram using a webhook, without any coding required.
🔶 Step 1: Find BotFather on Telegram
To create a new bot for receiving TradingView alerts, you first need to access BotFather on Telegram.
Open the Telegram app or go to Telegram Web.
In the search bar, type @ BotFather and select the verified BotFather account (as shown in the image).
Click on BotFather to start creating your bot.
This bot will help you generate an API token that is essential for setting up the webhook connection between TradingView and Telegram.
🔶 Step 2: Create a New Telegram Bot Using BotFather
Once you have opened BotFather on Telegram, follow these steps to create your bot :
Click the START button to activate BotFather.
Type /newbot and press Enter to create a new bot.
BotFather will ask you to choose a name for your bot. Enter a unique name (e.g.,Alert TV to Telegram).
Next, you need to choose a username for your bot. It must end with bot (e.g., Alert_TV_bot).
Once the bot is successfully created, BotFather will provide you with a unique API token. This token is essential for connecting your bot to TradingView Webhook. Keep it secure and do not share it with anyone.
🔶 Step 3: Add the Bot as an Admin to Your Telegram Channel
Now that you have created your bot, you need to add it as an admin to your Telegram channel where you want to receive TradingView alerts.
Follow these steps :
Search for your bot in Telegram by typing its username (e.g., @Alert_TV_bot) in the search bar.
Open your bot's profile and click "Start" to activate it.
Create a Telegram channel (or use an existing one) where you want the alerts to be sent.
Open the channel settings and go to Administrators > Add Admin.
Search for your bot using its username and select it.
Grant the necessary permissions :
Enable "Manage Messages" so the bot can send alerts.
(Optional) Enable "Change Channel Info" if you want the bot to update channel details automatically.
Click Save to confirm the changes.
🔶 Step 4: Generate the Webhook URL for TradingView (Public & Private Channels)
To send TradingView alerts to Telegram, you need to generate a Webhook URL. The format of this URL depends on whether you are sending alerts to a public channel or a private channel. Additionally, the message text must be URL Encoded to ensure it is processed correctly.
🔹 Webhook URL for Public Telegram Channels
If your Telegram channel is public, use the following format for your webhook URL :
api.telegram.org
Replace the placeholders with :
→ The API token from BotFather.
→ The username of your public Telegram channel (without the "@" symbol).
→ The URL Encoded alert message.
📌 Example :
If your bot token is 123456789:ABCDefGHIjklmnopQRSTuvwxYZ and your public channel username is TradingAlertsChannel, the webhook URL will be :
api.telegram.org
🔹 Webhook URL for Private Telegram Channels
If your Telegram channel is private, you cannot use a username (@channel_name). Instead, you must use the chat ID.
Follow these steps :
🔸 Step 1: Get the Chat ID of the Private Channel
There are two ways to get your private channel's chat_id :
Method 1: Using @ userinfobot
Forward any message from the private channel to @ userinfobot in Telegram.
The bot will reply with details, including the chat_id (which is a negative number, e.g., -1001234567890).
Method 2: Using Telegram API (getUpdates)
Open a browser and enter the following URL :
api.telegram.org
Replace with your bot’s API token from BotFather.
Press Enter, and you will see a response containing messages, including the chat_id of your private channel.
The chat_id will look something like -1009876543210.
🔸 Step 2: Use the Webhook URL Format for Private Channels
Once you have the chat_id, use the following webhook format :
api.telegram.org
Replace the placeholders with :
→ The API token from BotFather.
→ The numeric chat ID of your private channel (e.g., -1009876543210).
→ The URL Encoded alert message.
📌 Example :
If your bot token is 123456789:ABCDefGHIjklmnopQRSTuvwxYZ and your private channel ID is -1009876543210, the webhook URL will be :
api.telegram.org
🔶 Step 5: Configure Webhook in TradingView Alerts
Now that we have generated the Webhook URL, the next step is to configure TradingView alerts to send real-time notifications to Telegram.
Follow these steps to set up the webhook :
Open the TradingView Alert Settings
•Go to TradingView and open the chart for the asset you want to track (e.g., BTCUSD).
•Click on the Alert (⏰) button at the top of the screen.
•In the alert settings window, go to the "Notifications" tab.
Enable Webhook URL
•Check the box for "Webhook URL" to enable webhook notifications.
•Paste your Telegram Webhook URL into the box.
Example for a public channel :
api.telegram.org
Example for a private channel (with chat ID -1009876543210) :
api.telegram.org
Customize Your Alert Message
Make sure your alert message is URL Encoded (e.g., spaces should be %20).
Example message :
Hello, This is a test alert!
URL Encoded Format :
Hello%2C%20This%20is%20a%20test%20alert%21
Save the Alert
•Click "Save" to activate the TradingView alert.
•Now, whenever the alert condition is met, TradingView will send a message to Telegram via the webhook.

Price Action: Traps of Market MakersHave you ever felt confident about a market trend, only to watch the price suddenly reverse direction? Or found yourself following what seemed like a clear price movement, only to realize it was a false signal?
Don't blame yourself or your trading strategy. What you're experiencing is likely the work of market makers who strategically create traps to trigger stop losses and pending orders. In this post, we'll dive into these market traps – learning how to identify them, understanding their different types, and most importantly, discovering how to turn them into profitable opportunities.
What are market maker traps? At their core, market traps are deceptive price movements designed to create an illusion of a genuine trend, convincing traders to take positions before the market reverses course.
📍 1. The False Double Pattern Trap
At its core, most market traps manifest as false breakouts of key levels. One of the most common examples is the deceptive Double Top/Double Bottom pattern. If you have traded these patterns, you have probably noticed something interesting: the second top is often slightly higher than the first, while the second bottom tends to be slightly lower than the previous one. This contradicts the traditional pattern theory, which suggests the second top should be lower, indicating market weakness.
What's really happening here? Large market players deliberately push prices beyond these levels to trigger the stop losses and pending orders of smaller traders. Once they've captured this liquidity, the market reverses, revealing the trap.
📍 2. The Trend Continuation Trap
This trap is perhaps the most devastating for traders. Traditional market wisdom tells us that a bearish trend consists of progressively lower highs and lower lows. When a previous high gets broken, conventional technical analysis suggests the bearish trend has possibly ended. However, reality often plays out differently. The price might briefly break above a local maximum, triggering stop orders and creating the illusion of a trend reversal. Instead of reversing, though, the price continues its original downward trajectory. This phenomenon is particularly visible on shorter timeframes like M30 or H1, where the fake breakout typically spans several candles.
When you spot a breakout against an established trend, approach with caution – it's more likely to be a false signal than a genuine reversal. In contrast, during sideways market conditions, focus on trading bounces from the channel's boundaries (upper and lower borders). This more conservative approach can help protect you from these common traps.
📍 3. The News-Driven Trap
One of the most common traps occurs during news events. You've probably experienced it: price suddenly surges in one direction, breaks through a significant level, only to reverse sharply. This classic "fake-out" catches many traders on the wrong side of the market.
A key strategy for identifying these traps is to analyze multiple timeframes. Generally, you'll want to examine both higher and lower timeframes than your primary trading window. Remember: the higher the timeframe, the fewer traps you'll typically encounter, making your analysis more reliable.
📍 4. Session Opening Traps
Trading session transitions, particularly around the London open, often create another type of trap. You might notice one price direction before London opens, followed by a different movement at the session's start, which then reverses later. These movements typically trigger stop losses at key levels before reversing.
For detailed analysis of session traps, dropping down to smaller timeframes (15M) can reveal the true price action. For instance, you might spot a clear price rise followed by a decisive bounce off a significant level like 189.500.
When you see a breakout of any significant level – whether it's a round number or a local high/low during a trend correction – approach it with skepticism. Until price firmly establishes itself in the new zone with clear confirmation, consider the possibility that you're witnessing a trap designed to collect stop losses. Remember this fundamental truth: price is more likely to bounce from a level than break through it.
📍 Practical Tips on Trading Traps
◾️ Multi-Timeframe Analysis. The key to successfully trading traps begins with analyzing multiple timeframes. When you spot a breakout of an obvious level, switch to the timeframe where the movement appears most convincing. This helps you better understand the trap's structure and potential reversal points.
◾️ Entry and Risk Management. Timing your entry is crucial. Look for the first signals of price reversal, but remember - proper position sizing is essential. Keep your stop losses tight, as the market may still produce additional spikes that could prematurely end your trade. While this approach might take practice to master, the reward potential is significant - you can set take-profit targets up to 10 times larger than your stop loss.
◾️ Position Management. Once in the trade, actively manage your position. Move your stop loss to breakeven at the first appropriate opportunity to protect your capital.
📍 Conclusion
Trading traps effectively requires patience and practice. While this strategy can be challenging to master, the ability to recognize and capitalize on these traps gives you a significant edge in the market. Many traders fall victim to these traps; learning to spot them transforms you from potential prey into a skilled hunter. Take time to practice identifying these patterns before committing real capital, and start with smaller position sizes as you develop your skills.
Traders, If you liked this educational post🎓, give it a boost 🚀 and drop a comment 📣

Stop Loss Mastery: Methods Of Trade ProtectionStop Loss and Take Profit represent the fundamental boundaries of every trade, acting as the cornerstones of risk management in trading. While both are important, Stop Loss carries particular significance and is considered more crucial than Take Profit. In manual trading, implementing a Stop Loss is absolutely essential, whereas Take Profit settings remain optional, offering traders more flexibility in managing their profitable positions. Traders can employ various methods to set their SL levels, and while specific trading systems often dictate their own rules, several universal approaches have proven effective. Let's examine one of the most common methods.
📍 On the Local Extrema
This method offers two primary variations. The first involves placing your Stop Loss relative to the signal candle. For buy positions, you would set the Stop Loss several pips below the minimum of the bullish signal candlestick. Conversely, for sell positions, you would place it several pips above the maximum of the bearish signal candlestick.
The second variation focuses on the last local extreme point rather than the signal candle itself. When opening a buy position, you would position your Stop Loss a few points below the most recent local minimum. For sell positions, you would place it above the most recent local maximum.
However, traders should be aware of a significant drawback to these approaches: their predictability. Market makers and experienced traders can easily identify these common Stop Loss placement patterns on their charts. They often exploit this knowledge by deliberately pushing prices to levels where they anticipate a concentration of Stop Loss orders. After triggering these stops and forcing smaller traders to close their positions at a loss, they frequently allow the price to resume its original direction. This practice, known as "stop hunting," particularly affects retail traders who rely on these conventional placement methods.
📍 Setting Stop Loss by Key Price Levels
When using price levels for Stop Loss placement, traders can take advantage of significant order accumulation points that are naturally more resistant to manipulation. This method requires placing the Stop Loss a few points beyond the key level - below when buying and above when selling.
A key advantage of this approach is that it typically positions the Stop Loss well beyond the last local minimum (for buy trades) or maximum (for sell trades). This strategic placement helps protect positions from premature exits that might occur with simpler Stop Loss methods.
📍 Technical Indicator-Based Stop Loss
The ATR or Parabolic SAR indicator offers a straightforward approach to Stop Loss placement that appeals particularly to newer traders. Its clear visual markers provide explicit guidance for Stop Loss positioning, with traders simply placing their stops at the SAR marker level.
This method offers an interesting advantage: traders can manually adjust their Stop Loss with each new candle formation, creating a flexible alternative to traditional trailing stops. However, like extrema-based stops, indicator-based placement can be predictable and potentially vulnerable to market manipulation.
📍 Stop Loss Based on Fundamentals
Rather than relying solely on pre-set Stop Loss levels, fundamental analysis often guides manual exit decisions. Prudent traders might close positions before significant market events, such as:
• At the end of the American trading session when market activity naturally declines
• Shortly before major economic news releases that could trigger substantial price movements
Some traders incorporate fundamental factors into their Stop Loss calculations. For instance, they might set stops based on average daily price movements for specific currency pairs - like using a 70-pip Stop Loss for FX:EURUSD trades, reflecting that pair's typical daily range.
📍 Advanced Technical Stop Loss Strategies
Beyond basic indicator-based stops, traders can employ more sophisticated technical analysis tools for exit trades. These might include:
• Moving average crossovers
• Stochastic oscillator overbought/oversold signals
These approaches often require active management, with traders monitoring indicators in real-time and executing manual exits when their chosen signals appear.
🔹 Psychological Aspects of Stop Loss Management
The psychological impact of Stop Loss execution presents a significant challenge for many traders. Even when a Stop Loss performs its intended function of limiting potential losses, traders may experience:
• Feelings of personal failure
• Diminished confidence in their trading system
• General market skepticism
• Emotional distress after multiple consecutive stops
🔹 Avoiding Mental Stop Losses
While some traders prefer "mental" stops over actual platform orders, this approach carries significant risks:
• Technical failures could prevent manual exits
• Emotional barriers might delay necessary exits
• Small losses can balloon into significant account drawdowns
To protect against these risks, traders should always implement their mental stops as actual platform orders, ensuring systematic risk management regardless of market conditions or psychological pressures.
This structured approach to Stop Loss placement combines technical precision with psychological awareness, helping traders develop both the skills and mindset needed for successful risk management.
🔹 Additional Position Management Methods
In trading, while Stop Loss and Take Profit orders form the foundation of exit strategies, several sophisticated techniques can help traders optimize their position management. Let's explore these methods that go beyond basic exit orders.
⚫️ Breakeven Stop Adjustment
One of the most psychologically powerful position management techniques involves moving your Stop Loss to the trade entry point, effectively eliminating downside risk while maintaining upside potential. This strategy becomes particularly valuable when price movement has demonstrated strong momentum in your favor.
The conventional approach suggests adjusting to breakeven when the price has moved in your favor by double the initial Stop Loss distance. For instance, consider a trade with a 20-pip Stop Loss and a 60-pip Take Profit target. When the position shows 40 pips of profit (twice the initial risk), moving the Stop Loss to the entry point ensures you won't lose money on the trade while still allowing for further gains.
⚫️ Dynamic Risk Management with Trailing Stops
Trailing Stops represent an evolution in risk management, allowing traders to protect accumulated profits while maintaining exposure to continued favorable price movement. This technique dynamically adjusts your Stop Loss level as the price moves in your favor, essentially "trailing" behind the price at a predetermined distance.
⚫️ Strategic Partial Position Closure
Traders often face a dilemma when price approaches their Take Profit level: should they close the entire position or attempt to capture additional gains? The partial closure strategy offers a balanced solution. When market conditions suggest potential for extended movement beyond your initial target, consider closing a portion of your position (typically 70-80%) at the original Take Profit level while allowing the remainder to pursue more ambitious targets.
This approach becomes particularly relevant when trading near significant technical levels. For example, if you're holding a long position with a Take Profit set below a major resistance level, and technical indicators suggest this level might break, closing most of your position secures profits while maintaining exposure to potential breakout gains.
📍 Conclusion
While numerous exit strategies exist in trading, successful execution requires more than just mechanical application of techniques. True trading mastery emerges from the ability to recognize market context, understand both technical and fundamental factors, maintain emotional equilibrium, and make flexible decisions within established risk parameters.
The journey of becoming a skilled trader involves developing judgment about when to apply different exit strategies. This wisdom comes through experience in the markets, careful observation of price action, and a deep understanding of how different approaches work in varying market conditions. Traders gradually build their expertise by starting with fundamental concepts and progressively incorporating more sophisticated position management techniques into their trading approach.
Traders, If you liked this educational post🎓, give it a boost 🚀 and drop a comment 📣

The Psychology Of Markets: A Deep Dive Into Sentiment IndicatorsMarket dynamics are mainly driven by the interaction between available assets and market demand. These forces are shaped by both retail participants and professional market makers. Public sentiment reacts strongly to media coverage and market news. When negative speculation (FUD) spreads, it tends to cause selling pressure, while positive news stimulates buying activity. This can be seen now for example in the world of crypto markets when prices react sharply to world events. And while mathematical indicators track price patterns, there are specific metrics that measure collective market psychology. Let's take a look at the key indicators that measure crowd behavior.
📍 Key Market Psychology Metrics
1. Volatility Assessment (VIX)
The Volatility Index, commonly referred to as TVC:VIX or the market's "pulse of fear," quantifies market turbulence expectations. Developed at CBOE, this tool projects anticipated market fluctuations for a 30-day window by analyzing S&P 500 options data.
📍 VIX Calculation Method:
◾️ Evaluates SP:SPX derivative contracts expiring within 30 days
◾️ Implements sophisticated mathematical modeling, including weighted calculations and interpolative methods
◾️ Synthesizes individual volatility projections into a comprehensive market volatility forecast
📍 Practical Applications
VIX serves as a psychological barometer where:
Readings below 15 indicate market stability
15-25 suggests mild uncertainty
25-30 reflects growing market anxiety
Readings above 30 signal significant turbulence potential
The index also functions as a risk management instrument, enabling portfolio protection strategies through VIX-based derivatives.
2. Market Sentiment Gauge
CNN's proprietary sentiment measurement combines seven distinct market variables to assess whether fear or optimism dominates trading activity. This metric operates on the principle that extreme fear can trigger unnecessary sell-offs, while excessive optimism might inflate valuations unsustainably.
📍 Core Components:
◾️ Price Momentum . Compares current market prices to recent average prices. Helps understand if stocks are trending up or down
◾️ New High/Low Stock Ratios. Measures how many stocks are hitting their highest/lowest points. Indicates overall market health and investor confidence
◾️ Market-Wide Directional Trends. Tracks which stocks are rising or falling. Shows general market movement and investor sentiment
◾️ Options Trading Patterns. Analyzes buying and selling of market protection options. Reveals how investors are preparing for potential market changes
◾️ Market Volatility Metrics. Measures market price fluctuations. Higher volatility suggests more investor uncertainty
◾️ High-Yield Bond Spread Analysis . Compares returns on risky versus safe bonds. Indicates investors' willingness to take financial risks
◾️ Comparative Yield Assessment . Compares returns from stocks versus government bonds. Helps understand where investors prefer to put their money
The measurement spans 0-100:
0-24: Pervasive fear
25-49: Cautious sentiment
50-74: Optimistic outlook
75-100: Excessive optimism
3. Individual Investor Sentiment Analysis (AAII Survey)
The American Association of Individual Investors conducts systematic polling to capture retail market participants' outlook. This weekly assessment provides insights into non-institutional investors' expectations for market direction over a six-month horizon. The methodology offers valuable perspective on collective retail sentiment trends.
Survey Structure : Participants respond to a focused query about market trajectory, selecting from three possible scenarios:
Optimistic outlook (Bullish) - anticipating market appreciation
Pessimistic view (Bearish) - expecting market decline
Neutral stance - projecting sideways movement
📍 Practical Applications
◾️ Contrarian Signal. Extreme readings often suggest potential market reversals. For instance, widespread pessimism might indicate oversold conditions, while excessive optimism could signal overbought markets.
◾️ Sentiment Tracking. The data helps contextualize retail investor psychology within current market conditions.
◾️ Historical Pattern Analysis. Current sentiment readings gain additional meaning when compared against historical trends.
Note: While informative, this metric specifically reflects retail sentiment and should be considered alongside institutional positioning and broader market indicators.
4. Market Participation Breadth
Market breadth analysis examines the distribution of price movements across securities to evaluate market health beyond headline index levels. This methodology assesses whether market moves reflect broad participation or concentrated activity in specific securities.
📍 Key Breadth Metrics
◾️ Advancing vs. Declining Issues . Tracks the numerical comparison between appreciating and depreciating securities
◾️ Net Advance-Decline . Calculates the cumulative difference between rising and falling stocks to identify underlying momentum
◾️ Participation Ratio . Establishes the proportion of advancing to declining securities
◾️ Moving Average Analysis . Monitors the percentage of stocks trading above key technical levels (20-day, 50-day, and 200-day moving averages)
📍 Practical Applications
◾️ Trend Validation. Strong market breadth confirms price trends, while deteriorating breadth may signal potential reversals
◾️ Early Warning System . Divergences between price action and breadth often precede significant market shifts
◾️ Trend Strength Assessment. Broad participation in market moves typically indicates more sustainable trends
This analytical framework provides deeper insight into market dynamics beyond surface-level price movements, helping investors and traders better understand the underlying strength or weakness of current market conditions.
Traders, If you liked this educational post🎓, give it a boost 🚀 and drop a comment 📣

Traders MindsetLet’s talk about mindset! You hear everyone saying; mindset is the most important in trading. But what is having “the right mindset” ?
Now here is a little secret. Mindset is not just being focused on the money. “I must be profitable”. No. Having the right mindset is having a set of attitudes. Quite literally the definition..
Mindset /ˈmʌɪn(d)sɛt/
noun (usually in singular) the established set of attitudes held by someone.
How you approach the market is very important.
Have a set of rules for yourself.
- Do I have a trading plan? Having a trading plan is important. It helps you follow something day in and day out.
- Do I have good market conditions? Having good market conditions is important as it helps you make more clear decisions. Trading in sideways markets usually ends badly. It forces the trader to become impatient and entering too soon, expecting a breakout to either side usually leads to loses.
- Do I know the risk? Understanding the risk before you enter the trade is important. Majority of traders over-leverage, meaning they use high leverage thus being able to open higher lot size positions. That usually leads to blown accounts. Knowing what you are risking, eliminates a lot of the emotions.
- Do I have any confirmations? Whether that’s a break, a pullback, fundamentals supporting your view that’s great! Having confirmations on your analysis or trade is important.
- Is this trade forced? Am I being nervous before entering? Am I not sure? Am I gambling on this trade? Understanding your emotions is important. Ever felt like this when you opened a trade, knowing you shouldn’t and it instantly went against you? Avoid these trades.
One more thing I would like to add. Ever been stuck to your screen 24/7? Lost sleep over a trade. Here is a fact. You watching the chart, won’t change its path. Sad truth. There is nothing wrong with following your trade, but if you are watching your losing trade, then I already know where it leads. You do too. Avoid this. Going back to the #1 rule. Know your risk before entering. Eliminate emotions.
Having the right mindset is following your own rules and having a set of habits. Habits that help you to grow as a trader. Eliminate bad habits. Review your past trades. You all know why you lost a trade. But will you look for an excuse? “Ah the market did a liquidity sweep” or “market is manipulated”. The market is never wrong. You as a trader are.
Don’t celebrate wins or mourn loses on your account. Treat it as your full time job. You have some good days, you have some bad days. You win, you move on. You lose, you move on. As long as you are following the trading plan, you will succeed.
Understanding this, combined with experience will grow you as a trader. And guess what the by product of this is? Money.
So don’t focus on money. Focus on self-growth, mindset, experience and upgrading your skillset of trading. Money will be the byproduct of your journey.
Create your mindset plan. A set of rules for yourself. Try doing it for 30 days. Come back to this post and tell us if you have improved.
Nothing or no one is stopping you from being a successful trader but yourself. It’s not the market and no it’s not the broker.
Majority of traders quit after blowing a few accounts. The rest stick around for years but make no progress. Only a few % of them actually find the meaning behind it and succeed.
What’s the secret? Signals? Prop Firms? Account managers? EA’s? No. Sure all these things can benefit you slightly. But what truly is the secret to being successful in trading?
You! You are the secret. Understanding yourself, your emotions, your reactions to certain events. Trading is a mirror of you. An amplified picture of you. Are you impatient? Scared? Nervous? Greedy? Forex will amplify those emotions.
The biggest battle you have to win is the battle with yourself. Not the market.
Trading is easy, you have a trading plan, you stick to it. Sometimes you may have a loosing week, happens right? But as long as you are sticking to your strategy, understanding the market, using a positive R:R and understanding the importance of consistency you should be fine. But here is the hard part. Your reactions. Your emotions.
Let’s take for example NFP Data release. Weeks or even months of progress can be wiped out due to irrational decisions during news. Don’t be that trader. Suppress your emotions, don’t get greedy. Take a jab at the market, but only after the data is out.
Remember, no one is stopping you from being a successful trader, but yourself.
A key element added to a traders mindset is PATIENCE .
patience /ˈpeɪʃns/
(noun) - the capacity to accept or tolerate delay, problems, or suffering without becoming annoyed or anxious.
That’s the definition of patience. Trading is a stressful field. Not only does your analysis have to be on point, you have to be focused, have a trading plan, use proper risk to reward ratio… so many factors and then comes the patience. We already know that the market always provides unexpected problems. It plays with our emotions, ranges, does not move, goes against us etc.
How many times have you entered in a position and the price started to range, while you float in loss? You start doubting, you get scared and you close the position. Or even worse, you get stopped out. Later in the day you check the chart and you see your Take Profit (TP) would have been hit, but only if you were more patient?
Or how many times have you had an A+ setup, everything was going to plan but you closed it early because you wanted to secure the profit?
Being a good trader is hard, but it’s not impossible. Discipline is everything as well as patience. Without patience you are bound to lose.
From talking to many people, you would be surprised at how many of them want to “flip” their account. “Do you think I can make 2000$ this week” with 1000$ in their account.
We will always advocate for patience. Playing the long game. Consistency + patience will get you far.
Check some of the last trades you did. Were you patient? Ask yourself. Majority can find themselves in these stories.
Work on your patience, and you will get far.
For example, check out this long-term analysis on XAUUSD (Gold) posted on January 9th. Now we did close it earlier, but we still managed to secure +500 pips (50$ price action) in 3 days of holding. Patience.
This post was made due to a high request of people liking our minds, so it has all been posted in a single educational post.
FxPocket
