Two Types of Money Are Betting Completely Opposite WaysCurrently, there are two fundamentally different classes of investors who are taking extremely opposing positions within the same stock market. One is cautiously standing on the sidelines with substantial room to act. The other is massively all in, more exposed to stocks than at any point in recent memory. Both are correct within their contexts, but each is answering a fundamentally different question, and being aware of the division tells you something most other market indicators will not.
Algorithmictrading
Eth algorithmic take profitTWS closed a trade at take profit yesterday โ a strong result after nearly two months of mostly sideways performance.
This is a good example of why trend-following strategies require patience: for much of the time, they may wait, filter out noise, or move unevenly, while a significant part of the return often comes from a few distinct directional moves.
How to Mathematically Prove Your Strategy Isn't LuckYou run a backtest on a strategy, and it makes 40% over two years . You get excited and go live with it, only to realize that one question almost no retail trader considers is: how likely is it that such a result happened by chance, and the strategy has no edge at all?
Quant funds answer this question every day using a Monte Carlo simulation , something almost no retail trader has ever heard of. This article describes what this tool is, why it's useful, and how you can run a simple one you
XAUUSD Algo Map: NFP Expansion & Bullish Structural Breakout๐ XAUUSD Algo Map: NFP Expansion & Bullish Structural Breakout
๐ Report ID: XAUUSD-DAILY-UPDATE-2026-08-10
Asset: Gold Spot (XAU/USD)
Timeframe: Daily (Macro) / 15m (Intraday)
๐ Data Anchor: Aug 10, 2026 (Daily Close: Aug 07, 2026)
๐ญ Intraday Outlook: Upcoming Session
๐ญ Market Context & Price Action
Friday's daily price action delivered a massive Bullish Engulfing Expansion bar following high-impact NFP volatility. Institutional buyers defended intraday demand and launched an aggressive ra
XAUUSD Algo Map: Supply Invalidation & Bullish Expansion๐ XAUUSD Algo Map: Supply Invalidation & Bullish Expansion
๐ Report ID: XAUUSD-DAILY-UPDATE-2026-08-07
Asset: Gold Spot (XAU/USD)
Timeframe: Daily (Macro) / 15m (Intraday)
๐ Data Anchor: Aug 07, 2026 (Daily Close: Aug 06, 2026)
๐ญ Intraday Outlook: Upcoming Session
๐ญ Market Context & Price Action
Yesterday's daily price action printed a massive upper rejection candle, with heavy institutional profit-taking driving the price down from the 4304.310 high to close near 4240.750.
Live Market Up
XAUUSD Algo Map: Bullish Continuation & Structural Breakout๐ XAUUSD Algo Map: Bullish Continuation & Structural Breakout
๐ Report ID: XAUUSD-DAILY-UPDATE-2026-08-05
Asset: Gold Spot (XAU/USD)
Timeframe: Daily (Macro) / 15m (Intraday)
๐ Data Anchor: Aug 06, 2026 (Daily Close: Aug 05, 2026)
๐ญ Intraday Outlook: Upcoming Session
๐ญ Market Context & Price Action
The daily price action printed an exceptionally powerful bullish expansion candle. After opening at 4078.390 and establishing an initial physical low at 4065.330, massive institutional demand st
XAUUSD Algo Map: Extreme Bullish Deviation & Structural Expansio๐ XAUUSD Algo Map: Extreme Bullish Deviation & Structural Expansion
๐ Report ID: XAUUSD-DAILY-UPDATE-2026-08-04
Asset: Gold Spot (XAU/USD)
Timeframe: Daily (Macro) / 15m (Intraday)
๐ Data Anchor: Aug 05, 2026 (Daily Close: Aug 04, 2026)
๐ญ Intraday Outlook: Upcoming Session
๐ญ Market Context & Price Action
The daily price action printed a powerful bullish wide-range candle. After opening at 4052.120 and dipping briefly to a physical low of 4042.720, massive institutional demand stepped in, d
XAUUSD Algo Map: Lower Tail Rejection & Neutral-Bullish Shift๐ XAUUSD Algo Map: Lower Tail Rejection & Neutral-Bullish Shift
๐ Report ID: XAUUSD-DAILY-UPDATE-2026-08-03
Asset: Gold Spot (XAU/USD)
Timeframe: Daily (Macro) / 15m (Intraday)
๐ Data Anchor: Aug 04, 2026 (Daily Close: Aug 03, 2026)
๐ญ Intraday Outlook: Upcoming Session
๐ญ Market Context & Price Action
The daily price action printed a candle with a prominent lower tail rejection. After opening at 4075.055 and establishing an initial high at 4079.185, the market faced selling pressure that dr
XAUUSD Algo Map Execution: Dual Core Precision & 4R Expansion๐ฏ XAUUSD Algo Map Execution: Dual Core Precision & 4R Expansion
๐ Report ID: XAUUSD-DAILY-EXECUTION-2026-08-04
๐ Reference Plan: XAUUSD-DAILY-UPDATE-2026-07-31
Asset: Gold Spot (XAU/USD)
Timeframe: 15m (Intraday Execution)
๐ญ Execution Summary & Market Delivery
The Daily Decision Core (4053.510 โ 4066.493) outlined in yesterdayโs map served as the ultimate institutional magnet and rotational axis for the entire intraday session. Price action respected both boundaries of this mathematical cor
XAUUSD Algo Map: Bearish Correction & Neutral Consolidation๐ XAUUSD Algo Map: Bearish Correction & Neutral Consolidation
๐ Report ID: XAUUSD-DAILY-UPDATE-2026-07-31
Asset: Gold Spot (XAU/USD)
Timeframe: Daily (Macro) / 15m (Intraday)
๐ Data Anchor: Aug 03, 2026 (Daily Close: July 31, 2026)
๐ญ Intraday Outlook: Upcoming Session
๐ญ Market Context & Price Action
The daily price action printed a bearish corrective candle with lower tail rejection. After opening at 4103.360 and establishing a physical high at 4112.010, the market faced immediate selling
XAUUSD Macro Algo Map: High Volatility Equilibrium & Consolidati๐ XAUUSD Macro Algo Map: High Volatility Equilibrium & Consolidation
๐ Report ID: XAUUSD-WEEKLY-UPDATE-2026-W31
Asset: Gold Spot (XAU/USD)
Timeframe: Weekly (Macro) / Daily (Swing)
๐ Data Anchor: Week of July 27, 2026
๐ญ Macro Outlook: Upcoming Week
๐ญ Market Context & Price Action
The macro price action printed a high-volatility indecision candle (Doji / Spinning Top), indicating a severe equilibrium and fierce confrontation between buyers and sellers.
After opening at 4090.160, the market
XAUUSD Macro Algo Map: Bullish Rejection & Monthly Consolidation๐ XAUUSD Macro Algo Map: Bullish Rejection & Monthly Consolidation Phase
๐ Report ID: XAUUSD-MONTHLY-UPDATE-2026-M07
Asset: Gold Spot (XAU/USD)
Timeframe: Monthly (Macro) / Weekly (Swing)
๐ Data Anchor: Month of July 2026
๐ญ Macro Outlook: August 2026
๐ญ Market Context & Price Action
The macro price action printed a bullish monthly candle with a prominent upper rejection shadow (Bullish Pinbar). After opening at 4014.340 and establishing a physical low at 3959.800, a massive injection of buy
XAUUSD Algo Map: Bullish Momentum Maintenance & Core Defense๐ XAUUSD Algo Map: Bullish Momentum Maintenance & Core Defense
๐ Report ID: XAUUSD-DAILY-2026-07-31
Asset: Gold Spot (XAU/USD)
Timeframe: Daily (Macro) / 15m (Intraday)
๐ Data Anchor: July 31, 2026 (Daily Close: July 30, 2026)
๐ญ Market Context & Price Action
Heading into the final trading session of the week, the daily price action for Gold (XAUUSD) carries the powerful bullish momentum generated during yesterday's New York session. After sweeping liquidity at the 4028.690 base and absorbing in
XAUUSD Execution Review: Surgical Precision & Blueprint Realizat๐ XAUUSD Execution Review: Surgical Precision & Blueprint Realization
๐ Report ID: XAUUSD-REVIEW-2026-07-31
Asset: Gold Spot (XAU/USD)
Timeframe: 15m (Intraday Execution)
๐ญ Market Recap & Algorithmic Accuracy
The market delivered exactly what the architecture demanded. Yesterday's algorithmic map perfectly anticipated the pre-data volatility and bidirectional liquidity sweeps. By trusting the mathematical boundaries over emotional price action, we executed a flawless structural play.
As projec
XAUUSD Algo Map: Pre-Data Compression & Equilibrium Defense๐ XAUUSD Algo Map: Pre-Data Compression & Equilibrium Defense
๐ Report ID: XAUUSD-DAILY-2026-07-30
Asset: Gold Spot (XAU/USD)
Timeframe: Daily (Macro) / 15m (Intraday)
๐ Data Anchor: July 30, 2026 (Daily Close: July 29, 2026)
๐ญ Market Context & Price Action
The daily price action for Gold (XAUUSD) has printed a decisive institutional V-Shape Rebound, confirming massive demand absorption. After engineering a deep liquidity sweep below the psychological $4000 barrier to print a session low of 399
XAUUSD Trade Execution: Demand Defense & Post-FOMC Bullish Expan๐ XAUUSD Trade Execution: Demand Defense & Post-FOMC Bullish Expansion
๐ Report ID: XAUUSD-RESULT-2026-07-29
Asset: Gold Spot (XAU/USD)
Timeframe: 15m (Intraday Execution)
Reference: XAUUSD-DAILY-2026-07-29
๐ฏ Trade Execution & Setup Recap
As outlined in today's structural map, the Daily Immediate Demand Base (3990 - 4011) served as the primary line of defense for buyers. Following a swift liquidity sweep below the session low, price action delivered a strong bullish rejection within the demand
XAUUSD Algo Map: Pre-FOMC Compression & Bearish Expansion๐ XAUUSD Algo Map: Pre-FOMC Compression & Bearish Expansion
๐ Report ID: XAUUSD-DAILY-2026-07-29
Asset: Gold Spot (XAU/USD)
Timeframe: Daily (Macro) / 15m (Intraday)
๐ Data Anchor: July 29, 2026 (Daily Close: July 28, 2026)
๐ญ Market Context & Price Action
The daily price action for Gold (XAUUSD) has printed a decisive wide-range bearish expansion body (Bearish Marubozu), confirming heavy institutional supply. Sellers drove price action aggressively from the open at 4080.685 down to a session lo
XAUUSD Algo Map: Lower Liquidity Sweep & Core Decision Hold๐ XAUUSD Algo Map: Lower Liquidity Sweep & Core Decision Hold
๐ Report ID: XAUUSD-DAILY-2026-07-27
Asset: Gold Spot (XAU/USD)
Timeframe: Daily (Macro) / 15m (Intraday)
๐ Data Anchor: July 27, 2026 (Daily Close: July 26, 2026)
๐ญ Market Context & Price Action
The daily price action for Gold (XAUUSD) completed a bullish rejection structure marked by an early liquidity sweep at lower levels. Opening at 4048.875, price initially dipped to test liquidity at the 4022.060 session low, where immediate b
XAUUSD Macro Algo Map: Bullish Rejection & Weekly Consolidation๐ XAUUSD Macro Algo Map: Bullish Rejection & Weekly Consolidation
๐ Report ID: XAUUSD-WEEKLY-UPDATE-2026-W30
Asset: Gold Spot (XAU/USD)
Timeframe: Weekly (Macro) / Daily (Swing)
๐ Data Anchor: Week of July 20, 2026
๐ญ Macro Outlook: Week of July 27, 2026
๐ญ Market Context & Price Action
The macro price action printed a bullish weekly candle with a prominent upper rejection shadow. After opening at 3995.570 and establishing a physical low at 3982.630, a massive injection of buy-side volume drove t
XAUUSD Trade Execution: Precision Snipe & Structural Reversal๐ XAUUSD Trade Execution: Precision Snipe & Structural Reversal
๐ Report ID: XAUUSD-RESULT-2026-07-24
Asset: Gold Spot (XAU/USD)
Timeframe: 15m (Intraday Execution)
Reference: XAUUSD-DAILY-2026-07-24
๐ฏ Trade Execution & Setup Recap
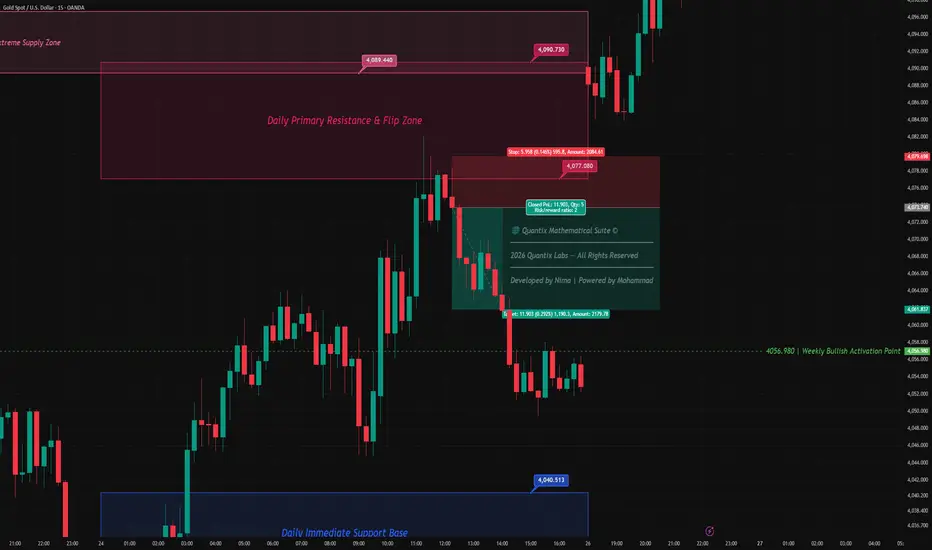
The live market session perfectly validated the primary "Sell on Rally" scenario outlined in our previous structural map. As price action pulled back into the specified pivot region just below the central core, a high-probability Short position was triggered.
Direct
XAUUSD Algo Map: Bearish Expansion & Decision Core Breakdown๐ XAUUSD Algo Map: Bearish Expansion & Decision Core Breakdown
๐ Report ID: XAUUSD-DAILY-2026-07-24
Asset: Gold Spot (XAU/USD)
Timeframe: Daily (Macro) / 15m (Intraday)
๐ Data Anchor: July 24, 2026 (Daily Close: July 23, 2026)
๐ญ Market Context & Price Action
The daily structure for Gold (XAUUSD) has shifted into a dominant bearish expansion phase (Bearish Engulfing Body). Following a brief opening push to a high of 4141.275, institutional supply aggressively flooded the market, driving a massiv
XAUUSD: Two-Way Volatility Setup - Systematic Hedging ViewXAUUSD: Two-Way Volatility Setup - Systematic Hedging View
XAUUSD is currently trading within an important decision zone between and . Rather than predicting a single direction, I am monitoring both breakout scenarios. Gold often produces sharp volatility once price leaves a well-defined consolidation range, especially when liquidity builds above recent highs and below recent lows. "Bullish Scenario" A confirmed break and close above would indicate that buyers are regaining control. In th
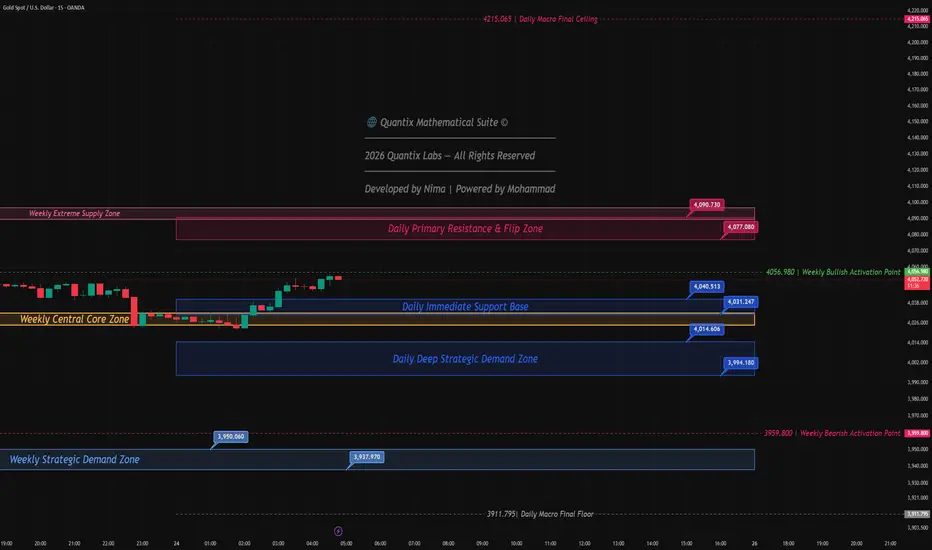
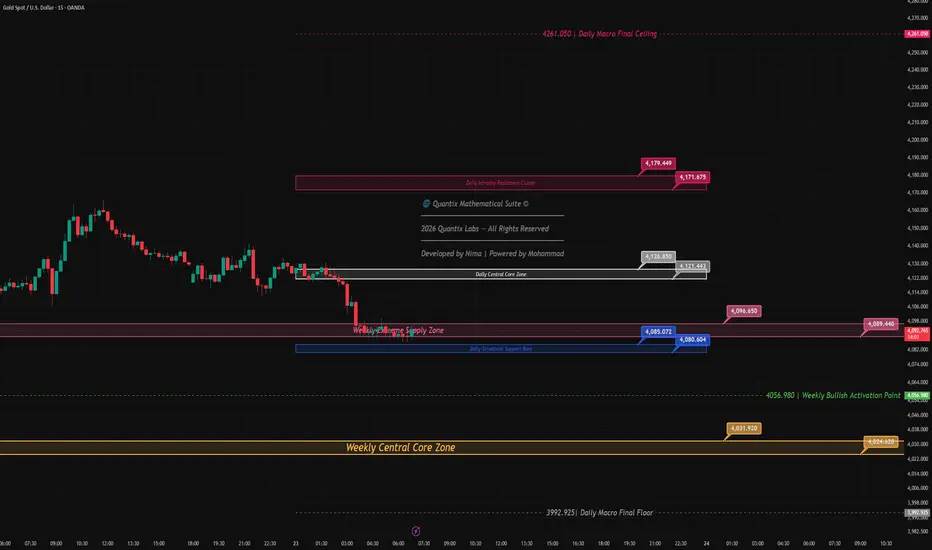
XAUUSD Algo Map: Core Breakdown & Critical Support Test๐ XAUUSD Algo Map: Core Breakdown & Critical Support Test
๐ Report ID: XAUUSD-DAILY-2026-07-23
Asset: Gold Spot (XAU/USD)
Timeframe: Daily (Macro) / 15m (Intraday Live)
๐ Data Anchor: July 23, 2026
๐ญ Market Context & Price Action
Despite the macro daily structure printing a strong bullish close at 4129.760, the intraday order flow has experienced a violent shift. As observed on the live 15m session, institutional sellers hijacked the momentum, forcing a sharp structural breakdown below the equi
XAUUSD Algo Map: Bullish Breakout & Macro Trajectory๐ XAUUSD Algo Map: Bullish Breakout & Macro Trajectory
๐ Report ID: XAUUSD-DAILY-2026-07-22
Asset: Gold Spot (XAU/USD)
Timeframe: Daily (Macro) / 15m (Intraday)
๐ Data Anchor: July 22, 2026
๐ญ Market Context & Price Action
The daily structure for Gold (XAUUSD) has shifted into an aggressive bullish markup phase. Driven by a massive injection of buy-side volume, the market completely shattered the previous structural highs. The price successfully cleared the critical 4087.135 - 4101.311 consolida