Amazon Can Stabilze Near $210Amazon has been pulling back lately, and I’ve been tracking this as a potential wave four flat correction, with wave A and wave B already completed and wave C now eyeing the support around 210. That zone also lines up with the 0.382 Fibonacci retracement and previous breakout levels, so it could attract buyers and provide stabilization. The retracement is quite deep at around 12 percent, but since the stock has not yet retested February highs, it looks more like a consolidation, a pause rather than a new bearish trend. I assume there is a chance for a nice bounce into wave five, still this year.
GH
Amazon

AMAZON FREE SIGNAL|SHORT|
✅AMZN Price rejects supply area with ICT displacement, showing bearish order flow. Liquidity below 217$ becomes the likely draw as inefficiency invites continuation.
—————————
Entry: 220.10$
Stop Loss: 222.00$
Take Profit: 217.00$
Time Frame: 2H
—————————
SHORT🔥
✅Like and subscribe to never miss a new idea!✅

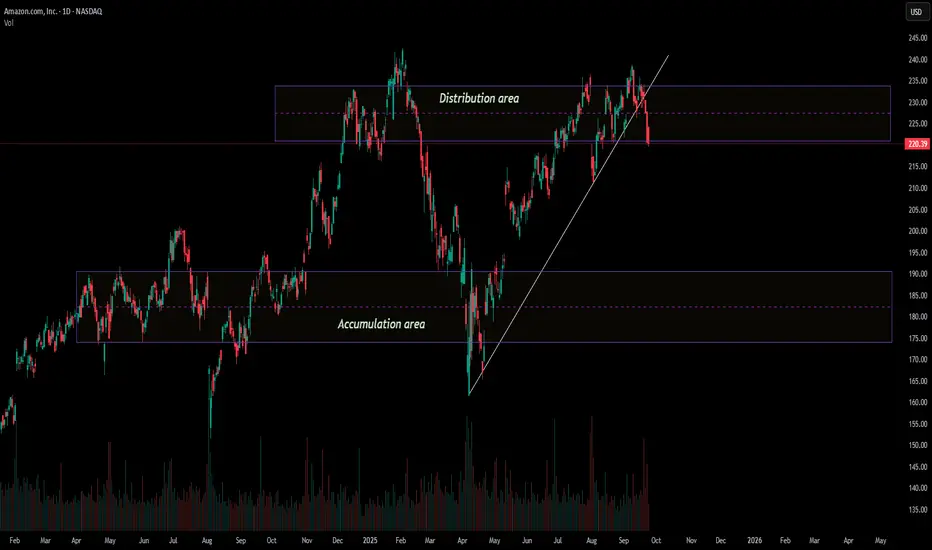
Amazon analysisRight now, I believe price is trading inside the distribution area that I’ve highlighted.
The recent break of the trendline suggests momentum may be shifting, with the risk of a reversal into a downtrend.
From an investor’s perspective, this is not the most attractive area to be buying. A more favorable entry could come if price moves back down into the accumulation area I’ve marked on the chart.
🎯 Conclusion: My view is cautious — I think AMZN may leave the distribution phase and head lower toward the accumulation area. As an investor, patience here may prove wiser than chasing current levels.
Amazon (AMZN) shares fall around 3% in a single dayAmazon (AMZN) shares fall around 3% in a single day
As the chart shows, Amazon (AMZN) shares fell by roughly 3% yesterday after reports that the US Federal Trade Commission has launched a probe into the company over alleged “dark patterns”.
According to the allegations, Amazon may have deliberately complicated the process of cancelling Prime subscriptions in order to retain customers. Should the charges be proven, this could result in significant fines and have a major impact on one of Amazon’s key revenue streams.
Amazon’s share price dipped below $220 yesterday for the first time since 12 August. Could the decline continue?
Technical analysis of Amazon (AMZN) chart
In our 5 September analysis, we:
→ used AMZN stock price swings to plot an ascending channel (shown in blue);
→ suggested the price could extend its bullish structure after breaking through resistance R (shown in red).
Indeed, in the following days there was some bullish momentum: peak B was higher than peak A. However, this appears more a sign of weakness when judged by the nature of the reversal:
→ on 10 September, the price edged only slightly above the summer peak,
→ before tumbling sharply, with bearish candles widening.
This move, showing clear signs of a Double Top pattern (A–B), may suggest that buyers at September’s high were trapped, with stop-loss closures adding to the downward pressure.
The previously plotted ascending channel remains valid, but Amazon stock price has dropped (shown by the red arrow) into its lower half. In this context, the channel’s midline and the $227.70 level could now act as resistance.
Bulls, however, still have grounds to expect support from:
→ the bullish reversal zone formed in early August, when a narrowing triangle appeared on the chart with its axis around $215;
→ the QL line, which divides the lower half of the channel into quarters.
Although the negative sentiment from FTC-related news may eventually fade, what remains concerning is AMZN’s relatively weaker performance in 2025 compared with the broader market: while the S&P 500 set a fresh all-time high this week, Amazon shares have barely moved since the start of the year.
This article represents the opinion of the Companies operating under the FXOpen brand only. It is not to be construed as an offer, solicitation, or recommendation with respect to products and services provided by the Companies operating under the FXOpen brand, nor is it to be considered financial advice.

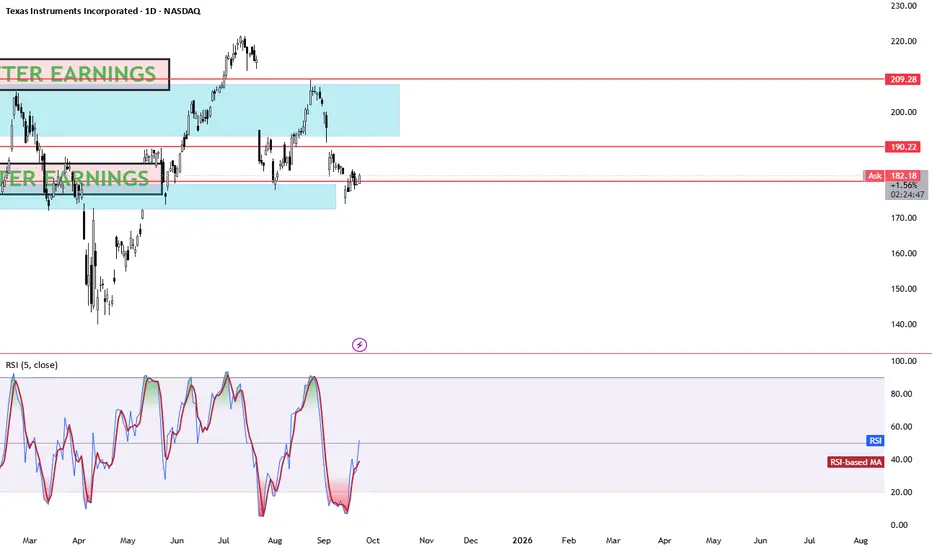
TEXAS INSTRUMENTS BACK TO 200 Why Texas Instruments (TXN) Could Rebound to $200 by 2026: Semiconductor Revival TXN's trading at ~$182 today (Sep 23, 2025), down ~20% from its $230 peak amid industrial softness and China tariffs, but with EPS surging 20%+ and analog demand roaring back, $200 (10% upside) is a slam-dunk floor by EOY 2026. Here's the bull reload:Revenue Ramp & Analog Dominance: Q2 '25 revenue +16% YoY to $4.4B, with industrial up 9% sequentially. Analysts eye $17.5B in '26 (9% YoY growth from $16B '25), fueled by 300mm wafer ramps and auto/enterprise recovery—hitting 50%+ gross margins for $200 valuation at 25x sales.
3 sources
EPS Explosion: Consensus EPS jumps to $6.44 in '26 (20% from $5.35 '25), undervalued at 28x forward P/E vs. 35x historical avg. At norm multiple, that's $226—clearing $200 easy, per WallStreetZen's $208.67 base case.
2 sources
CapEx Efficiency & Cash Flow Surge: $5B '25 spend drops to $2-5B '26 on optimized 1.2x capex/revenue, unlocking $8-12B free cash flow. Dividend hiked 4% to $1.42/share, with buybacks hedging volatility—StockScan's $248 avg '26 seals the rebound.
3 sources
Analyst Consensus Over $200: 25-51 firms avg $212-218 PT (Buy rating, high $298), with TipRanks at $212.83 on AI/data center tailwinds (13% earnings CAGR). Lows $125, but bulls dominate post-Q3 guidance.
VISA BACK TO 370 BY 2026 Why Visa (V) Could Hit $370 by 2026: Payments Powerhouse Bull Case Visa’s trading at ~$344 today (Sep 23, 2025), up 15% YTD on digital payments surge, but with EPS climbing 12%+ and global transaction volumes booming, $370 (8% upside) by EOY 2026 is a low-bar target for this steady climber. Here’s the roadmap:Revenue & Payments Growth: Q3 '25 cross-border volume +16% YoY, driving $39B TTM revenue (11% growth). Analysts project 9.4% YoY to $43B+ in FY26 on e-comm (25% of sales) and emerging markets expansion, per Simply Wall St—fueling $370 at 25x forward sales.
2 sources
EPS Acceleration: Consensus EPS hits $10.50 in FY26 (up 12% from $9.37 '25), trading at 28x forward P/E—below historical 32x avg. At norm multiple, that's $336 base; add 11.2% earnings growth for $370 pop, aligning with LiteFinance's $370–$380 range.
2 sources
Innovation Tailwinds: Visa Direct + fintech ties (e.g., Ample Earth climate collab) boost B2B volumes 20%+, hedging crypto/reg risks. Tokenization and AI fraud tech scale margins to 67%+, per management.
Analyst Consensus Backs It: 27–51 firms avg $380–$396 PT (Strong Buy, high $430), with StockScan eyeing $351 avg '26 (high $390). Lows at $305, but bulls dominate on 10%+ CAGR.

TSSI BACK TO 28 BY 2026 Why TSS, Inc. (TSSI) Could Rocket Back to $28 by 2026: AI-Driven Bull Case TSSI’s trading at $18.38 today (Sep 23, 2025, per the finance card above), down from its $31.94 year-high, but with explosive AI infrastructure demand and a Dell partnership, $28 (52% upside) by EOY 2026 is in sight. Here’s the catalyst-fueled case:AI Boom & Dell Contract: Q2 '25 revenue soared 520% YoY to $62.8M, driven by a multi-year Dell deal for AI server racks. Procurement segment (80%+ revenue) eyes $200M+ in '26, with Georgetown facility scaling output. Analysts project 50% YoY growth to $220M+, pushing EPS to $0.15–$0.20.
Analyst Upgrades & Targets: Roth MKM and Singular rate "Buy" (Sep '25), with consensus PT $16.50–$22 (20–60% upside). Walletinvestor forecasts $20.40 by Jun '26, but Reddit bulls and Intellectia eye $30–$81 on 2x sales valuation, hitting $28 easily.
Technical Breakout: The finance card above shows TSSI above its 200-day MA ($13–$14 range), with RSI (35.28) neutral, poised for a momentum flip. Weekly MACD signals bullish crossover, and $18 support holds firm. Break above $20 resistance targets $28, per TradingView’s setup.
Market Tailwinds: $1T AI/data center market by 2030 fuels TSSI’s niche in systems integration. $20M debt financing (Jul '25) funds capacity, with NASDAQ uplisting boosting liquidity. Volatility (13.35%, beta 4.28) risks dips, but $150M shelf offering signals growth bets.

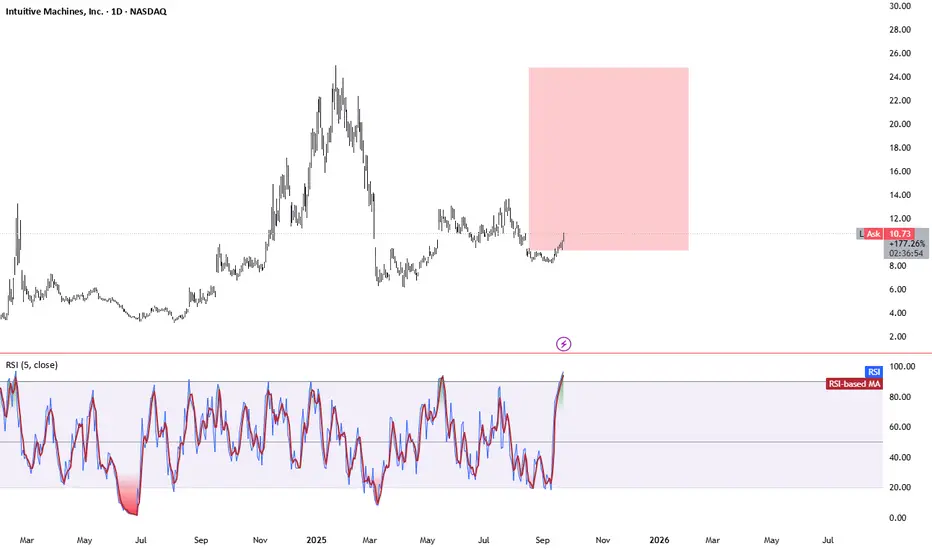
Intuitive Machines (LUNR) BACK TO 20 DOLLARS Why Intuitive Machines (LUNR) Could Rocket Back to $20 by 2026: Lunar Bull Case LUNR's trading at ~$9.71 today (Sep 23, 2025), down from its $24.95 peak amid mission hiccups, but with NASA contracts stacking and revenue exploding, $20 (106% upside) is in orbit by EOY 2026. Here's the launch sequence:NASA Contract Avalanche: Fresh $2.5M NextSTEP award (Jan '25) for lunar logistics, plus $4.82B Near Space Network (NSN) for comms/nav through 2029 (extendable to 2034). IM-3 mission in '26 delivers South Pole payloads ($116.9M CLPS), scaling DTE services to $200M+ annually.
5 sources
LTV award mid-'25 adds mobility revenue, hedging risks.
Revenue Hypergrowth: From $217M in '25 to $700M+ in '26 (222% YoY) on dual missions, relay sats, and NSN backlog. EPS flips to $0.03 avg (from -$0.22), trading at 20x forward P/E—undervalued vs. space peers at 30x.
2 sources
Analyst Moonshot Targets: Consensus $15.44 short-term (6 firms, Moderate Buy), but bulls like Canaccord ($26, up from $17.50) and Intellectia ($24.94 Dec '26) eye $20+ on Artemis tailwinds. Highs to $31.88 clear it easy.
5 sources
Artemis & Market Boom: $1T space economy by 2040; LUNR's Nova-C landers + Khon sats position it for 20-30% YoY growth, per Reddit bulls modeling $500M+ revenue at 20x P/S = $100 PT (conservative slice: $20).
CHIPOTLE BACK TO 50 !Why Chipotle (CMG) Could Climb to $50 by 2026: Tasty Bull Case Chipotle’s trading at ~$43 today (Sep 23, 2025), down slightly YTD, but with strong fundamentals and operational wins, $50 (16% upside) by EOY 2026 is achievable long-term. Here’s the recipe:Revenue & Same-Store Growth: Q2 '25 comps +11.1% and $3.8B revenue (15% YoY) signal robust demand. Analysts project 13% YoY growth to $12.5B in '26, driven by 300+ new stores and digital orders (30%+ of sales). This supports $1.75 EPS, pushing P/E to 28x for a $50 target.
Operational Efficiency: Chipotlanes (drive-thru) now in 60% of new locations, boosting margins to 28%+. Automation in prep (e.g., Autocado) cuts costs 5%, per management, fueling EPS growth to $2.10 by '26, aligning with $50 at 24x forward P/E.
Analyst Optimism: 27 firms avg $50.24 PT (high $62), with BMO Capital’s $56 Buy rating citing loyalty program strength (35M+ members). CoinPriceForecast sees $53 mid-'26, clearing $50 on 10% comps.
Consumer Resilience: Despite inflation, CMG’s premium positioning (health-focused, customizable menu) retains Gen Z/Millennial traffic, hedging macro risks. LongForecast eyes $54 by Q3 '26.

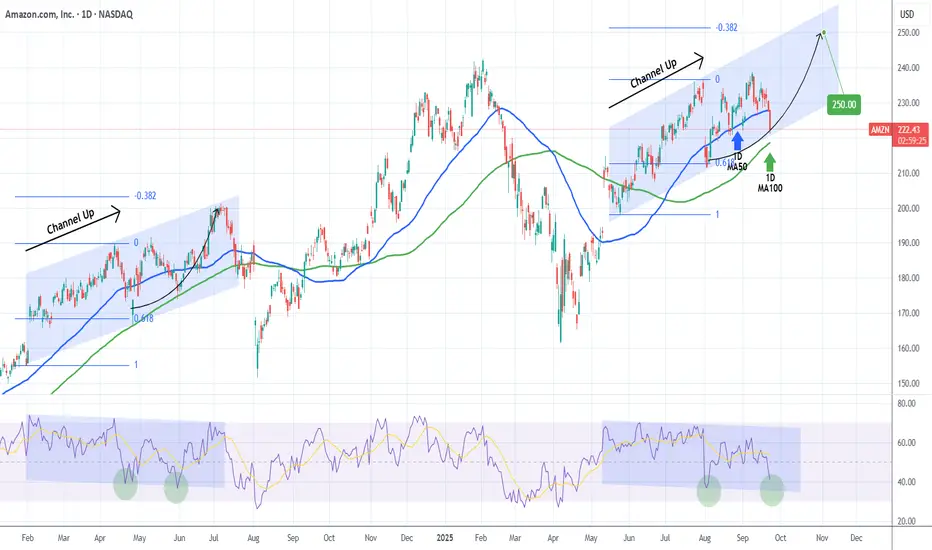
AMAZON Has it found a bottom?Amazon Inc. (AMZN) has been trading within a 4-month Channel Up and is currently pulling back on a Bearish Leg. The 1D MA100 (green trend-line) is just below and last time a similar Channel Up found support on it (May 31 2024), it rebounded for a -0.382 Fibonacci extension top.
As you can see, both patterns are identical, even making their first Higher Lows on their respective 0.618 Fib. Even their 1D RSI fractals are similar and right now we are headed of the 2nd Low (green circle).
As a result, we expect a bullish reversal there, targeting a little under $250 (Fib -0.382 ext).
-------------------------------------------------------------------------------
** Please LIKE 👍, FOLLOW ✅, SHARE 🙌 and COMMENT ✍ if you enjoy this idea! Also share your ideas and charts in the comments section below! This is best way to keep it relevant, support us, keep the content here free and allow the idea to reach as many people as possible. **
-------------------------------------------------------------------------------
💸💸💸💸💸💸
👇 👇 👇 👇 👇 👇
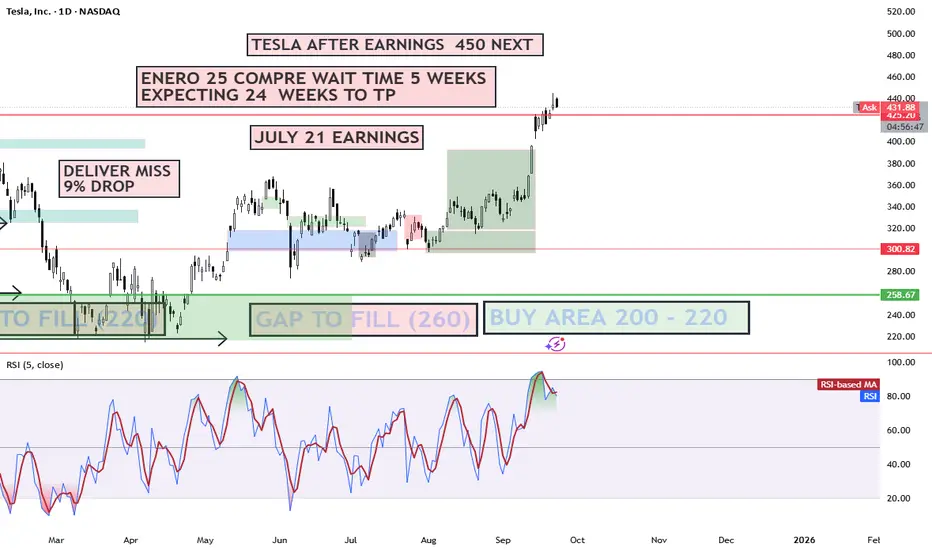
TESLA 500 BY EOY OR 2026 Why Tesla (TSLA) Could Hit $450 Then $500 by EOY 2025 or 2026: Key Catalysts Tesla's hovering around $315 today (as of Sept 23, 2025), down ~20% YTD amid sales dips, but the setup for a rebound to $450 (43% upside) and $500 (59% upside) is primed by execution on autonomy, EVs, and energy. Here's the bull case, blending fundamentals and forecasts:Robotaxi & FSD Rollout Momentum: Tesla's Cybercab unveil in Oct 2025 could catalyze a surge, with unsupervised Full Self-Driving (FSD) v13 hitting highways by year-end. ARK Invest's base case eyes $4,600 by 2026 (driven 60%+ by autonomy), but even conservative models like CoinCodex forecast $453 avg in 2026, with highs to $664 on ride-hailing revenue potentially adding $10T market value.
2 sources
Piper Sandler just hiked their PT, calling TSLA the "top idea" for AV investing.
EV Delivery Rebound & Affordable Models: Post-2025 sales weakness (1.8M deliveries est.), expect 2.3M+ in 2026 with Model 2 launch (~$25K EV) ramping production to 3M+ annually. This counters China/EU headwinds, recaptures 20%+ US market share, and boosts EPS to $0.49 next quarter—fueling a $450 breakout per LongForecast's Q3 2026 path.
2 sources
Morningstar sees a 2026 revival echoing 2016's Model 3 surge.
Energy Storage Boom: Megapack deployments exploding (Q2 2025: 9.4 GWh), with 50%+ YoY growth projected through 2026, diversifying revenue to 15%+ of total. This hedges EV volatility, pushing margins to 20%+ and supporting $500 on 11% revenue growth to $130B.
Optimus Humanoid Robot Sales: External sales kick off late 2025/early 2026, targeting $20K/unit with factory pilots scaling to millions. This could add $1T+ valuation long-term, per ARK, but even modest adoption lifts sentiment to $500 by EOY 2026.
2 sources
ADOBE 510 BY 2026 LONG TERM Why Adobe (ADBE) Could Hit $510 by 2026: Technical Breakdown Adobe's trading at ~$365 today, but bullish setups scream upside. Here's why $510 (40% gain) is in play:Bullish Triangle Breakout: ADBE's consolidated in a multi-year ascending triangle since 2020. A recent close above $370 resistance (near 50-day MA ~$383) signals breakout, targeting $510 (measured move from base at $330 low).
RSI Rebound: At 42 (neutral, not oversold), RSI is coiling for momentum shift. Weekly RSI >50 could trigger buy signals, aligning with AI-driven catalysts like Firefly integrations.
MACD Crossover Potential: MACD histogram narrowing (-5.26) hints at bullish crossover by Q4 2025. Paired with 200-day MA (~$420) as next support, this flips sentiment to "Strong Buy" per TradingView.
Analyst Backing: Consensus targets $465–$496 short-term, but long-term forecasts (e.g., LongForecast) eye $577 EOY 2026 on 11% revenue growth to $23B+.

I am buying AMAZONI am buying AMAZON
Amazon's stock lost over 10% last week, marking a significant decline within just one week.
I will start buying using dollar cost averaging (DCA) with $240 as my long-term to mid-term target.
I will hold
Please like, share, comment and follow.
I look forward to connecting with you

BTCUSDT.P 1D Time frameMarket Overview
Current Price: ~$112,380
Daily Change: Slight dip (around –0.3%)
Volatility: At multi-month lows, meaning the market is consolidating before a possible breakout.
📈 Key Levels
Immediate Resistance: $112,800 → price needs to clear this for upside continuation.
Next Resistance Zones: $114,000 → $116,000, and further up around $128,000.
Immediate Support: $111,000 → first cushion below current price.
Deeper Support: $110,000, then $107,800–108,000.
🔎 Technical Indicators
RSI (14-day): ~43 → Neutral, showing neither overbought nor oversold conditions.
MACD: Bullish crossover → suggests upward momentum is building.
Stochastic Oscillator: Near oversold → possible short-term bounce.
🧭 Outlook
Bullish Case: A sustained breakout above $114,000 could open a rally toward $128,000.
Sideways Case: Holding between $111,000 and $113,000 keeps Bitcoin in consolidation.
Bearish Case: A break below $110,000 could trigger a move toward $108,000 or even $102,000.
Overall Bias: Moderately bullish, but the market is in a tight range and waiting for a breakout.

BABA 1D Time frame📊 Market Snapshot
Current Price: Around $146–147
Recent Trend: Strong upward momentum over the past weeks
Overall Technical Bias: Bullish, but nearing overbought
🔎 Technical Indicators
RSI (14-day): ~75 → Overbought zone, signals strong momentum but also risk of pullback.
MACD: Positive → Momentum remains bullish.
Stochastic & CCI: High readings → Also showing overbought conditions.
📈 Moving Averages
5-day MA: ~$146 → Bullish short-term support
10-day MA: ~$145 → Still bullish
20-day MA: ~$140 → Strong base level
50-day MA: ~$137 → Medium-term support
100-day MA: ~$130 → Long-term support
200-day MA: ~$125 → Major long-term support
All major moving averages are aligned bullishly.
🔧 Support & Resistance
Support Zone: ~$145–146
Resistance Zone: ~$147–150 (immediate), with potential toward $160 if breakout continues
📅 Outlook
Bullish Case: If price holds above ~$147, it could target $150+ and possibly $160.
Bearish Case: Overbought readings may trigger a pullback toward $145 or even $140.
Overall Bias: Bullish trend intact, but short-term consolidation or mild correction is possible.

MSTR 1D Time frameMarket Snapshot
Current Price: ~$328.50
Daily Change: -0.4% (approx)
Technical Overview
Indicators & Momentum
RSI (14-day): ~40 → Neutral, slightly below the midpoint—no major squeeze yet.
MACD: Negative (~–1.6) → Weak bearish momentum.
Stochastic Oscillator: Around 31 → Neutral to slightly oversold.
Stochastic RSI: Overbought zone → Possible short-term exhaustion.
Williams %R: ~–39 → Suggests room for both upside and downside.
ADX: ~18–26 → Indicates a weak to moderate trend—market lacks strong direction.
Moving Averages
Short-term moving averages (like 5-day and 10-day) show buy signals, while broader averages—including the 20-day, 50-day, 100-day, and 200-day—are all negative, suggesting broader downward pressure.
Support & Resistance
Based on various pivot point analyses:
Immediate Support: ~$324–325
Near-term Support Zone: ~$320
Immediate Resistance: ~$332–334
Further Resistance: ~$340–345
Broader Technical & Market Context
Downtrend in Play: The stock has declined nearly 40% from its July highs and is approaching its lowest levels since April.
Death Cross Forming: The 50-day moving average is nearing a bearish crossover below the 200-day average.
Diving Technical Ratings: Most moving averages and oscillators point to a negative bias—short-term signals are weak, and longs are retreating.
Bullish Divergence? Some chart setups hint at a potential wedge or triangle pattern with possible bullish divergence, but these are speculative and not yet confirmed.
MicroStrategy remains under pressure, with indicators pointing overwhelmingly to neutral or bearish signals. While short-term moving averages show minor support, the broader technical picture remains weak—and a breakout above ~$334 would be needed to suggest a reversal.

MSFT 1D Time frameMarket Snapshot
Current Price: ~$498.41
Daily Change: +0.23 (≈0.05%)
Market Cap: ~$2.79 Trillion
P/E Ratio: ~28.9
EPS: ~12.93
🔎 Technical Indicators
RSI (14-day): ~41 → Neutral, leaning slightly bearish.
MACD: –2.7 → Negative but giving a weak buy crossover signal.
Williams %R (14-day): ~–74 → Suggests a possible rebound (buy).
CCI (14-day): ~–108 → Oversold zone, buy indication.
ADX (14-day): ~20.6 → Weak trend strength.
ROC (Rate of Change): –3.5 → Mild bearish momentum.
📈 Moving Averages
5-day MA: Below current price → Bearish short-term.
20-day MA: Below current price → Bearish.
50-day MA: ~$509, above price → Acting as resistance.
100-day MA: ~$476, below price → Supportive.
200-day MA: ~$443, below price → Long-term uptrend still intact.
🔧 Support & Resistance
Support Zone: ~$491 – $497
Resistance Zone: ~$500 – $510
📅 Outlook
Bullish Case: If MSFT climbs above $509–510, momentum could extend toward new highs.
Bearish Case: A break below $491 may lead to a pullback toward $480–485.
Overall Bias: Neutral to slightly bearish in the short term, but long-term bullish trend remains intact above the 200-day MA.

ADANIPORTS 2Hour Time frameADANIPORTS 2-Hour Snapshot
Current Price: ₹1,388.90
Previous Close: ₹1,380.90
Day Range: ₹1,385.00 – ₹1,404.90
52-Week Range: ₹995.65 – ₹1,494.00
Volume: 2,553,605
VWAP: ₹1,392.82
Market Cap: ₹300,065 Cr
🔎 Technical Indicators
Relative Strength Index (RSI): Neutral
Moving Averages:
50-period: ₹1,385.28 — Negative
100-period: ₹1,368.32 — Negative
200-period: ₹1,260.96 — Positive
Moving Average Convergence Divergence (MACD): -14.67 — Negative
Stochastic Oscillator: 39.95 — Neutral
📈 Market Sentiment
Pivot Points:
Resistance: ₹1,327.20
Support: ₹1,305.85
📅 Outlook
Bullish Scenario: A breakout above ₹1,327.20 could signal a move toward ₹1,350.00.
Bearish Scenario: A drop below ₹1,305.85 may lead to further downside.
Overall Bias: Neutral, with mixed signals from moving averages and momentum indicators.

BTCUSDT 2Hour Time frameBTC/USDT 2-Hour Snapshot
Current Price: $112,349.00
Change: -0.29% from the previous close
Intraday High: $112,891.00
Intraday Low: $110,812.00
🔎 Technical Indicators
Relative Strength Index (RSI): Neutral
Moving Averages:
7-period MA: $112,376 (short-term support)
25-period MA: $111,484 (medium-term support)
99-period MA: $113,049 (short-term resistance)
📈 Market Sentiment
Pivot Points:
Resistance: $113,650
Support: $108,666
📅 Outlook
Bullish Scenario: A breakout above $113,650 could signal a move toward $120,000.
Bearish Scenario: A drop below $108,666 may lead to further downside.
Overall Bias: Neutral, with mixed signals from moving averages and momentum indicators.

USDJPY 2Hour Time frameUSD/JPY 2-Hour Snapshot
Current Price: 147.46 JPY
Change: +0.05% from the previous close
Market Cap: Not applicable
P/E Ratio: Not applicable
EPS: Not applicable
Intraday High: 147.59 JPY
Intraday Low: 147.27 JPY
🔎 Technical Indicators
RSI (14): Neutral
MACD: Neutral
Moving Averages:
5-period SMA: Not available
10-period SMA: Not available
20-period SMA: Not available
50-period SMA: Not available
📈 Market Sentiment
Pivot Points:
R1: Not available
R2: Not available
R3: Not available
S1: Not available
S2: Not available
S3: Not available
📅 Outlook
Bullish Scenario: A breakout above the current price could lead to further gains.
Bearish Scenario: A drop below the current price may test support levels.
Overall Bias: Neutral, with mixed signals from moving averages and momentum indicators.

MSFT 45Minutes Time frameMSFT 45-Minute Snapshot
Metric Value
Current Price $498.41 USD
Change +0.05% from previous close
Market Cap $2.79 Trillion
P/E Ratio 28.88
EPS $12.93
🔎 Technical Indicators
RSI (14): 40.92 — Neutral
MACD: -2.70 — Bearish momentum
Moving Averages:
5-period SMA: $502.33 — Sell signal
10-period SMA: $504.10 — Sell signal
20-period SMA: $509.62 — Sell signal
50-period SMA: $509.09 — Sell signal
📈 Market Sentiment
Pivot Points:
R1: $507.19
R2: $519.38
R3: $526.79
S1: $487.59
S2: $480.18
S3: $467.99
📅 Outlook
Bullish Scenario: A breakout above $507.19 could lead to a push toward $519.38 and higher.
Bearish Scenario: A drop below $487.59 may test support around $480.18.
Overall Bias: Neutral to slightly bearish, with mixed signals from moving averages and momentum indicators.

TSLA 45Minutes Time frameTSLA 45-Minute Snapshot
Current Price: $346.97 USD
Change: +0.18% from the previous close
Intraday Range: Not available
🔎 Technical Indicators
RSI (14): 53.64 — Neutral
MACD: 1.78 — Buy signal
Moving Averages:
5-period SMA: $347.01 — Sell signal
10-period SMA: $346.78 — Buy signal
20-period SMA: $347.82 — Sell signal
50-period SMA: $340.53 — Buy signal
📈 Market Sentiment
Pivot Points:
R1: $347.52
R2: $348.18
R3: $348.95
S1: $345.32
S2: $344.65
S3: $343.99
📅 Outlook
Bullish Scenario: A breakout above $347.52 could lead to a push toward $348.18 and higher.
Bearish Scenario: A drop below $345.32 may test support around $344.65.
Overall Bias: Neutral to slightly bullish, with mixed signals from moving averages.

BANKNIFTY 45Minutes Time frameBANKNIFTY 45-Minute Snapshot (Updated)
Current Price: 54,533 INR
Change: +0.77% (approx) from previous close
Day's Range: 54,200 – 54,600 INR (intraday estimate)
52-Week Range: 45,000 – 60,000 INR
🔎 Technical Indicators
RSI (14): ~65 — Slightly overbought, watch for pullbacks
MACD: Positive, bullish momentum
Moving Averages:
5-period SMA: 54,300 — Price above SMA → Buy signal
10-period SMA: 54,100 — Price above SMA → Buy signal
20-period SMA: 53,800 — Price above SMA → Buy signal
50-period SMA: 53,200 — Price above SMA → Buy signal
🔑 Key Levels
Resistance:
R1: 54,600 — Immediate resistance
R2: 55,000 — Psychological/round number resistance
Support:
S1: 54,300 — Near-term support
S2: 54,000 — Stronger support
📅 Outlook
Bullish Scenario: Price holds above 54,500 and breaks 54,600 → upward move toward 55,000.
Bearish Scenario: Price falls below 54,300 → pullback to 54,000 possible.
Overall Bias: Moderately bullish with strong upward momentum, but near-term resistance around 54,600.
