Short-Term Peak Range: 2654.48 ~ 2753.63
Hello,
Nice to meet you, fellow traders.
If you follow me, you can always receive new information quickly.
Have a great day today as well.
-------------------------------------
The volatility period lasts until October 7.
Therefore, it is important to observe the price range in which newly formed candles are maintained.
The next volatility period is expected around October 26.
However, since BTC's volatility period is around October 18, it is necessary to closely monitor price movements
Aroon
Silver Bearish Breakdown Setup** Silver is showing a bearish structure below the descending trendline and the **61.80–62.10 resistance zone**. Price is rejecting resistance and continuing lower, suggesting further downside if the breakdown holds.
**Target:** **58.20–58.40 support zone**
**Bias:** Sell / Bearish
**Invalidation:** Sustained move above **62.10**.
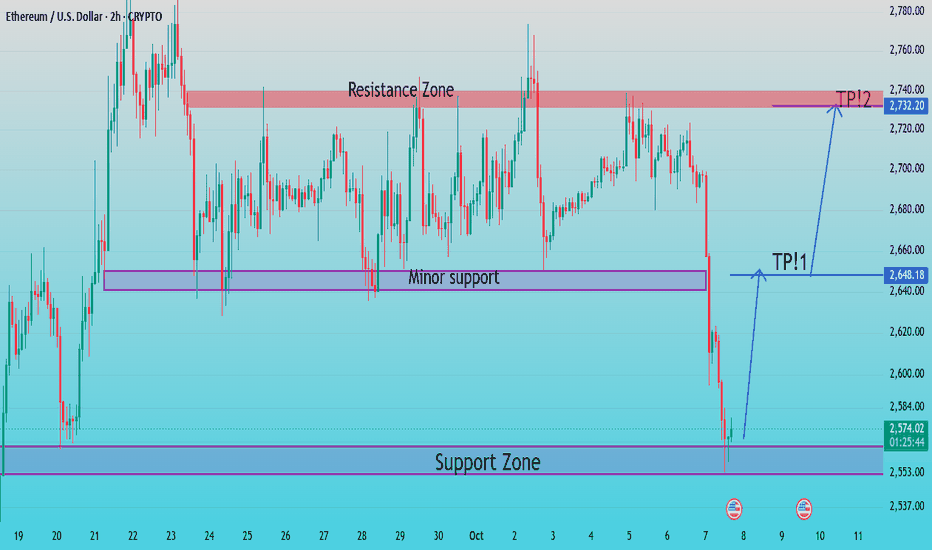
ETH/USD 2H: Support Zone Bounce — Targets $2,648 & $2,732Ethereum (ETH/USD) is testing a major **support zone around $2,553–$2,571** after a sharp sell-off. The chart shows a potential bullish rebound from this area.
* **Support Zone:** $2,553–$2,571
* **TP1:** $2,648 — minor resistance/support level
* **TP2:** $2,732 — major resistance zone
* **Resistance Zone:** around $2,732–$2,740
* **Bullish idea:** A successful hold of the support zone could trigger a recovery toward TP1 and potentially TP2.
* **Invalidation:** A decisive break below the suppor
Ethereum H4 | Bullish Bounce SetupBased on the H4 chart analysis, we can see that the price is falling to our buy entry at 2,377.83, which is a pullback support.
Our stop loss is set at 2,239.42, which is a pullback support.
Our take profit is set at 2,575.07, which is a pullback resistance.
High Risk Investment Warning
65% of retail investor accounts lose money when trading CFDs with this provider. You should consider whether you understand how CFDs work and whether you can afford to take the high risk of losing your money.
Ethereum #ETHUSDT — Descending Wedge & High R/R Zone
#ETH
The price is moving within a descending channel on the 1-hour timeframe; having reached the lower boundary, it is poised for a rebound, suggesting a potential upward move upon retesting this level.
The Relative Strength Index (RSI) indicates a bearish trend; however, a bullish breakout is likely given that the price has reached "oversold" levels on the 1-hour chart.
An orange trendline supports the likelihood of a bullish rebound.
An initial support level exists at 2425, serving as a
$ETH is going to $1000 or belowI'm sure no one wants to see a post with a low target on it while everyone just got excited about the bull run, but I still believe we haven't seen capitulation yet in crypto.
When has crypto ever bottomed and peoples first reaction is to buy meme coins? Never.
Usually there's pain when we bottom and no one wants to touch alts. I think that needs to happen still before we see a cycle bottom.
My chart on ETH here
My chart on Total3 here
still haven't met their target yet so I continue to
Ethereum Has a Deep Drop Ahead! Hunt It Down (2H)Considering that the price has reached an important resistance zone and the recent bearish candles have become significantly stronger, the current price action suggests increasing selling pressure.
Another important factor is the liquidity trendline that has formed across the recent lower highs. As long as the bearish structure remains valid, we expect this trendline to eventually break to the downside, potentially accelerating the next bearish move.
Based on the current structure, we have ide
Bullish continuation after support bounce?Ehtereum (ETH/USD) has bounced off the pivot and could potentially rise towards the 1st resistance.
Pivot: 2,644.39
1st Support: 2,575.93
1st Resistance: 2,779.32
Disclaimer:
The opinions given above constitute general market commentary and do not constitute the opinion or advice of IC Markets or any form of personal or investment advice.
Any opinions, news, research, analyses, prices, other information, or links to third-party sites contained on this website are provided on an "as-is" basi
Ethereum - Starting another +50% bullrun!💵Ethereum ( CRYPTO:ETHUSD ) just remains totally bullish:
🔎Analysis summary:
Not a long time ago, Ethereum retested its major higher timeframe confluence of support. So far, Ethereum also already created a major bullish rejection of about +70%. Looking at the higher timeframe, Ethereum can still rally another +50% in the very near future.
📝Levels to watch:
$4,000
Keep your #LONGTERMVISION🙏
— Phil (@TheTraderPhil)
XAUUSD Bullish Rebound Setup Gold (XAUUSD) is showing a bullish rebound from the support zone around **4,110–4,115**, with price currently near **4,165**. The structure suggests buyers are gaining strength, with the first upside target at **4,191**. A breakout above this level could open the way toward the major resistance and final target around **4,218–4,220**.
**Targets:**
🎯 **TP1: 4,191**
🎯 **TP2: 4,218–4,220**
🛡️ **Key support: 4,110–4,115**
ETH/USD SHORT FROM RESISTANCE
ETH/USD SIGNAL
Trade Direction: short
Entry Level: 2,488.92
Target Level: 2,414.56
Stop Loss: 2,538.58
RISK PROFILE
Risk level: medium
Suggested risk: 1%
Timeframe: 1h
Disclosure: I am part of Trade Nation's Influencer program and receive a monthly fee for using their TradingView charts in my analysis.
✅LIKE AND COMMENT MY IDEAS✅
ETHUSD | Demand Zone Reversal Setup | 15M Bullish Scenario📊 ETHUSD 15M Analysis
Ethereum has reached a key demand zone around 2681-2685, an area where buyers may step in after the recent decline.
The current structure suggests a potential bullish reaction from support if price successfully holds this zone. The idea is based on:
✅ Strong demand/support area
✅ Previous intraday reaction zone
✅ Potential liquidity sweep into support
✅ Recovery toward nearby resistance levels
🎯 Targets
• Target 1: 2705
• Target 2: 2720
• Target 3: 2735
⚠️ Invalidation
Ethereum Wave 4 Consolidation Could Lead to Another Push HigherEthereum remains in a strong recovery, with the current consolidation potentially representing wave 4. A pullback toward support could set the stage for another move higher in wave 5 toward 2900–3000.
Ethereum is recovering strongly within the projected five-wave impulse, as expected. Price is still consolidating near the highs, suggesting that wave 4 correction may still be in progress. ETH could revisit the 2570–2350 support zone before a bullish continuation into wave 5, with the next targ
ETHEREUM PRICE ALERT: $2,562 Could Decide Next Major $ETH MoveETHEREUM PRICE ALERT: $2,562 Could Decide The Next Major CRYPTOCAP:ETH Move
CRYPTOCAP:ETH is approaching a critical SMC decision zone. The chart shows $2,562 as key inducement. If the daily candle breaks below $2,562 and closes there, I will shift focus toward the next Higher Low rather than chasing price.
MY ETH ACCUMULATION ZONE: I will watch the $2,053–$1,868 region closely, where multiple confluences could align:
→ 0.5–0.618 Fibonacci retracement
→ Fair Value Gap (FVG)
→ Bullish Or
Ethereum Tests Major Support — Can Bulls Defend the Uptrend?Market Structure
Ethereum remains in a medium-term bullish structure on the 4-hour chart despite today's sharp decline. After rallying strongly toward the 2,780 area, price entered a broad consolidation before experiencing aggressive selling pressure. Although the latest drop has weakened short-term momentum, the broader trend remains constructive as long as Ethereum holds above its key support zone.
Market Sentiment - Neutral to Moderately Bullish
Market sentiment has shifted from bullish
ETHUSD | Bullish Reclaim From Dmand ZoneEthereum has reacted strongly from the marked support region and is now attempting to reclaim short-term structure above the entry zone.
The current idea is based on:
✅ Demand zone holding after liquidity sweep
✅ Higher low formation on the 15M chart
✅ Recovery toward nearby resistance levels
✅ Bullish momentum building after rejection from lower prices
As long as price remains above the highlighted entry area, the focus remains on potential continuation toward the marked targets.
🎯 Target 1
GOLD 1H — Resistance Rejection → Targets 4,139 & 4,110
The chart shows gold trading around **4,175**, approaching a major resistance zone.
- **Resistance 1:** \~**4,192–4,197**
- **Resistance 2:** \~**4,216–4,221**
- **Current price:** \~**4,175**
- **Target 1:** **4,139.50**
- **Target 2:** **4,110–4,115** support zone
- **Bias:** **Bearish below 4,192–4,197 resistance**
### 📉 Trade idea
Price is expected to push toward the **4,192–4,197 resistance**, potentially reject, and then move lower:
**Entry / rejection zone:** 4,190–4,197\
**Tar
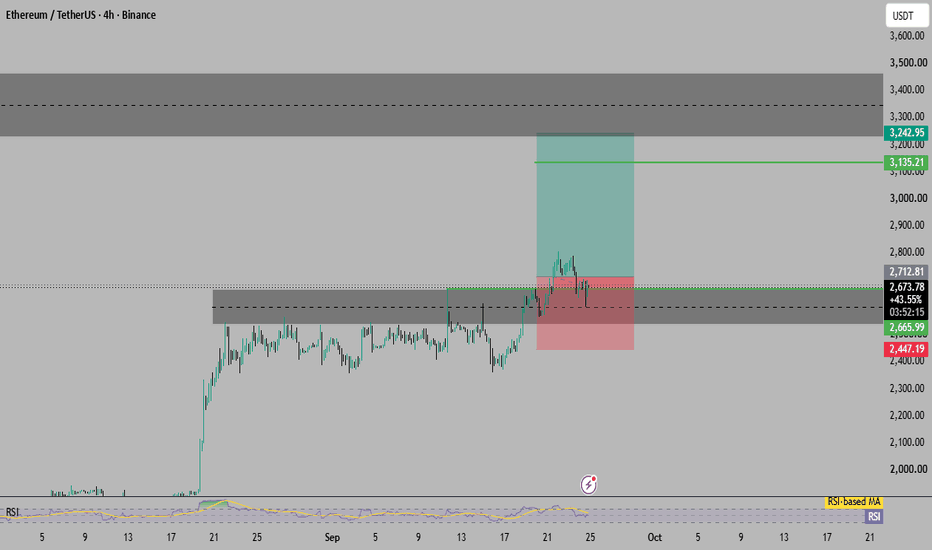
ETH/USDT (4H) — Retest of Range Breakout & Upside Continuation SMarket Structure & Technical View:
Ethereum has broken out from a multi-week horizontal consolidation block around $2,665 – $2,700 and is currently holding a clean breakout-and-retest structure on the 4-hour timeframe. Price pushed up to tap local highs near $2,800 before pulling back to retest the prior resistance level as fresh support.
The 4-hour RSI remains balanced above the 50 level, confirming that buyers are defending this structural shelf. Sustaining above the retest base paves the wa
Ethereum Is Worth $327B | Where’s the Revenue?Crypto investors spend a lot of time talking about adoption, users, transaction volume and total value locked..But there is another question that often gets pushed into the background
How much of that economic activity actually reaches the token holder?
Ethereum is a perfect example
As of October 3, 2026, ETH is trading around $2,680, giving Ethereum a market capitalization of roughly $327 billion
Now compare that valuation with Ethereum's recent revenue
Ethereum generated about $5.27 m
ETHUSD | Demand Zone Reclaim Could Open Room for Higher Prices📊 ETHUSD is currently holding a previously identified demand zone after a sharp bearish move.
The market has reacted from the bearish-level support zone and is attempting to build a short-term base around the entry area. As long as buyers continue defending this region, price may have room to revisit higher liquidity levels.
🎯 Potential Upside Levels • Target 1: $2705 - $2710
• Target 2: $2725 - $2730
• Target 3: $2770 - $2775
🔍 Key Idea:
Strong reaction from support
Recovery structure form
ETHUSD — 1H Market Structure AnalysisPrice has established a bullish Break of Structure (BOS) after pushing above the previous swing high around the 2,740–2,750 area. This indicates a shift in short-term market structure and shows that buyers were able to overcome the previous resistance.
However, after reaching the 2,760–2,770 region, price showed a strong rejection and moved back toward the lower structure area.
Potential Support Zone
The highlighted 2,650–2,670 zone is an important area to monitor. It acted as a previous cons
XAUUSD Bearish Breakdown Setup*
Gold (XAUUSD) is showing a bearish structure on the 4H chart, with price trading below a descending trendline and facing resistance around the 4,170–4,200 area. The recent rejection suggests sellers remain in control. A continuation lower could push price toward the marked support zone around **4,020–4,040**, which is the main target. A sustained break above the descending trendline would weaken the bearish setup.
**Target: 4,020–4,040**
7 Years Later, I Don’t Predict Ethereum — I Read Its Structure
In previous ETH updates, we kept following one simple question:
Is the larger corrective structure still developing, or is the market already beginning a new impulsive move one degree higher?
What we can see today on the Daily chart is interesting because part of the structure we discussed in previous analyses has now become clearer through price development.
The move from the area around 1,500 can still be examined as a developing impulsive structure, with 1–2 and 3–4–5 sequences appearing
Silver Bullish Rebound Setup** Silver is holding near the **59.80–60.20 support zone** after a strong decline. The chart shows a potential bullish rebound from support, with price aiming to recover toward the marked **64.53 target**. A sustained move above the nearby resistance around 63.60 would strengthen the upside setup.
**Target:** 64.53
**Bias:** Buy 📈