G O L D : (Buy Stop 5082+)Gold Buy Stop - (Xausd) looking to be buying this is due to its trend and price structure as usual we follow the trend and look at the structure ,combine that with our daily direction this helps us discover the sentiment of the market for the day
Potential New Price : 5118.269
Beyond Technical Analysis
Live Trade
This is my live trade documented, I wanted to see higher prices on Eur/Usd, I executed and entered the trade and explained what I wanted to see in hindsight. I cut half of my position at the high and trailed my stop loss to profit which was eventually tagged.
Ideation behind the trade
- Bullish directional bias
- News event at 1:30 PM Eastern Standard Time
- Manipulation Lower
BTCUSDTHello Traders! 👋
What are your thoughts on BITCOIN?
After the recent sharp decline, Bitcoin has entered a clear consolidation range. The upper and lower boundaries of this range are marked on the chart.
As long as price remains inside this range, we should not expect a strong directional move. Instead, price action is likely to remain choppy with back-and-forth movements
At this stage, patience is key. The next meaningful move will likely come only after a confirmed breakout from one of the range boundaries.
Bullish Scenario:
A breakout and 4H close above the resistance zone could trigger upside continuation toward the highlighted target levels.
Bearish Scenario:
A breakdown and close below the support zone could lead to further downside toward the previous low.
Until one of these levels is decisively broken, the market remains range-bound.
Don’t forget to like and share your thoughts in the comments! ❤️
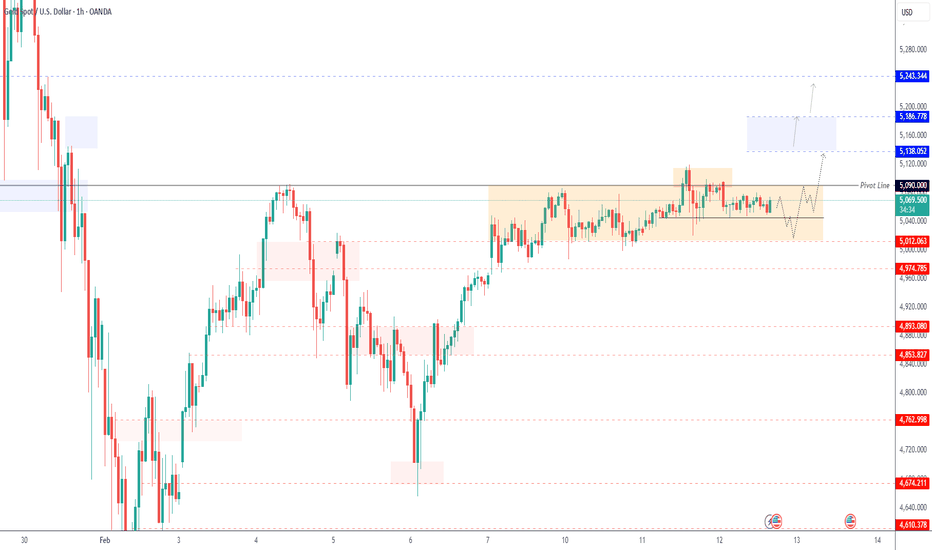
GOLD | Consolidates Ahead of Key U.S. DataGOLD | Consolidation Ahead of Key U.S. Data
Gold remains in a consolidation range between 5090 and 5054 as markets await important U.S. economic data, which could drive the next major move.
Technical Outlook
While price trades below 5090, bearish pressure remains active toward 5012, followed by 4974.
A breakout above 5090 would invalidate the bearish bias and support bullish continuation toward 5138 and 5186.
Key Levels
• Pivot: 5090
• Support: 5045 – 5012 – 4975
• Resistance: 5138 – 5186
AMPG Orderflow (Daily)
No Bullish mBOS/CHoCH yet (@$3.29)
FVG from 13/11/2026 - 17/11/2026 fully mitigated .
Testing bullish gap up from 13/11/2026 - 14/11/2026 (gap fill @$2.66)
Sellside liquidity under $2.76. Buyside Liquidity over $3.16 & $3.29.
Weak short term Substructure Swing High @$3.16 if Fractal Swing Low @$2.70 does not get taken out.
Looking for Absorption candles & trapped shorts (i.e Daily close above Bearish Imbalance/s).
US30 price drop trackingTo look for an entry, we see an excellent bullish daily structure in accumulation to reach a sell-side liquidity zone. In this case, the liquidity zone would be New York clearing the London high of the same day; this would be the confirmation at 50,396, targeting a 1:3 trade down to 50,092. This trade would be a follow-up to Tuesday's drop, expecting a stop hunt into the indicated zone to look for the entry.
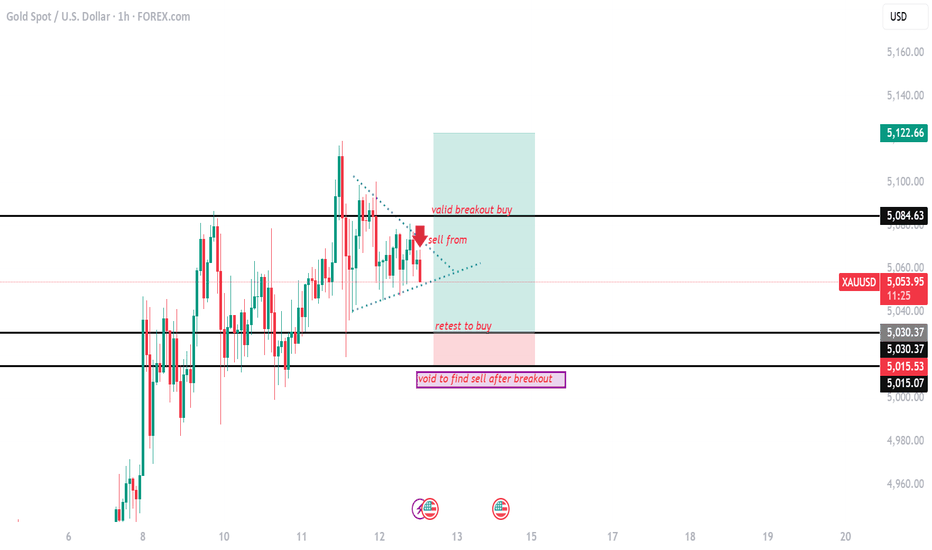
gold on retest below 5030#XAUUSD base on D1 similar candle, we expect opposite move first on price before actual move. Price needs to retest below 5030 for continuation on buy.
5030 2 times breakout buy, target 5080,5122, SL 5015.
Above 5074 can expect drop till 5030 but valid breakout above 5084 on M15 tf will continue buy.
If breakout below 5007 then we look for sell.
US30 | Pullback After Fresh Record HighUS30 | Pullback After Record High as Global Risks Rise
Global markets presented a mixed picture as investors balanced strong Asian equities, U.S. political tensions, and corporate turbulence in tech and media. After recording a new all-time high at 50,530, the Dow is now showing signs of a short-term pullback.
Technical Outlook
The index has shifted into a bearish corrective phase below 50,390.
As long as price remains below 50,390, downside pressure is expected toward 50,000, followed by 49,680.
A move above 50,390 would invalidate the bearish bias and support a continuation higher toward 50,705 and 50,900.
Key Levels
• Pivot: 50,390
• Support: 50,000 – 49,680
• Resistance: 50,705 – 50,900
previous idea:
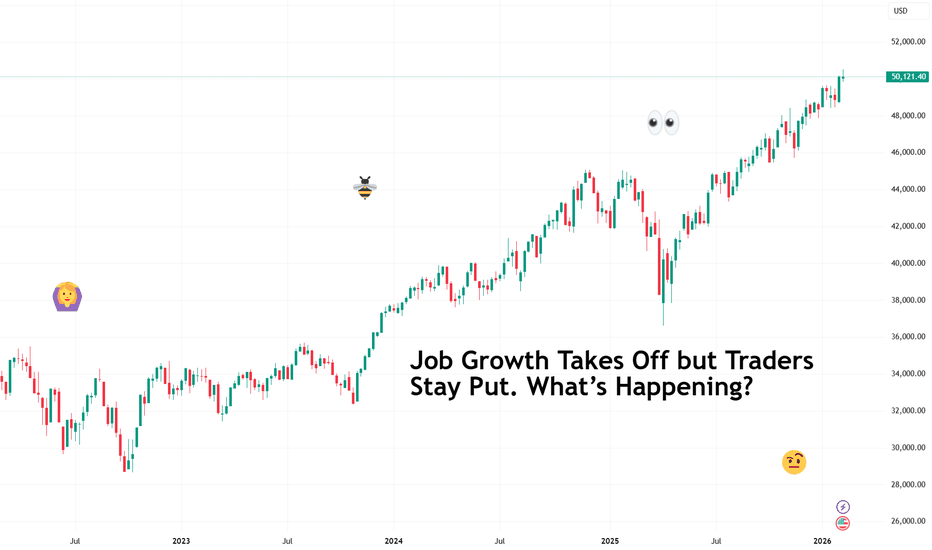
Job Growth Takes Off but Traders Stay Put. What’s Happening?Are these jobs in the room with us right now?
📊 A Blockbuster Headline
The delayed January jobs report arrived Wednesday. Nonfarm payrolls ECONOMICS:USNFP showed 130,000 new hires , more than double the 55,000 estimate. On paper, that looked like a strong start to the year.
Wall Street’s reaction, though, was far from a celebration.
The Dow Jones Industrial Average TVC:DJI slipped 0.1%, or about 67 points. The S&P 500 SP:SPX finished flat, while the Nasdaq Composite NASDAQ:IXIC dipped 0.2%. Traders glanced at the headline, then at the fine print, and decided no buying would be done that day.
🔍 The Fine Print That Changed the Mood
Investors sometimes tend to read beyond the headline, and this report was one of those times. Annual revisions from April 2024 to March 2025 removed 862,000 jobs previously counted as real.
That is the largest revision since 2009.
Add to that another twist: November and December job growth was revised lower by a combined 17,000 jobs, effectively turning what looked like modest gains into slight contraction.
The past few months just got rewritten by nearly one million jobs. Jobs that had sparked buying, rallies, and record highs were built on... fake news?
🧮 The Math Behind the Skepticism
On the surface, 130,000 new hires sounds impressive. Dig deeper, and the composition tells a more nuanced story.
Roughly 82,000 of those jobs came from healthcare, and about 50,000 of that total was in ambulatory healthcare services.
Concentrated growth in one sector often signals structural hiring trends rather than broad economic acceleration. If real. But we all know how busy January is when it comes to hiring.
Meanwhile, employers announced 108,435 job cuts in January, the highest level for the month since the 2009 recession and a 118% increase from a year earlier.
One dataset suggests momentum. Another signals strain. Traders, faced with conflicting signals, chose caution.
🏦 Credibility and the Fed Factor
Federal Reserve officials, including Chair Jerome Powell, have already suggested that labor market data may face more revisions in the near future.
If payroll gains can be revised lower by hundreds of thousands over the course of a year, investors question the credibility of the current strength.
📉 Why Stocks Didn’t Celebrate
Let’s assume that the job number is actually real. Normally, strong job growth sparks optimism about consumer spending and corporate earnings.
A hotter labor market can also complicate rate-cut expectations. Strong hiring may delay monetary easing, which equity markets have come to anticipate.
At the same time, large revisions and rising layoff announcements paint a softer picture beneath the surface. The result is a stalemate. Good news feels fragile.
🎢 A Market Caught Between Signals
Financial markets thrive on clarity. The January report offered energy but limited conviction.
Traders are weighing three key questions:
Is hiring genuinely accelerating?
Are revisions signaling deeper weakness?
How will the Federal Reserve interpret this mix?
Until those answers sharpen, market participants may continue to hold their positions rather than extend them. Next up on the economic calendar — inflation data coming Friday.
Off to you : Are you holding, adding, or getting rid of your stock? Are these numbers as real as your unrealized YTD gains? Share your views in the comments!
Excellent structure in USDMXN to look for a buy in the liquidityEntry at price 17.15379 where a New York reversal is expected for the price to continue seeking its equilibrium, which is the Asian open. The price has dropped significantly, therefore we would look for the price to seek a correction and close again in the same zone where it closed in Asia; this is called market equilibrium.
AMPG Orderflow (W)Testing Line in the sand/corkscrew:
1) Retesting Absorption Weekly candle from 10/02/2026 - 17/02/2026.
Trapped shorts breakeven liquidation from bearish imbalance @$2.70-2.67 stabilising price.
Weekly inside bar close above $2.70 would provide a Minor Swing Low for a possible final liquidation into Bullish Imbalance @2.63.
2) Diminishing negative delta could provide confirmation in regards to a Test of No Supply under $2.70.
3) Looking for weekly absorption candle closing about bearish imbalance/s.
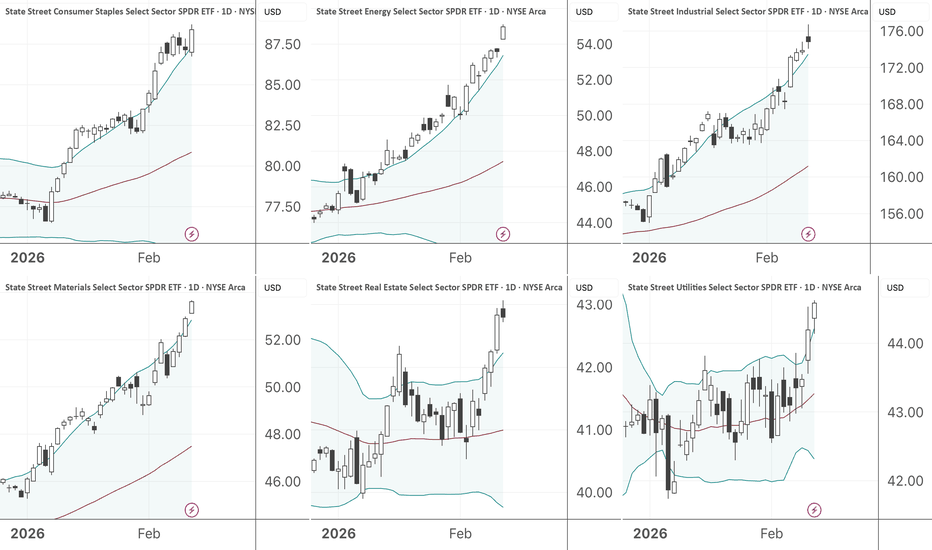
Why S&P 500 Sectors Have My Attention NowFor the first time in 35 years, more than half of the S&P 500 sectors are extremely overbought... while the index itself is struggling to maintain neutral territory. 🤯
Using a 50-period Bollinger Band (standard deviation framework around a 50 MA), we can define “extremely overbought” as price trading outside the upper band.
Right now, the following sectors are outside their upper Bollinger Bands:
Consumer Staples AMEX:XLP
Energy AMEX:XLE
Industrials AMEX:XLI
Materials AMEX:XLB
Real Estate AMEX:XLRE
Utilities AMEX:XLU
That’s more than half of the major S&P sectors extended beyond their statistical mean at the same time... while at the same time the index as a whole struggles to maintain neutral territory.
This hasn’t occurred in 35 years.
Important: This Is Not Automatically Bearish
An overbought condition is not a sell signal. Markets can stay irrational longer than most trader accounts can stay solvent . In strong momentum environments, riding the upper band can actually signal persistent institutional accumulation.
However… When this many sectors are simultaneously stretched, two things become true:
The probability of sector-level pullbacks increases.
The S&P 500 becomes vulnerable if those pullbacks happen together.
The index doesn’t need panic selling to decline — it just needs enough sectors mean-reverting at the same time.
The Bigger Context Matters
Here’s where it gets more interesting.
While these sectors are extremely extended, the S&P 500 itself is struggling to make meaningful upside progress. Momentum (MACD) has been making lower highs for over 260 days while price has made higher highs.
That kind of bearish divergence suggests:
Internals are weakening
Upside participation is narrowing
Progress is slowing
The S&P 500 is telling you it's “ tired. ”
Now, there’s an old saying on Wall Street: Never short a boring market.
I agree.
To be clear...
I’m not forecasting a crash.
I’m not forecasting a trend reversal.
But I do believe we’re in a period where:
Bullish trades require tighter risk management
Expectations for explosive upside should be tempered
Mean reversion is more likely than momentum expansion
Here’s what you need to keep an eye on:
If overbought sectors begin rolling over one by one
If the S&P fails to hold neutral territory
If MACD divergence continues while price stalls
A coordinated sector pullback could create the kind of controlled retracement we often see heading into late Q1.
The Takeaway
Be cautious with your bullish trades. Manage your account risk. Be relentless with your use of stops.
I'm curious to hear your thoughts:
Do you view widespread overbought readings as exhaustion or strength?
Are you tightening up your trades here?
How will seasonality and the presidential election cycle add pressure to the market?
Share your comments below!
ONDO: poised for a bounce? key levels and targets to watchONDO. Still watching this RWA kid bleed and wondering when it finally wakes up? According to market chatter, the project keeps pushing tokenized Treasuries and new integrations, but price has been in a long cooldown after the hype spike. Now we’re sitting right on a big 4H demand block around 0.24 where sellers started to dry up.
On the 4H chart I see a steady downtrend, but the last legs are more sideways than vertical and RSI is making higher lows while price chops in a tight range – classic early bullish divergence. Volume profile shows a fat node and point of control near 0.27–0.28, so any bounce has a clear magnet above. With funding calm and fresh RWA headlines, I’m leaning toward a relief long rather than another straight dump.
My base plan: as long as the green support zone around 0.24 holds, I like a move first into 0.27–0.28 and, if buyers press, into the next supply near 0.30–0.32 ✅. If we get a clean 4H close below 0.24, that kills the idea for me and opens room toward 0.22 and even 0.21, where I’d rather wait for the next setup ⚠️. I might be wrong, but I’m slowly scaling in with tight risk just under that support.
Report 12/2/26Macro & Geopolitical Report
Report Summary:
This report evaluates the market impact of the Pentagon preparing a second aircraft carrier strike group for possible Middle East deployment as the U.S. positions credible military options if U.S.–Iran negotiations fail. The core market takeaway is that this is a distribution-widening event: it lifts the probability of an energy and shipping shock (tail risk), while simultaneously increasing U.S. bargaining leverage that can compress risk premia quickly if diplomacy progresses. In practice, that combination tends to keep crude and gold supported on dips, forces equities into more fragile breadth and higher hedging demand, and makes USD and JPY behavior more state-dependent (risk-off vs rate-differential).
What happened and why it matters now
U.S. officials indicated the Pentagon has told a second carrier strike group to prepare for potential deployment to the Middle East amid rising tensions with Iran, with the USS George H.W. Bush identified as a likely candidate to join the USS Abraham Lincoln, which is already in the region. Reporting emphasizes that a formal deployment order could come quickly if negotiations break down, and notes that the broader reinforcement includes warships, fighter squadrons, and air defenses—signaling that Washington is actively expanding operational optionality rather than merely posturing.
The strategic significance is not “two carriers equals war tomorrow.” It is that the U.S. is building the capability for a sustained air and maritime campaign and for stronger defense against Iranian retaliation options (missiles, drones, proxies, and maritime harassment). That is exactly the type of posture shift that markets translate into a higher probability of disruption in the Gulf—even if the baseline remains diplomacy—because it shortens decision timelines and increases the chance of miscalculation.
Market reaction and positioning signal
The cleanest market variable tied to Iran escalation risk is front-end crude risk premium, because the first repricing is typically “insurance” (volatility and near-dated contracts) before it becomes a sustained move in the strip. The broader signal for cross-asset positioning is whether the market treats this as a “headline scare” (brief oil pop, equities fade then recover) or as a genuine tail (oil up with persistent bid, gold supported, equity breadth deteriorating, and hedges priced higher). At this stage, the posture implies elevated headline sensitivity: a credible diplomatic update can quickly compress premium, but any operational marker—naval incident, interdiction cycle, proxy attack—tends to re-inflate it abruptly.
The reason the signal is asymmetric is structural chokepoint risk. In 2024, oil flow through the Strait of Hormuz averaged ~20 million barrels/day, about 20% of global petroleum liquids consumption, which is why even partial disruption risk (insurance costs, rerouting, slower transit) can move prices without a full closure.
Macro transmission mechanism
This event transmits through the energy–inflation–financial conditions chain. If escalation risk lifts crude and shipping premia, near-term inflation expectations rise, real rates can become unstable, and central banks become more constrained—tightening financial conditions even without policy rate changes. That tightening then feeds into equity multiples (especially long duration), credit spreads, and risk appetite. Conversely, if diplomacy is credible, the same mechanism works in reverse: oil premium compresses, inflation tails soften, and equities can re-rate—often quickly—because the market removes the need for “war insurance” embedded in prices.
The second transmission channel is safe-haven sequencing. In the first phase of a shock, USD liquidity and volatility hedges often get bid; in the second phase, gold’s role strengthens if the market begins to price policy constraints and longer-run uncertainty. That sequencing is why gold can initially wobble during a dollar squeeze but then outperform if the episode becomes a sustained geopolitical/energy risk premium.
Political and fiscal implications
Politically, deploying or preparing additional carriers is a credibility signal to allies and adversaries, but it also raises domestic constraints: if oil rises, the inflation impulse becomes a first-order political variable, tightening the administration’s room to maneuver and increasing the incentive to secure a deal that stabilizes energy prices. Internationally, this posture interacts with Israel’s threat perceptions and escalation incentives; recent leader-level engagement underscores that Washington is balancing deterrence, diplomacy, and alliance management simultaneously—an inherently unstable mix that markets treat as tail-heavy.
On fiscal mechanics, escalation tends to steepen the distribution for U.S. spending (defense and security outlays) while also increasing the probability of higher term premium if investors expect persistent geopolitical risk and supply-chain/energy inflation effects. That doesn’t mean deficits change overnight, but it does mean the market can demand more compensation for uncertainty in the long end, particularly if the conflict risks look prolonged rather than episodic.
Strategic forecast: base case and pivot points
The base case for the next 2–6 weeks is managed escalation: a visible U.S. military option set coexists with diplomacy, producing headline-driven swings without immediate kinetic action. In that regime, oil keeps a modest geopolitical floor, gold remains supported, and equities are more likely to be choppy with internal rotation than to trend cleanly higher.
The upside path is credible diplomacy that reduces near-term Gulf disruption risk—either via a framework understanding or clear de-escalatory steps at sea. That scenario compresses front-end oil volatility first, then supports equities via lower inflation tail risk and improved risk sentiment. The downside path is miscalculation or cascade: a shipping incident, proxy strike, or rapid move that forces U.S. kinetic response. Because Hormuz is so systemically important to oil flows, even limited disruption risk can quickly reprice global inflation assumptions and tighten financial conditions.
Asset impact section
XAUUSD (Gold)
Gold should be treated as the cleanest hedge for a fat-tail geopolitical distribution. In the base case of managed escalation, gold tends to stay supported because the market maintains insurance against a shock that would constrain central banks through higher energy inflation. In the upside diplomacy scenario, gold can pull back tactically as risk premia compress, but the pullback often stabilizes if broader uncertainty persists. In the downside escalation scenario, gold typically benefits—unless the first impulse is a violent dollar liquidity squeeze, in which case gold can briefly chop before reasserting as the conflict/inflation-constraint narrative dominates.
S&P 500
The S&P’s sensitivity runs through oil and discount rates. Higher crude functions like a tax on consumers and margins, and it raises inflation tails that can keep policy tighter for longer, pressuring multiples. Expect dispersion: energy and defense tend to outperform on risk premium, while consumer discretionary and long-duration growth underperform when inflation constraints dominate. In the diplomacy upside, equities can rally quickly because the market removes tail insurance, but the durability of that rally depends on whether oil volatility stays compressed.
Dow Jones
The Dow often looks more resilient early in geopolitical episodes because its composition is less duration-sensitive than the Nasdaq and more exposed to industrial and “real economy” cash flows. That said, sustained oil-driven inflation risk still pressures cyclicals through tighter financial conditions. So the Dow’s advantage is usually relative (outperforming) rather than absolute (immune), unless diplomacy restores a stable growth-and-disinflation narrative.
USDJPY
USDJPY is likely to stay two-way and volatility-sensitive. A pure risk-off spike can strengthen JPY through de-risking and carry unwind, pushing USDJPY lower. But if the market interprets the shock as inflationary and U.S. yields rise relative to Japan, USDJPY can rebound sharply. This is the classic environment where rate differentials fight safe-haven flows, producing whipsaws rather than clean trends.
DXY
DXY’s reaction is typically mixed but often positive in acute stress because USD liquidity is the global default hedge. The composition matters: DXY is heavily weighted toward EUR and JPY, so if Europe is perceived as more energy-vulnerable, EUR weakness can mechanically lift DXY. For reference, the standard DXY basket weights include euro at 57.6% and yen at 13.6%, which is why “EUR shock” often looks like “USD strength” in DXY even when the dollar isn’t uniformly strong across all pairs.
Crude Oil
Crude is the fulcrum. The market is pricing not only supply but also the probability-weighted cost of disruption through Hormuz, where volumes are large enough that even partial disruption risk matters. In the base case, oil carries a premium and a bid to front-end volatility. In the upside diplomacy case, that premium compresses quickly. In the downside case, oil can gap higher because the market must reprice disruption probabilities rapidly, and because the insurance channel (options, inventories, freight/insurance) transmits faster than physical supply changes.
Closing synthesis
The core message is that a second carrier spin-up is a tail-risk amplifier and a negotiating leverage signal at the same time. That duality is why markets will likely remain headline-driven: oil and gold should keep a structural bid until diplomacy proves durable, while equities remain vulnerable to breadth deterioration and higher hedging demand when crude volatility rises. The most reliable real-time tells are the front end of the oil curve (risk premium), the persistence of gold’s bid relative to real yields, and whether USD strength appears as a genuine global bid or primarily as EUR weakness reflected through DXY’s heavy euro weighting.
MICROSOFT (MSFT) Market update, Weekly Insight.Fundamental Analysis:
As of today, Microsoft shares are valued are at 404.37, the company market cap stands at 3.09T, with a P/E ratio of 25.30 and dividend yield of 84.1%. an announcement was made on Wednesday that top security leader Charlie Bell will take on a new role, and that Hayete Gallot will return to the company to run security after a stint at Google. this could be a robust growth to the company, as we look forward to the outcome of this change.
Technical Analysis:
This weekly chart clearly shows a significant buying moment in respect of the structure, the overall market view displays uptrend formation, as price is almost at the weekly trendline demand zone.
42-43% of analysts recommend a strong buy, also 55% recommend buy. for the meantime, we keep a close eye on the market and see how it plays out.
Thanks for reading.
Gold May Consolidate Around 5,060–5,100📊 Market Overview:
Gold is currently trading around 5,060–5,085 USD/oz after being rejected near the 5,120 zone during the US session. A mild recovery in the USD and rising bond yields triggered profit-taking, while safe-haven flows are still keeping gold above the 5,000 psychological level.
📉 Technical Analysis:
• Key Resistance: 5,100 – 5,130
• Nearest Support: 5,050 – 5,000
• EMA: Price remains above EMA 09 → overall bullish trend.
• Candlestick / Volume / Momentum: Doji and pin bar candles indicate indecision, declining volume suggests consolidation, RSI is neutral (50–60) showing weak momentum.
📌 Outlook:
Gold may consolidate or slightly pull back in the short term if the USD continues to recover. A breakout above 5,100 could resume strong bullish momentum.
________________________________________
💡 Suggested Trading Strategy:
🔻 SELL XAU/USD: 5,120 – 5,123
🎯 TP: 40 / 80 / 200 pips
🛑 SL: 5,127
🔺 BUY XAU/USD: 5,053 – 5,050
🎯 TP: 40 / 80 / 200 pips
🛑 SL: 5,046
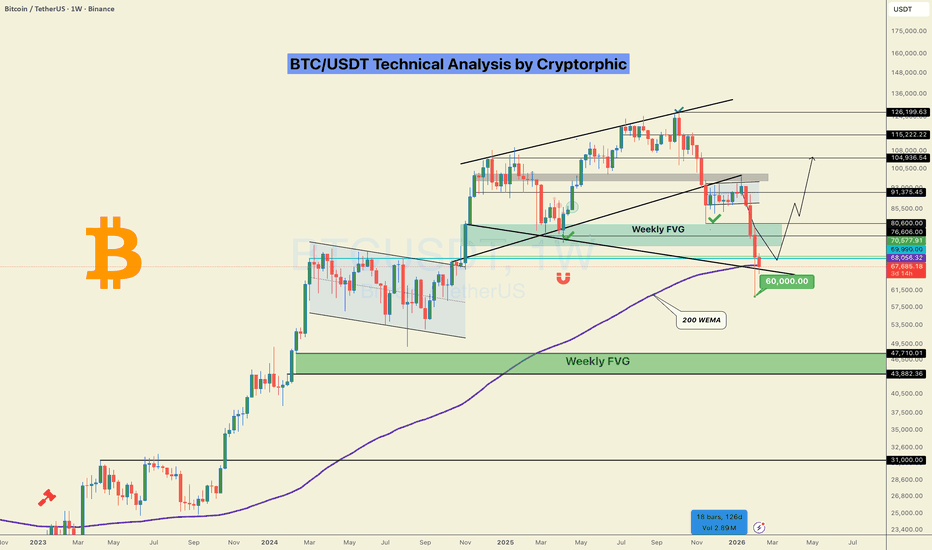
#BTC/USDT Weekly Technical Analysis. Will 200EMA Save the day?Bitcoin has broken down from the rising channel and is now sitting on a major confluence zone: weekly FVG and 200-week EMA around 70K–76K. This is a critical demand area.
Key levels
Support: 60K – 66.5K
Invalidation: weekly close below 66.5K
Recent weekly candles show aggressive sell-side expansion into long-term support. We saw a strong impulsive red candle breaking structure, followed by long lower wicks below 70K, showing buying absorption. The latest candle is sitting on the 200-WEMA, suggesting selling pressure is slowing.
The price might just be forming a higher-timeframe base here before the next impulsive move.
A breakdown below 66K would open the door to the next weekly FVG at 43K–48K.
Bias
This looks like a higher-timeframe correction, not a bear market. Smart money typically accumulates in this zone.
If you find this helpful , follow me and please hit the like button.
Do share your views in the comments.
Thank you
PEACE


