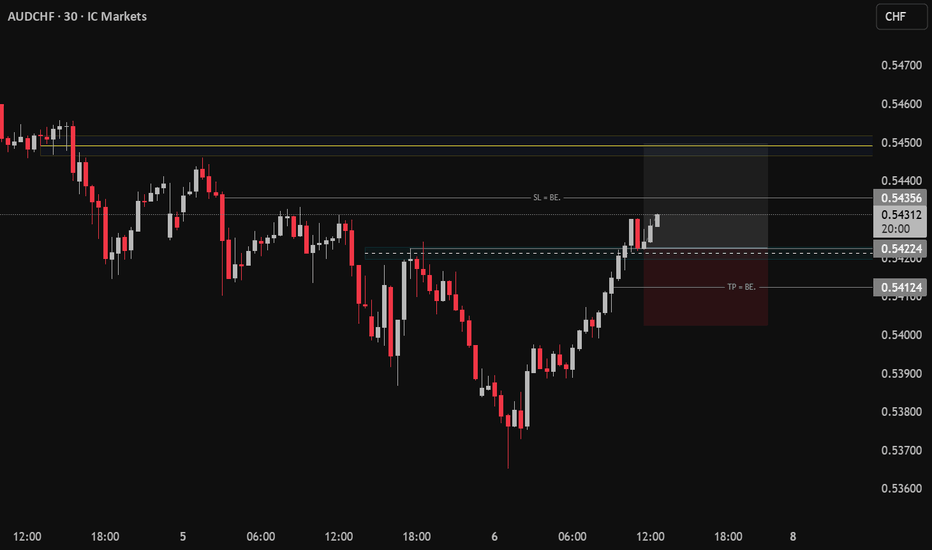
EURUSD Breakout and Potential Retrace!Hey Traders, in today's trading session we are monitoring EURUSD for a buying opportunity around 1.18000 zone, EURUSD was trading in a downtrend and successfully managed to break it out. Currently is in a correction phase in which it is approaching the retrace area at 1.18000 support and resistance area.
Trade safe, Joe.
Beyond Technical Analysis
SILVER | Strong Dollar and Profit-Taking Trigger SelloffSILVER | Speculators Retreat as Strong Dollar Pressures Metals
Silver fell sharply as speculators took profits following a short-lived recovery rally. A stronger U.S. dollar and easing geopolitical tensions added further pressure on precious metals, with silver TVC:SILVER dropping more than 11%, highlighting ongoing extreme volatility in the market.
The recent price action reflects a market still searching for equilibrium after the historic swings seen in recent sessions.
Technical Outlook
Silver maintains a bearish structure while trading below the 80.13 pivot.
As long as price remains below 80.13, downside pressure is expected toward 71.38, followed by 66.62.
A 1H candle close above 80.13 would signal a bullish corrective move toward 83.28, with further upside toward 85.40.
Key Levels
• Pivot: 80.13
• Support: 71.38 – 66.62
• Resistance: 83.28 – 85.40
ES (SPX, SPY) Analysis, Key-Zones, Setup for Fri (Feb 6)Yesterday was rough for tech with Nasdaq dropping over 1.3% after GOOGL's capex guidance spooked the market. MSFT down nearly 5% didn't help either. But overnight we got some relief - Amazon announcing $200B in AI infrastructure spending gave futures a decent lift. VIX pulled back from the 21+ levels which is helping stabilize things a bit.
ES bounced off the 6820 area and pushed back up toward the prior range. We're currently sitting around the 6850-6860 zone which is right at VWAP and the prior day's equilibrium. The bounce looks corrective so far rather than impulsive.
Forecast:
- Overnight: Choppy consolidation with slight upward drift
- Morning Session: Expecting a push into 6865-6875 resistance zone
- Afternoon: Likely fade if rejection at resistance holds
- Daily Close: Targeting below 6850 if short setup triggers
- Expected Range: 6825 to 6890
- Most Likely Path: Grind up into 6865-6875, find sellers, mean revert back toward 6840-6825
Friday Events:
- Pre-market: Watching for continuation of tech bounce
- Morning: Jobs data aftermath still influencing sentiment
- VIX: Currently around 20 - elevated but cooling
- After the bell: Light earnings calendar
Resistance:
- 6960-7005 – Major resistance, 7005 is the RTH High from earlier this week
- 6900-6920 – Upper resistance zone, would need strong momentum to reach
- 6880-6890 – Secondary resistance, this is where the short thesis gets invalidated
- 6865-6875 – Primary zone of interest, entry zone for mean reversion short
Support:
- 6845-6840 – First support and T1 target for shorts
- 6825-6835 – T2 target zone, prior support area
- 6800-6820 – Major support and T3, this is the key level bulls need to hold
- 6760-6780 – Deep support, only in play if 6800 breaks
Critical Level:
- 6850 – VWAP and equilibrium pivot, the line in the sand for intraday bias
Strategic Bias - Mean Reversion Short:
The setup here is a mean reversion short looking for a fade off the 6865-6875 resistance zone. Here's the thinking:
- Structure: The 1H chart shows a lower high pattern forming. Yesterday's selloff created a clear supply zone in the 6865-6890 area. The overnight bounce looks like a retracement into that supply rather than a trend reversal.
- Context: Despite the bounce, the broader picture still shows weakness. Tech got hit hard and one Amazon headline doesn't fix the GOOGL/MSFT damage. Buyers need to prove themselves above 6880 for me to flip bullish.
- The Play: Looking for price to push into 6865-6875 and show rejection (wicks, failed breakout, momentum divergence). If we get that, the trade is short targeting VWAP at 6850 first, then 6840, with a runner toward 6825.
- Risk: Stop above 6881. If price closes above that level with momentum, the lower high thesis is dead and shorts need to step aside.
- Invalidation: A strong push through 6890 with follow-through would shift bias to neutral/bullish and open up a run toward 6920+.
How I'm seeing it:
- Bearish bias below 6880, looking for mean reversion short at 6865-6875
- First target is VWAP at 6850, then 6840, extended target 6825
- If 6881 breaks with conviction, step aside - bulls taking control
- Below 6800 would confirm broader weakness and open 6760-6780
The overnight bounce gave us a setup. Now it's about waiting for price to reach the zone and show its hand. No need to chase - let the trade come to us.
Good Luck !!!
GOLD | Fed Caution and Strong Dollar Pressure PricesGOLD | Dollar Strength and Fed Caution Weigh on Prices
Gold fell toward $4,800 per ounce, ending a short recovery as the U.S. dollar strengthened after the Federal Reserve signaled caution on rate cuts. Fed Governor Lisa Cook emphasized persistent inflation risks, while the nomination of Kevin Warsh as the next Fed Chair reinforced expectations of a slower easing cycle.
Mixed U.S. data added to volatility, with weak ADP employment but a stronger ISM services PMI, while U.S.–Iran tensions continue to provide an underlying risk backdrop.
Technical Outlook
Gold maintains a bearish structure while trading below the 4853–4891 zone.
As long as price remains below this zone, downside pressure is expected toward 4762, followed by 4674 and 4610.
A 1H candle close above 4891 would invalidate the bearish bias and support a recovery toward 4974 and 5098.
⚠️ Expect high volatility in both directions.
Key Levels
• Pivot: 4853
• Support: 4763 – 4675 – 4610
• Resistance: 4891 – 4975 – 5020
Litecoin: potential bounce or deeper drop? key levels to watchLitecoin. Catching the falling knife or loading a discount alt bluechip here? While the whole crypto market just got washed out on fresh regulatory noise and another wave of BTC volatility, LTC dumped into multi‑month lows and finally printed a nasty but promising wick from the 44–45 area. According to market chatter, majors are seeing rotation back in as panic cools off.
On the 4H chart price bounced to 52–53 after a vertical selloff, RSI was buried under 30 and is curling up, and there’s a clear volume gap above current levels. I’m leaning toward a relief rally: first magnet for me is the 57–58 zone, then stronger supply around 60–62 where the big volume shelf starts. Trend is still bearish overall, so I treat this as a counter‑trend squeeze, not a new bull market… yet. I might be wrong, but dead cats usually bounce higher than this.
My base plan: ✅ look for longs only while price holds above 50–51, targeting 57–58 and possibly 60–62 if momentum stays hot. ⚠️ If 50 gives way again, I expect sellers to drag LTC back to 45–46 and maybe sweep that spike low. I’m stalking a small long on dips toward 51 with stops tucked below 49, and I’ll happily flip bias if we lose that support with volume.
The Ghost Setup"I’m a buyer at $36,000 because Bitcoin has broken a double Head and Shoulders pattern (often called a 'Ghost Pattern'). By projecting the depth of this pattern, the price target lands right around that level, where I expect it to find a bottom.
Of course, once it reaches this point, I’ll be looking for buyer exhaustion and signs of support before entering.
Not financial advice.
xagusd Silver / USD)Big picture
Structure is still bearish from the left side: clear lower highs, heavy sell-off, then a sharp capitulation drop.
The bounce from the lows looks corrective, not impulsive. That matters.
What price is doing now
Price is compressing around ~74.10–74.30, basically chopping sideways.
This is a classic bearish consolidation after a strong dump.
Momentum has cooled, but buyers aren’t strong enough to reclaim key levels yet.
Key levels (the important part)
Immediate resistance
74.80 – 75.20 → first supply shelf
75.90 – 76.50 → major rejection zone (stacked resistance above)
If price pushes into these and stalls → sellers likely reload.
Support
73.30 → local demand / range floor
71.90 – 72.00 → last strong bounce area
Lose 71.90 cleanly → downside continuation is very much alive.
SPX500 | Futures Rebound After AI-Driven SelloffSPX500 | Futures Rebound as AI Selloff Triggers Market Repricing
U.S. equity futures rebounded after steep losses, as markets reassessed the recent AI-driven selloff that wiped nearly $1 trillion from the S&P 500 software and services sector. Investors are shifting from broad enthusiasm toward a more selective approach, focusing on winners and losers of the AI revolution rather than assuming all tech will benefit.
This evolving market dynamic suggests rising sector dispersion and continued volatility across equities.
Technical Outlook
The index dropped 2.6%, falling from 6940 to 6745 as previously outlined.
As long as price remains below the 6858 pivot, bearish pressure is expected toward 6820 and 6798.
A break below 6798 would extend losses toward 6771 and 6715.
A 1H candle close above 6858 would support a recovery toward 6877 and 6900.
Key Levels
• Pivot: 6858
• Support: 6798 – 6771 – 6713
• Resistance: 6877 – 6918 – 6940
The Elephant Jungle 2/6/26 Page 6On the 15m, market structure flipped bullish and kicked off a demand chain.
Sounds good… but don’t get comfortable.
Price is already struggling to break structure again, which tells me one thing, this move needs confirmation, not hope. Yeah, there might be a long here, but I’m not touching it without checking the lower timeframes.
The 5m, 3m, even the 1m, the lower timeframes Market Structure will tell the real story.
No guessing. No praying.
This is one of those days where the market looks friendly right before it decides who’s paying for lunch. So yeah, it’s going to be an interesting day, like always. Between structure, liquidity, and whatever News decides to drop out of nowhere, anything can happen.
As always:
Use proper risk management
Wait for your levels & confirmations
The Jungle rewards patience…
and it punishes impatience fast.
Stay safe out there.
Bitcoin’s Next Big Move: Pump to $105K or Dump Back to $69K?👉 Is BTC preparing for a mega-pump toward $105,000?
or
👉 Is this rally losing steam, ready to correct back toward $69,000?
🗳️ Cast Your Vote:
What’s your prediction?
🔥 Pump to $105K
💧 Dump toward $69K
Drop your vote in the comments ⬇️ — I’m tracking the sentiment.
🎁 Want to Predict & Earn?
I’m testing BTC prediction games directly inside Trust Wallet, and the rewards have been surprisingly solid.
If you want to try predictions or explore on-chain tools:
📣 Let’s see what the community thinks!
Comment PUMP or DUMP, and tell me why you think BTC is headed there.
I’ll share updated market analysis once voting stabilizes.
Software Repricing in the AI EraSummary thesis:
Software isn’t collapsing — it’s being repriced.
For much of the past decade, software outperformed on the back of SaaS models, seat-based expansion, and expanding valuation multiples. AI is now disrupting the monetization unit faster than it clarifies the new one. That uncertainty is driving terminal-value repricing, not a cyclical growth scare.
What the chart is saying:
IGV has broken its long-term trend and failed to reclaim it. That behavior is consistent with a valuation reset, even as company-level execution remains largely intact.
About the recent sell-off:
The last week showed panic-like selling (volatility spike, fear gauges moving sharply). Panic in a structural repricing typically produces relief rallies, not durable trend reversals.
Prediction:
Near term: high probability of a reflexive bounce off panic conditions.
Medium term: rallies are likely to fail below broken resistance as repricing continues.
Base-case path: continued digestion / underperformance with price discovery toward a 65–70 zone before a durable base can form.
Invalidation:
This view changes if IGV reclaims and holds its long-term trend on a weekly basis and relative strength vs broader tech stabilizes.
Bottom line:
This is not a crash. It’s a reset.
In the AI era, growth alone no longer guarantees multiple expansion — defensibility does.
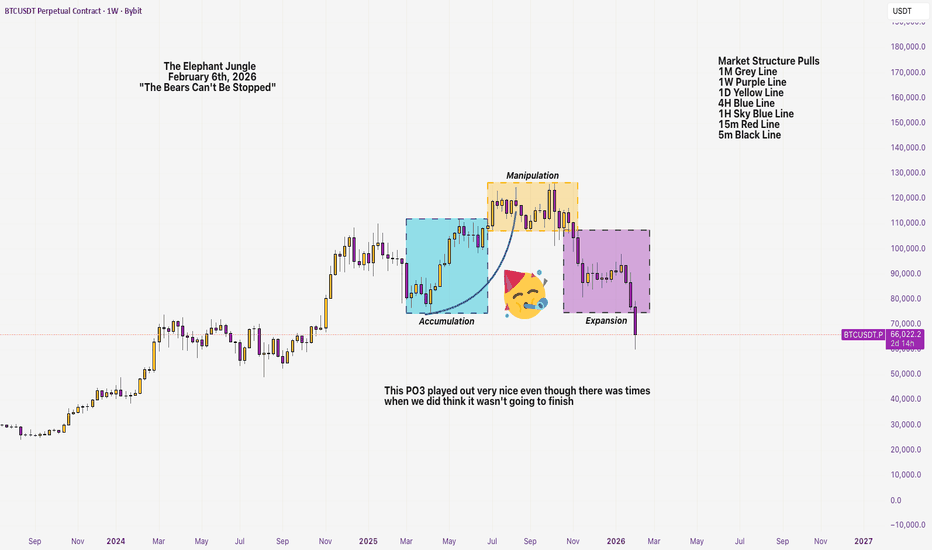
The Elephant Jungle 2/6/26 Page 5Right now, I’m watching for a long, a little ride up into the 4H Supply Range. But let’s not get reckless. There’s a 1H Supply Range sitting right in the way, and that’s a spot where I’ll happily take some money off the table… just in case the Bears decide they want to dump from there.
Because they might.
Now, if the Bulls are serious, I expect them to push through the 1H supply, sweep the liquidity trend, and then reject inside the 4H Supply Range. That’s the clean move.
If they’re really feeling themselves though..
Then they don’t stop there, they will sweep the liquidity curve and drive price straight into the 1W Supply Range.
Either way, my plan is simple, I’ll ride the Bulls on the way up… and the moment the Bears throw the signal, I’ll be switching sides like it’s halftime.
No loyalty in this Jungle, only signals.
Bitcoin in a corrective phase after the euphoriaOn this weekly BTC/USD chart, we observe a reversal structure following a strong uptrend in 2024–2025, marked by the break of the ascending channel and a clear rejection below the previous highs around $110,000–$120,000.
The price has now returned to test a key support zone around $62,000–$66,000, formerly an accumulation area and market pivot, making it a decisive level for the next moves. As long as this support holds, a technical rebound toward $75,000 remains possible, corresponding to a former intermediate resistance.
Conversely, a clear break of this zone would open the way to a deeper correction toward major lower supports around $30,000, or even the extreme zone near $18,000, corresponding to the previous cycle’s lows.
The current dynamics remain fragile: the market has moved from a phase of euphoria to a corrective phase, and only a sustained reclaim of $75,000–$80,000 would restore a medium-term bullish bias, while below $62,000, the bearish scenario would clearly dominate for the coming months.
BTC | The Calm Before the Dump... or Pump?Bitcoin is reacting from a key higher-timeframe point of interest (POI). Price has reached a high-probability FVG that broke structure to the downside with strong displacement — now forming a potential short-term ceiling.
Below, a notable sell-side liquidity pool sits near $74,558, offering a possible downside target if price continues to respect this daily FVG. Should that level give way, the next POI would be the marked bearish order block, with extended liquidity zones reaching toward the $52K region.
If both sell-side areas are taken out with strong momentum, it could confirm a deeper re-price phase before the next bullish leg.
Overall, we’re watching for how price responds within these key levels — structure will tell the story.
Disclaimer:
This analysis is for educational purposes only and does not constitute financial advice. Always do your own research (DYOR) before making any trading decisions.
The Elephant Jungle 2/6/26 Page 4On the 4H timeframe, the picture gets a lot clearer. The 4H Supply Range lines up perfectly as the next high probability short, especially with price rejecting off the Macro Range Low. That confluence alone makes this area worth paying attention to.
But if price blows through that 4H supply?
Then we’re likely looking at a liquidity sweep, one last push that runs stops and sucks in late buyers before price drives straight into the 1W Supply Range.
Same idea. Two outcomes.
Either the 4H supply holds and sellers step in,
or it fails, liquidity gets cleaned out, and higher timeframe supply does the real damage.
In this market, levels don’t fail quietly.
They fail violently, and only after taking liquidity with them.
The Elephant Jungle 2/6/26 Page 3With 13 hours left in the day, price is opening up bullish. Maybe, just maybe, the Bulls finally decide to show up. If they do, we could see a short term comeback, possibly even a clean test of the Macro Range Low. And if they’re really ’bout it, ’bout it like Master P, they might even take a swing at the 1W Supply Range.
But let’s be real.
This could just be London handing out a pullback, a clean little setup, so New York Bears can catch the alley-oop, slam price back down, and close the week out bearish. That’s how you get a slow, heavy weekend… and a lot of trapped Bulls. In this market, early strength doesn’t mean control. It means opportunity and not always for the Bulls.
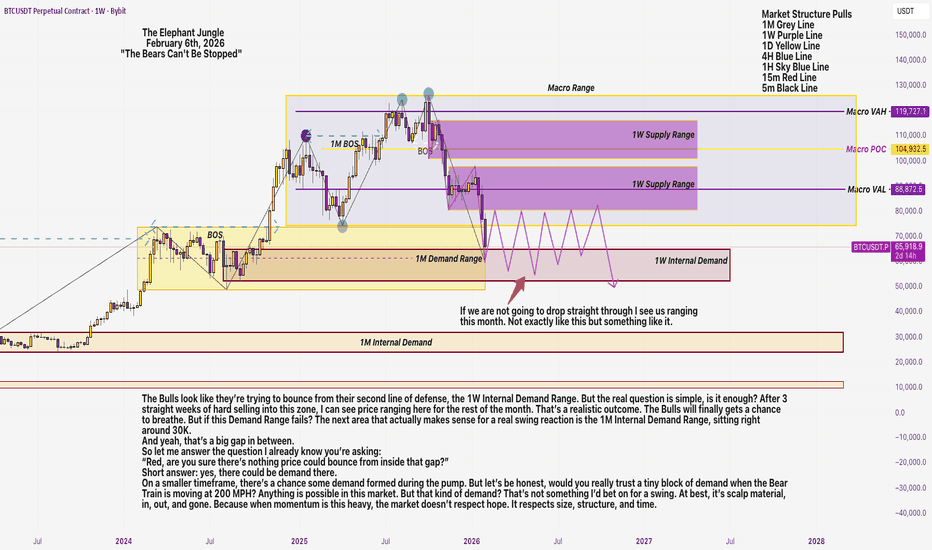
The Elephant Jungle 2/6/26 Page 2The Bulls look like they’re trying to bounce from their second line of defense, the 1W Internal Demand Range. But the real question is simple, is it enough? After 3 straight weeks of hard selling into this zone, I can see price ranging here for the rest of the month. That’s a realistic outcome. The Bulls will finally gets a chance to breathe. But if this Demand Range fails? The next area that actually makes sense for a real swing reaction is the 1M Internal Demand Range, sitting right around 30K.
And yeah, that’s a big gap in between.
So let me answer the question I already know you’re asking:
“Red, are you sure there’s nothing price could bounce from inside that gap?”
Short answer: yes, there could be demand there.
On a smaller timeframe, there’s a chance some demand formed during the pump. But let’s be honest, would you really trust a tiny block of demand when the Bear Train is moving at 200 MPH? Anything is possible in this market. But that kind of demand? That’s not something I’d bet on for a swing. At best, it’s scalp material, in, out, and gone. Because when momentum is this heavy, the market doesn’t respect hope. It respects size, structure, and time.


