XAUUSD - H4 - Update1. Trading volume (buy and sell) has reached a balance after 11 weeks. This balance at price peaks or troughs is often a sign of a potential trend reversal.
(Previously, buyers dominated and pushed prices up, but now equilibrium has been reached.)
2. Unfilled buy orders (marked levels on the chart), given the current resistance pressure, appear to be the most attractive and lowest-risk entry level.
3. The trend also seems to have additional confirmation.
Beyond Technical Analysis

Nikkei moves in a strong momentumNilkkei index is in play
The change in the political landscape and economic conditions creates a bullish pressure for Nikkei index, as now this market represents a perfect combination of monetary policy conditions (when the interest rate is increasing but is still very low compared to other counties), and internal fundamental factors (inflation in Japan starts rising consistently driven by the internal demand).
The momentum trade involves a possible breakout of a consolidation area or a continuation chart pattern on the way of a trend. The possible track is shown on the chart below.
Don't forget - this is just the idea, always do your own research and never forget to manage your risk!

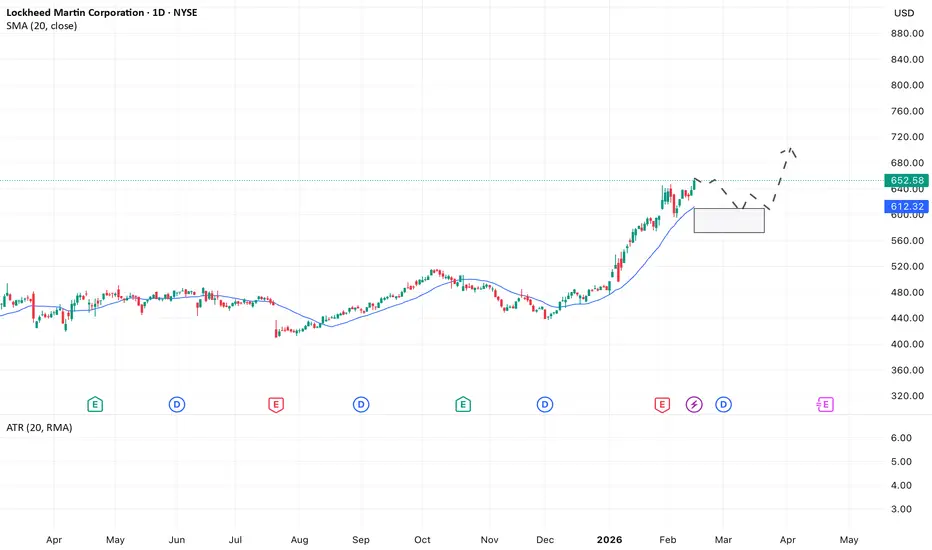
LMT is a medium-term opportunity for a momentum tradeLMT is in focus.
It is a textbook defensive industrial play. The core bullish thesis is the massive $160B+ backlog, providing exceptional revenue visibility regardless of the macro cycle. It’s a cash flow engine generating >$6B FCF/year, fueling aggressive buybacks and a solid ~2.6% yield. With low beta and exposure to high-tech Space infrastructure, it acts as a perfect portfolio stabilizer and consistent long-term compounder.
From a technical point of view, the price of LMT moves in the accelerating uptrend, and is located slightly above the dynamic support area (the area above 20 and 50 moving averages).
The decent trade location for a trend-following long trade would occur in the area between $550 and $600
Don't forget - this is just the idea, always do your own research and never forget to manage your risk!
Nasdaq Consolidates as AI Narrative ShiftsRecent Macro Headlines Driving Market Sentiment
Equity markets entered 2026 with strong momentum following a powerful fourth quarter rally in 2025. However, sentiment shifted quickly as specific developments began to challenge elevated expectations, particularly in the technology sector.
Late January earnings from major technology companies influenced market behavior. Microsoft issued guidance that pointed to moderating cloud growth as enterprise clients showed more disciplined spending. Alphabet reported softer advertising trends in select international markets. Apple cited uneven hardware demand in China, adding to concerns about global growth exposure. None of these updates signaled a collapse, but positioning had become crowded and expectations were high, which made the market vulnerable to disappointment.
Beyond earnings, artificial intelligence related narratives have had a meaningful impact on sentiment. Markets have been grappling with a shift in the AI story from pure growth catalyst to source of disruption risk. Software and service stocks exposed to AI disruption saw significant repricing after investors intensified concerns that fast advancing AI tools could materially undercut established subscription based models and enterprise revenue streams, driving some software leaders lower in early February. Analysts and traders have pointed to fears that automated AI agents could replace traditional enterprise software functions faster than expected, which pressured names across the S&P 500 Software & Services index. These concerns were amplified by heavy capital expenditure forecasts from hyperscale platforms and questions about when that investment will translate into sustainable profit growth.
Selloffs in sector specific ETFs linked to software and AI narratives have coincided with broader weakness in the technology complex, reflecting investor sensitivity to both the potential and limitations of artificial intelligence. At the same time, some analysts highlighted diverging views on the AI theme, with others arguing that fears about AI replacing core business functions may be overblown or driven more by sentiment than fundamentals.
At the same time, the latest CPI release on February 13 showed inflation cooling more than expected, with both headline and core readings moderating from the prior month. While this helped ease immediate inflation concerns, the labor market has remained resilient, keeping the Federal Reserve cautious about signaling aggressive rate cuts. Treasury yields have remained volatile as markets recalibrate the timing and pace of easing rather than pricing a straight line move lower. Long duration growth stocks experienced two way trade during this repricing, and the Nasdaq Composite, which had led the 2025 rally, saw increased volatility as traders adjusted exposure to high multiple technology names.
What the Market Has Done
Since the start of 2026, the market attempted higher to revisit all time highs at the end of January but failed, and sellers responded and offered prices down back to 25500 (Daily level 1), where buyers previously were able to defend since mid December 2025.
An attempt was made by buyers on February 2 to bid prices back up again from this level 25500, but it was not sustained. As technology earnings reactions and rising yields weighed on sentiment, this failure invited additional supply.
This triggered a long liquidation as the market broke below 25500 and swept down to 24250 (Daily support), where buyers have defended since October 2025.
Buyers have since stepped in and the market was able to rotate back up to 25500, Daily level 1.
In the past week, sellers held offers in the 25500 area and price rotated back down through the current range between 25500 and 24500, marking Daily level 1 and Daily support respectively.
The inability to reclaim Daily level 1 on the first bounce suggests that supply remains active near the top of the range, particularly as macro uncertainty persists.
What to Expect in the Coming Weeks
Key levels to watch are 25500, Daily level 1, and 24500, Daily support.
Neutral Scenario
Expect a two way market within the current range of 25500 and 24500 as markets attempt to re-establish value.
Clues that the market is preparing for a directional move would include range compression and volume skewed to one side of the range.
Watch how weekly VPOC develops within the range and whether weekly value begins migrating higher or lower.
Bullish Scenario
• If buyers are able to hold bids above 25000, which is the midpoint of the current range, this would be an early clue that the bullish scenario may be developing.
• A break above and acceptance above 25500 would confirm this thesis.
• In that case, expect a move toward 26200, which aligns with Daily resistance and the October 27 weekly VAH.
Bearish Scenario
• If sellers step down offers within the range and hold prices below 25000, this would be an early clue that sellers are gaining control.
• If buyers fail to defend 24500 and bids begin slipping, expect a move down through the August 2025 consolidation range.
• The next downside objective would be 23500, which marks the next Daily support and aligns with prior balance structure.
Conclusion
The Nasdaq is currently balanced between Daily level 1 at 25500 and Daily support at 24500, reflecting a market that is rotating rather than trending. Technically, the failure to revisit ATHs and the inability to achieve acceptance above 25500 signal responsive sellers at the upper end of the range, while repeated defenses of 24500 show that buyers are still active at lower references.
Fundamentally, the backdrop has become more nuanced. Earnings guidance from mega cap technology firms has tempered expectations, while the AI narrative has shifted from pure optimism to a more measured debate around capital expenditure intensity, margin impact, and the timeline for monetization. At the same time, rate expectations remain fluid as markets recalibrate the pace of Federal Reserve easing against a resilient labor market. This combination of earnings recalibration, AI repricing, and shifting rate expectations has reduced risk appetite and reinforced the current balance structure.
A sustained move will likely require alignment between order flow and macro catalysts. Stabilizing yields and renewed confidence in AI driven earnings growth could support acceptance above 25500 and open the path toward higher resistance. Conversely, continued rate repricing or further margin concerns tied to AI spending could pressure 24500 and expose lower daily supports.
As always, let price at key references confirm the narrative rather than assuming it.
Are you seeing initiative activity building at the edges of this range? Please feel free to leave a comment and give a boost so that more people can join in the conversation.
Disclaimer: This is not financial advice. Analysis is for educational purposes only; trade your own plan and manage risk.
Acronyms:
C - Composite
w - Weekly
m - Monthly
VAH - Value Area High
VAL - Value Area Low
VPOC - Volume Point of Control
LVN - Low Value Node
HVN - High Value Node
LVA - Low Value Area
SP - Single print
ATH - All time high

breakout below 4985 sell#XAUUSD price await valid breakout below 4985,83 to sell, below there it will drop till 4945.
Sell limit 4985,83 valid breakout, target 4945, SL 5000.
If price reject from 4973 with wick then expect buy till 5010 up.

sell point - supply zone 1.36950 trendlineRelated Information:!!! (gbp/usd )
ING strategist Francesco Pesole points to an event-heavy UK data docket, with upcoming employment and inflation releases expected to reinforce evidence of a cooling labour market and persistently muted core services inflation. Should these dynamics carry through into the March readings, expectations for a policy easing by the Bank of England would strengthen materially.
Against this backdrop, heightened political fragility surrounding Prime Minister Keir Starmer further compounds downside risks for Sterling. ING therefore maintains a constructive stance on EUR/GBP, projecting a move toward the 0.88 area as the Pound remains vulnerable to episodic depreciation pressures.
Looking ahead, the January labour market report due Tuesday is anticipated to show further slackening in employment conditions alongside a moderation in annual wage growth. A continuation of these trends would significantly increase the likelihood of a BoE rate cut as early as next month.
personal opinion:!!!
Moving within two trend lines, touching the upper trendline and correcting, the market is stabilizing.
Important price zone to consider : !!!
Resistance zone point: 1.36950 zone
Support zone point : 1.36250 zone
technical analysis : !!!
3 EMA moving averages, price trading above --> supports an uptrend.
Trading volume is stable and accumulating.
Follow us for the most accurate gold price trends.

great opportunity to buy an hold.Solano is at a great key level to enter. The price has a reversal channel on the weekly chart. The price is at the weekly key level. You can see that the Stoch. is giving a reversal signal. It's not 100% certain that the price will explode upwards now, but this is a great key level to buy more and hold until the run returns.

USDJPY LONG VIEW!!World shares steadied on Monday after Friday's drop triggered by AI-related concerns as the Lunar New Year holiday in Asia and President's Day in the U.S. made for thin trading.
China, South Korea, Taiwan were among the markets that were closed, while MSCI's broadest index of world shares rose 0.1% EURONEXT:IACWI, as currencies and bonds steadied.


Triangle on USDJPY · H4We are at a critical stage. Wave mapping inside the triangle has limited practical value — this is a classic consolidation phase. Volatility is contracting, and the market is building pressure ⚡
The primary opportunity will emerge after a breakout from the formation.
Key observation 👇
The lower boundary of the triangle has held multiple times.
🐻 Sellers failed to push through support, with each attempt followed by buying interest. From a technical perspective, this strengthens the probability of an upward move 📈
Triangles typically develop in five waves.
At the moment, four waves are visible, which increases the likelihood of a fifth wave to the upside within the structure 🚀
Tactical approach:
✔ Potential setup from the lower boundary
✔ Tight stop (structure-based logic)
✔ Attractive R:R profile = 1:2 / 1:3 upon entry confirmation 💰
The focus is not the triangle itself, but how price behaves at its boundaries.

Adobe $ADBE Coiling Above Support — Bullish Break This Week?:Current Price: 263.97
Direction: LONG
Confidence level: 62%(Professional trader insights lean cautiously bullish with price holding above key moving averages, while social sentiment is thin but not aggressively negative. Mixed signals reduce confidence, but structure favors a short-term upside attempt.)
Targets
Target 1: 270.00
Target 2: 276.00
Stop Levels
Stop 1: 258.00
Stop 2: 254.00
Wisdom of Professional Traders:
This analysis pulls together the collective insight of professional traders and market experts who’ve discussed Adobe across multiple long‑form breakdowns. When I step back and look at the crowd wisdom, the consistent theme is resilience. Several traders emphasized that Adobe is deeply embedded in professional workflows, which gives it a buffer even as AI shakes up the software space. While short‑term pressure exists, the broader trader mindset leans toward upside if price holds key levels.
Key Insights:
Here’s what’s driving this setup. Multiple traders acknowledged that Adobe has been dragged down with the broader SaaS sell‑off tied to AI fears. That’s the overhang. But at the same time, several traders pushed back on the idea that AI replaces Adobe outright. Instead, they see Adobe as one of the platforms most capable of integrating AI into existing workflows, not losing them.
What caught my attention is where price is sitting. We’re just above the 50‑day EMA and well above the 200‑day EMA. Traders often look for longs when a stock survives bad narratives without breaking major structure. That’s exactly what’s happening here. Momentum indicators turning up reinforce that view for a short‑term trade.
Recent Performance:
Adobe has been grinding sideways after bouncing off the low $250s, trading around $264 with a modest uptick over the last session. Volume hasn’t exploded, but it hasn’t dried up either. That kind of action usually signals digestion rather than distribution. The fact that price reclaimed and held the 50‑day EMA is something traders are watching closely this week.
Expert Analysis:
Several professional traders I tracked framed Adobe as a “show‑me” stock rather than a broken one. Yes, it’s been hit, and yes, execution matters. But the consensus tone was that downside momentum has cooled for now. From a chart perspective, RSI sitting near the upper‑50s and a MACD histogram flipping positive suggest buyers are slowly regaining control.
There’s disagreement, and that’s why confidence isn’t high. Social chatter includes skeptics focused on AI disruption. Still, when price refuses to roll over near support, traders tend to lean long for a bounce rather than press shorts.
News Impact:
Recent headlines around Firefly AI adoption and deeper cloud partnerships add a supportive backdrop, even if they aren’t immediate catalysts. The bigger event is March earnings, but ahead of that, traders often position for a relief move if nothing breaks. The absence of fresh negative news this week matters more than flashy announcements.
Trading Recommendation:
Putting it all together, I’m going LONG Adobe for a short‑term trade this week. I’m looking for a push toward $270 first, with $276 as a stretch if momentum builds. Risk is clearly defined below $258, and I’m out completely if $254 fails. This isn’t a conviction swing trade — it’s a tactical long based on price holding structure while sentiment slowly improves.

XBI Biotech ETF testing support as bearish trader signals dominCurrent Price: 122.86
Direction: SHORT
Confidence level: 48%(Several professional traders explicitly described XBI as being on the bearish side, while social data is limited and lacks conviction, leading to a moderate-low confidence short bias.)
Targets
Target 1: 120.90
Target 2: 118.75
Stop Levels
Stop 1: 125.15
Stop 2: 126.80
Wisdom of Professional Traders:
This analysis pulls together the collective insight of professional traders and market experts who actively trade sector ETFs. When several traders independently flag the same ETF as being on the bearish side of the market, that crowd wisdom matters. The core trader snippet explicitly grouped XBI alongside other ETFs described as “very bearish,” which is a strong directional statement even without detailed targets. Historically, when traders frame an ETF this way, downside follow-through often appears within the same week.
Key Insights:
Here’s what’s driving this setup. Multiple professional traders are currently categorizing XBI as part of the weak ETF basket, and that language is decisive. They aren’t saying “wait and see” or “range-bound”; they’re calling out the bearish side of the market. That alone tilts the bias lower, especially given that XBI is trading below its 20‑day and 50‑day EMAs.
What caught my attention is where price sits. XBI is hovering just above the $122.5 support zone. When traders label something bearish while it’s sitting on support, the usual playbook is a support test or a clean break. If that level fails, downside momentum tends to accelerate quickly because short-term longs exit and short sellers press.
Recent Performance:
XBI closed at $122.86, down slightly on the session, and has been drifting lower over recent days rather than bouncing aggressively. Volume is close to average, which tells me sellers are present but not exhausted yet. This kind of slow bleed near support often resolves lower within the same week rather than snapping sharply higher.
Expert Analysis:
Several professional traders are highlighting negative momentum signals across sector ETFs, with XBI repeatedly mentioned in that bearish grouping. Technically, price is below key moving averages and the MACD has rolled over, reinforcing the downside bias. A few market experts are also pointing out that failed rebounds toward the $125 area are attracting sellers rather than buyers.
On the social side, X chatter is light and lacks conviction. That doesn’t help the bulls. When trader commentary is bearish and social momentum is weak, I usually defer to the professionals, especially for short-term trades.
News Impact:
Recent biotech funding headlines are constructive for the sector longer term, but they haven’t translated into immediate buying pressure in XBI. The market is more focused on rates, financing costs, and near-term risk appetite. Without a fresh FDA approval or major M&A headline this week, news flow isn’t strong enough to offset the bearish technical tone traders are seeing.
Trading Recommendation:
Here’s my take. I’m positioned SHORT on XBI for this week, looking for a break below $122.50 to open the door toward $120.90 first and potentially $118.75 if selling picks up. I’d keep risk tight with a stop above $125.15, and I’d fully step aside if price pushes through $126.80 because that would invalidate the bearish thesis. This is a tactical, short-term trade, not a long-term sector call.

Palantir at a Key Pivot: Momentum Points Higher This Week:Current Price: 131.41
Direction: LONG
Confidence level: 62%(Several professional traders describe recent weakness as corrective and highlight earnings snapback strength, while X sentiment leans optimistic. Signals are mixed but tilt upward, supporting a cautious long with defined risk.)
Targets
Target 1: 138.00
Target 2: 145.00
Stop Levels
Stop 1: 128.00
Stop 2: 124.00
Wisdom of Professional Traders:
This analysis synthesizes insights from thousands of professional traders and market experts, combining what traders are saying across platforms to spot good setups in Palantir Technologies Inc. When I step back and look at the collective trader analysis, the message isn’t perfectly aligned, but the balance of language and positioning leans upward. Several traders emphasized durability, post‑earnings snapback behavior, and confidence in Palantir’s longer‑term trajectory, which matters even for a short‑term trade.
Key Insights:
Here’s what’s driving this setup. Multiple professional traders highlighted a sharp earnings snapback and emphasized that Palantir continues to hold investor confidence despite sector volatility. That kind of reaction usually shows strong underlying demand. At the same time, traders acknowledged pressure across software names, but importantly, Palantir didn’t lose key support zones during that stress.
What caught my attention is how often traders framed recent weakness as corrective rather than the start of a breakdown. Language around “healthy pullbacks,” “snapbacks,” and “not going away” shows conviction. When traders talk that way, it usually means dips are being bought, not sold into.
Recent Performance:
This played out clearly in price action. Palantir traded between roughly $126 and $134 recently and closed around $131, staying above short‑term moving averages. Buyers defended the $126–$130 zone multiple times, and momentum indicators started turning up again. That’s classic basing behavior after a pullback.
Expert Analysis:
Several professional traders I tracked pointed out that valuation concerns aren’t driving short‑term decisions here. Instead, they’re focused on momentum, earnings reactions, and contract visibility. The consensus tone suggests Palantir is still viewed as a leader in applied AI for governments and enterprises, which keeps bids underneath the stock.
On the social side, X sentiment leaned more optimistic than cautious. Many active traders discussed upside toward the mid‑$130s and $140 area, framing the move as continuation rather than exhaustion. That alignment with the chart strengthens the long case for this week.
News Impact:
Recent news flow has been mixed but manageable. Regulatory headlines around government contracts created noise, yet price held firm. At the same time, ongoing discussion about AI partnerships and prior earnings strength continues to support the story. The market’s reaction matters more than the headlines, and so far, Palantir is holding up well.
Trading Recommendation:
Here’s my take. I’m positioning LONG while price holds above $128. The risk‑reward favors upside continuation toward $138 first, with $145 as an extension if momentum builds. I’d cut risk quickly on a loss of $128 and step aside entirely below $124. Confidence isn’t sky‑high because traders aren’t perfectly aligned, but the balance of evidence points higher from here.

Microsoft at $401: Oversold Support Zone Sets Up Bounce Play:Current Price: 401.32
Direction: LONG
Confidence level: 61%(Several professional traders identify the $392–$400 area as oversold support with bounce potential, while X sentiment is split but slightly favors dip-buying. Mixed signals reduce conviction but support a short-term long.)
Targets
Target 1: 410.00
Target 2: 423.00
Stop Levels
Stop 1: 395.00
Stop 2: 387.00
Wisdom of Professional Traders:
This analysis synthesizes insights from many professional traders and market experts, combining longer‑form technical breakdowns with fast‑moving market chatter. The collective wisdom here matters because several traders are independently pointing to the same zone: Microsoft sitting on a well‑defined support band after a sharp pullback. When different traders converge on similar levels, it usually means the market is paying attention.
Key Insights:
Here’s what’s driving this setup. Multiple professional traders describe Microsoft as short‑term bearish but stretched to the downside, with repeated references to oversold RSI and heavy distance below major moving averages. That combination often leads to at least a tradable bounce, even if the broader trend hasn’t flipped yet. The $392–$400 zone shows up again and again as a line buyers are willing to defend.
What’s interesting is that while traders remain cautious on the bigger picture, they also stress that Microsoft is now pricing in a lot of bad news. Several traders mention that when price holds above $392, short covering and dip‑buyers tend to step in quickly. That’s why I’m leaning long for a short‑term trade rather than chasing downside here.
Recent Performance:
Microsoft has fallen roughly 20%+ from recent highs and closed near $401 after briefly dipping below $400 earlier in the week. Volume picked up during the selloff, which tells me forced selling and de‑risking already happened. Over the last few sessions, price has started stabilizing around the same support band professional traders keep flagging.
Expert Analysis:
Traders I’m tracking consistently mention $400 as psychological support and $392 as the technical line in the sand. As long as price holds above that area, the odds favor a rebound toward the first resistance near $410. A few traders also highlighted $423 as the level that would confirm stabilization if tested this week, making it a logical second target.
On the momentum side, RSI readings in the low‑40s and declining MACD show weakness, but not acceleration. That often precedes sideways action or a bounce rather than another sharp leg down, especially after such a fast drawdown.
News Impact:
The news flow explains why sentiment is split. Regulatory scrutiny headlines and AI capex concerns pressured the stock, but earnings still showed solid revenue growth and institutional buying hasn’t disappeared. The market reacted first, asked questions later. For short‑term trading, that reaction has already pushed price into a zone where buyers historically show up.
Trading Recommendation:
Here’s my take. I’m favoring a LONG position near $401 with tight risk control, targeting a bounce toward $410 first and $423 if momentum builds. I’d keep stops disciplined below $395, with a hard exit if $387 breaks. This isn’t a long‑term call — it’s a short‑term support bounce based on what many professional traders are watching right now.

Intel at $46.79: Break Above $47.5 Sets Up a Short-Term Run:Current Price: 46.79
Direction: LONG
Confidence level: 62%(Several professional traders lean bullish with repeated focus on a $47.5 breakout, but volume confirmation is still pending, so conviction is moderate rather than high.)
Targets
Target 1: 48.50
Target 2: 50.00
Stop Levels
Stop 1: 45.50
Stop 2: 44.50
Wisdom of Professional Traders:
This analysis synthesizes insights from thousands of professional traders and market experts, combining what traders are saying across platforms to spot good setups. The collective wisdom here matters because when several traders independently focus on the same levels, those levels tend to drive short-term price action. In Intel’s case, the crowd is clearly focused on the $47.5–$48 area as the trigger point.
Key Insights:
Here’s what’s driving this setup. Several professional traders are framing Intel as a stock that’s holding above its 50-day and 200-day averages, which keeps the short-term trend pointed higher. The language across trader discussions leans toward “breakout if confirmed,” not aggressive chasing, but clear interest if price pushes through resistance with volume.
What caught my attention is how often the same levels repeat. Multiple traders pointed to $47.5 as the line that changes the story this week, while upside chatter clusters around $49 to $50 as the first real reaction zone. On the downside, traders consistently reference the mid-$45 area as the level that shouldn’t break if the bullish structure is intact.
Recent Performance:
This all showed up in the price action. Intel pushed from the mid-$45s toward the high $46s, staying above key moving averages and printing higher lows. Volume hasn’t exploded yet, which tells me this isn’t a crowded trade. It looks more like a coiled move waiting for confirmation rather than exhaustion.
Expert Analysis:
Looking at the trader consensus, several professional traders highlighted that Intel has already absorbed recent selling pressure without losing structure. RSI sits in the high-50s, which traders often describe as “room to run” rather than stretched. At the same time, MACD momentum is positive but tightening, which is why confirmation above resistance matters so much here.
X sentiment adds to this cautiously optimistic tone. Traders there are split, but the louder voices with larger followings are talking about upside continuation if $47.5 breaks, not about fading the move outright. That tilt is enough for me to stay on the long side, but with tight risk control.
News Impact:
Recent headlines around Intel’s 14A process and foundry ambitions are acting as a background tailwind. The news hasn’t sparked a runaway rally, but it’s helping buyers defend dips. At the same time, competitive noise from AMD and Nvidia is keeping expectations in check, which actually reduces the risk of a blow-off top this week.
Trading Recommendation:
Putting it all together, I’m taking a LONG position in Intel with a clear condition: I want to see price hold above $46.5 and ideally push through $47.5. If that happens, the path toward $48.5 and then $50.0 this week looks realistic based on where traders are positioning. I’d keep stops tight at $45.5, with a hard line at $44.5 if momentum fails. This isn’t a high-conviction moonshot, but it’s a clean, well-defined long with a favorable risk-reward if the breakout confirms.

Apple faces breakdown risk as traders eye $245 downside this weCurrent Price: 255.78
Direction: SHORT
Confidence level: 62%(Several professional traders consistently highlighted a short-term bearish breakdown with repeated downside levels at $245 and $239, while X sentiment was more optimistic, lowering overall conviction.)
Targets
Target 1: 245.0
Target 2: 239.0
Stop Levels
Stop 1: 260.0
Stop 2: 278.0
Wisdom of Professional Traders:
This analysis pulls together the collective thinking of many professional traders and market experts who have been actively discussing Apple’s recent price action. When I step back and look at their combined views, a clear short-term theme stands out: Apple’s chart has weakened after losing its prior uptrend, and several traders are preparing for follow-through to the downside. Crowd wisdom matters here because repeated mentions of the same downside levels often signal where positioning and expectations are clustering.
Key Insights:
Here’s what’s driving this trade idea. A large group of professional traders highlighted that Apple recently broke below a well-defined trendline and failed to reclaim key moving averages. That kind of price behavior usually doesn’t resolve upward right away. What caught my attention is how often $245 showed up in trader discussions as the first downside magnet. That level isn’t random; it lines up with prior consolidation and heavy volume.
Another recurring point from traders is Apple’s role as a heavyweight in major indices. When Apple weakens, it tends to stay under pressure for a bit as funds rebalance. Several traders also stressed that unless price can quickly push back above the mid-$260s, rallies are likely to be sold rather than chased.
Recent Performance:
You can see all of this reflected in the recent tape. Apple sold off sharply over the past week, dropping more than 5% at one point before stabilizing around the mid-$250s. Volume expanded on down days, which tells me sellers were more aggressive than buyers. Bounces have been shallow so far, another sign that momentum hasn’t flipped yet.
Expert Analysis:
When I look at what professional traders are actually saying, there’s a strong focus on $245 as the near-term objective. Multiple traders also pointed to the $239–$240 area, which lines up with the 200-day moving average, as a second level if selling accelerates. On the flip side, the same traders were clear that $260 is the first line that bears don’t want to see reclaimed. Above that, $278 was repeatedly mentioned as the level Apple must regain to change the short-term narrative.
X sentiment is more upbeat, with many posts framing this pullback as a buying opportunity. That disagreement is why I’m not assigning extremely high confidence. Still, price action and trader positioning carry more weight for a one-week trade.
News Impact:
The news flow hasn’t provided a clear catalyst to reverse the trend. Regulatory headlines around Apple’s ecosystem continue to hang in the background, and while fundamentals remain strong for 2026, they haven’t been enough to stop the current technical slide. In the short term, the market is trading the chart more than the story.
Trading Recommendation:
Putting it all together, here’s my take: I’m favoring a SHORT position in Apple this week while price stays below $260. The plan is to target $245 first, with a stretch goal toward $239 if downside momentum builds. Risk is clearly defined with stops above $260 and a hard invalidation above $278. This isn’t a long-term call against Apple’s business; it’s a tactical trade based on what the professional trading crowd is seeing right now.

70K: The Hopium Factory’s Final BossStructure first. Emotion later.
Daily trend broke down from the prior descending channel and printed an impulsive leg into the 60K zone on expanding volume — not exactly the kind of price action you frame and hang on the wall. What followed is a reflex bounce, not a structural reversal. This looks like classic dead-cat hop territory until proven otherwise.
Key battlefield levels:
70K — The Great Wall
Round number. Prior breakdown area. Heavy supply. Every rally into this zone is basically asking bagholders from higher up if they’d like to exit at breakeven. Unless there’s clean acceptance above 70K (multiple daily closes, real volume, no wick games), this is resistance. Period.
63K — The Decision Line
This is the pivot. Above it, bulls can cosplay strength. Lose it, and the market likely prints a lower high and rolls back over. Momentum flips fast below here.
60K — The “Support” That’s Been Tapped Too Many Times
Price knifed into this zone aggressively. It bounced, sure. But repeated stress tests weaken levels. A daily close below 60K doesn’t open a polite pullback — it opens a trapdoor.
48–50K — The Real Liquidity Magnet
If 60K folds, expect gravity to do what gravity does. The 48–50K region is the next meaningful demand pocket and a full mean-reversion target for this leg. That’s where real bids either show up — or don’t.
Bear Case Flow:
Fail at 70K
→ Reject
→ Lose 63K
→ Crack 60K
→ Accelerate into 48–50K
Simple. Brutal. Efficient.
Macro Backdrop (a.k.a. Why 70K Isn’t Free Money)
Rates are still restrictive enough to matter. Liquidity isn’t exploding. Real yields remain positive. Translation: this isn’t 2021 QE fairy dust season. Risk assets don’t moon on vibes alone.
ETF flows have cooled compared to peak euphoria phases. When marginal buyers step back, overhead supply suddenly feels very real. Without sustained inflows, 70K is not a trampoline — it’s a ceiling.
What Invalidates the Bear Case?
Clean acceptance above 70K.
Then reclaim of upper range structure toward 80K.
Anything less is just another lower high wearing bullish makeup.
Until proven otherwise, this is a corrective bounce inside a broader distribution phase. Everyone screams “when moon,” but the chart is quietly whispering “when liquidity?”
Trade the levels. Not the hopium.

US30 - DOWJONES Ready for a Sharp DeclineDOWJONES Ready for a Sharp Decline
🔹 Last week, we pointed out that on the monthly timeframe, signs of supply pressure relative to demand were evident.
🔹 We were waiting for confirmation from the weekly and daily timeframes.
🔹 That confirmation has now occurred, and supply pressure is clearly visible across monthly, weekly, daily, and even H4 timeframes.
✅ With this evidence, the risk is clearly worth taking.
✅ The optimal entry level has been identified (previously shared with a 3:1 reward ratio) and, with a minor update, is excellent for re-entry.

XAGUSD SILVER SHORT VIEW!!Gold prices dropped on Monday, pressured by thin trading volumes as U.S. and China markets remained shut due to local public holidays, while some traders booked profits after last session's 2.5% jump.

BTCUSD SHORT VIEW 2H!!Bitcoin is currently trading roughly 50% below its all-time high, a drawdown that looks severe in isolation but still smaller than the 70%+ declines seen in prior bear markets

BTC expectation : 1 WeekFor BTC, the price still has a downward trend, 71 818 point is the decision for the price, above this point price can increase till 89 000 points, but first it should win 80 376 point, one more retest downside on 61 388 points, can push the price downside near 50K.
From fundamentals, Still Clarity ACT law is delayed, and we do not know the exact date when they accept this law, but Scott Basset said that they will probably accept this law on Spring. The main disagreement between banks and crypto companies is the stablecoin yield.

ElDoradoFx – GOLD ANALYSIS (16/02/2026, LONDON SESSION)
Gold is trading around 5,006 after rejecting from the 5,050–5,060 supply and forming a corrective structure above 4,970. Price is compressing between dynamic resistance (descending trendline + 1H supply) and ascending intraday trendline support.
London session opens with price sitting directly at the 5,000 psychological level, making this a decision zone. Expansion is expected soon.
⸻
📊 Technical Outlook (D1, H1, 15M–5M)
🔹 D1
• Macro uptrend still structurally intact
• Strong rejection from 5,600 high previously
• Daily currently consolidating inside 4,825–5,145 range
• Price holding above major bullish order block
• Momentum cooling but no confirmed daily reversal
🔹 H1
• Bearish BOS previously from 5,080 zone
• Current structure forming higher lows from 4,878 sweep
• Price testing 200 EMA / dynamic resistance near 5,000
• Supply resting 5,030–5,060
• Ascending trendline support near 4,980
🔹 15M–5M
• Intraday compression pattern
• Higher lows respected into London
• Momentum turning slightly bullish
• Liquidity resting above 5,050 and below 4,970
⸻
✨ Fibonacci Golden Zones
(Based strictly on visible H1 swing: 5,052 → 4,878)
1️⃣ SELL Swing: 5,052 → 4,878
• 38.2% = 4,945
• 50% = 4,965
• 61.8% = 4,985
🟥 SELL Golden Zone: 4,965 – 4,985
2️⃣ BUY Reaction Swing: 4,878 → 5,020
• 38.2% = 4,965
• 50% = 4,950
• 61.8% = 4,935
🟩 BUY Reaction Zone: 4,965 – 4,935
⸻
🎯 High Probability Zones
📉 SELL Scenario (Primary Intraday Bias)
Sell Zone: 5,030 – 5,060
🎯 Targets → 5,000 → 4,970 → 4,940 → 4,900
🛑 SL: Above 5,090
⚡️ Confirmation:
• Sweep above 5,050
• 5M bearish BOS
• Strong rejection wick
—————————
📉 SELL Breakout Setup
Trigger: Break & close below 4,970
Retest: 4,980 fail
🎯 Targets → 4,940 → 4,900 → 4,880
🛑 SL: Above 5,010
—————————
📈 BUY Scenario (Trendline Continuation)
Buy Zone: 4,950 – 4,970
🎯 Targets → 5,000 → 5,030 → 5,060
🛑 SL: Below 4,930
⚠️ Only valid if trendline holds
—————————
📈 BUY Breakout Setup
Trigger: Break & hold above 5,060
Retest: 5,030–5,040
🎯 Targets → 5,100 → 5,145
🛑 SL: Below 5,000
⸻
📰 Fundamental Watch
• London liquidity expansion expected
• USD flows remain key driver
• Price positioned at psychological 5,000
• Watch for fake breakout before true move
⸻
📌 Key Levels
Resistance: 5,030 / 5,060 / 5,100 / 5,145
Support: 4,970 / 4,940 / 4,900 / 4,880
Break-Buy Trigger → > 5,060
Break-Sell Trigger → < 4,970
⸻
📌 Summary
Gold is compressing between dynamic resistance and ascending support. London will likely sweep liquidity before expansion.
Primary bias remains sell on rejection from 5,050–5,060 unless buyers reclaim 5,060 with strong acceptance.
Decision level: 5,000
— ElDoradoFx PREMIUM 3.0 Team 🚀
🥇 ElDoradoFx FREE/GRATIS – WEEKLY PERFORMANCE (09–13 FEB 2026)
📅 Steady signals. Consistent execution.
━━━━━━━━━━━━━━━━━━━
🟩 WEEK 2
❌ BUY −100 PIPS
✅ BUY +170 PIPS
✅ SELL +40 PIPS
✅ BUY +90 PIPS
✅ BUY +30 PIPS
✅ BUY +200 PIPS
✅ BUY +70 PIPS
✅ BUY +180 PIPS
✅ SELL +55 PIPS
━━━━━━━━━━━━━━━━━━━
📊 WEEKLY SUMMARY
🏅 GOLD TOTAL: +735 PIPS (after 1 SL)
📈 9 Signals Sent
🏆 8 Wins | 1 SL
🎯 Win Rate: 89%
━━━━━━━━━━━━━━━━━━━
🔥 Another profitable week for our FREE community.
And remember — this is just the free tier.
Inside ElDoradoFx PREMIUM 3.0, members receive more setups, live sessions, and detailed entry zones designed for higher precision and larger targets.
If you're ready to take trading more seriously…
consider the upgrade.
— ElDoradoFx Team 🚀

Short term sell before buys ?!!!Price invalidated our poi on Friday due to unforseen price reactions that's why we manage risk.
My current bias is for a short sell regardless of the bullish trend we are in and my reasons are simple:
1. Internal choch with strong Displacement
2. Internet bearish intent confirmed by the Imbalance
3. We have a clean origin of Displacement (bullish order block before the choch with displacement)
Kindly manage risk for the sell if you wish to take it.
