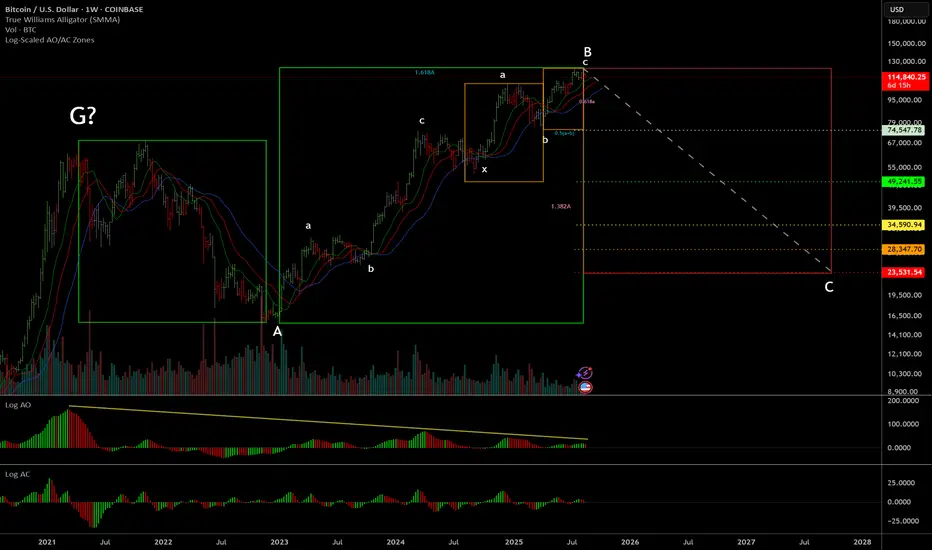
BTC Double Zigzag Ending on Terminal Impulse (Elliott Wave)BTC has formed into a double zigzag from the low in 2023 until now. This is the same count that my friend Glenn Neely (the founder of Neowave) is following.
At this point there aren't really any other counts that appear to make sense. Especially considering the terminal impulse that wave-c has formed (see Daily chart).
We've already begun breaking down from the rising wedge pattern, which is a strong indication that wave-c has concluded.
Beyond just Elliott Wave/Neowave considerations, this has also formed long-term momentum divergences on the AO, and a clear weekly wiseman right at the end of wave-5 of c, perfectly aligned with the 0.5(a+b) time target for wave-c.
This perfect confluence of signals here is a very strong signal the market has topped out long-term, and could retrace all the way back to ~$23k in the worst case scenario. Other potential retracement levels are labeled on the chart.
If this does end up breaking $125k, then it may be a good idea to flip bullish as the bull cycle could continue for an unknown amount of time after that. For now, probabilities are starting to stack up indicating that the top is in and a big retracement is coming.
Bill Williams Indicators
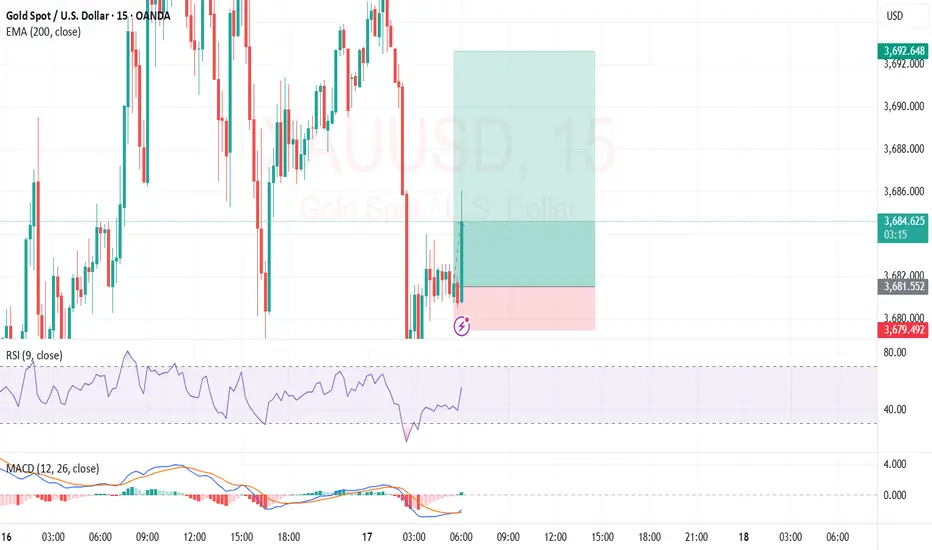
RSI up + MACD cross on M15 & M5 + Bull Engulf + EMA200 bounce RSI oversold + MACD about to cross on M15 & M5 + Bull Engulf on M15 with spike down bounced off EMA200 = A+ setup
Took this trade following spike down into EMA200 on M15 and bounce. MACD also crossed on both M15 and M5. Large bullish engulf on M15. Excellent setup.
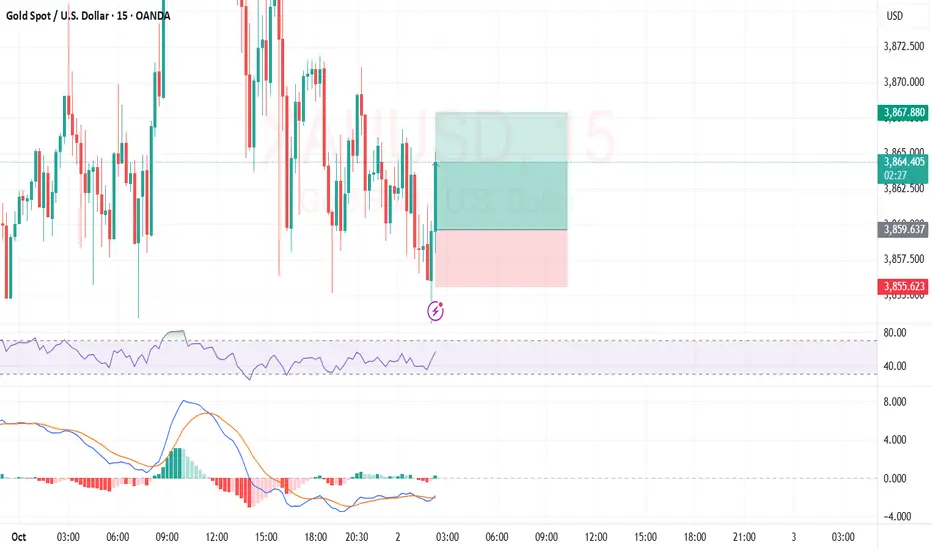
RSI up from 17% on M15 + MACD Cross + EngulfingRSI up from 17% on M15 + MACD Cross + recent Engulfing, TP at edge of FVG above.
Woke up to this perfect setup. RSI coming up from an earlier low of 17% on M15, the MACD had just crossed over bullish, and earlier a bullish engulf had printed. Price has stayed above the EMA200 line on M15 and higher TFs are also bullish. TP placed at the edge of FVG above and got a great R:R.
Very happy with this. 1:5 here we come.
Advanzia Group: Tokenization of RWA — BlackRock and $29B On-ChaiIn 2025, the tokenization of real-world assets (RWA) has evolved from a niche trend to a mainstream financial tool, bridging traditional finance with blockchain. The total on-chain RWA market has reached $29 billion (up 260% YTD), with Ethereum dominating at 57%. BlackRock, through its BUIDL fund, leads in tokenized treasuries with $5.5 billion in assets. From Advanzia Group, an analytics platform specializing in Web3 metrics and AI-driven signals, we explore the RWA market, Fibonacci and RSI levels for key tokens (ONDO, MKR, RWA tokens), and trading signals. Data as of September 16, 2025—prime time for positioning ahead of institutional inflows.
Advanzia Group equips traders with dashboards for on-chain analysis; sign up for demo access to seize the edge.
RWA Market Overview: $29B On-Chain, Ethereum 57%
RWA tokenization digitizes assets like treasuries, real estate, and bonds on the blockchain, enabling liquidity and 24/7 trading. The total market stands at $29 billion, with treasuries accounting for 40% ($11.6 billion), led by BlackRock’s BUIDL at $5.5 billion (45% of tokenized treasuries). Ethereum holds 57% ($16.5 billion), followed by Solana (20%) and Polygon (15%). The 260% YTD growth is driven by regulations (MiCA, GENIUS Act) and institutional inflows: $4.7 billion in Q2.
On-chain: DeFi RWA TVL is $150 billion, with transactions up 25% (Ethereum + Solana). Advanzia’s AI detects a 71% bullish sentiment: whale accumulation in ONDO (+15%), with potential for $50 billion by year-end.
BlackRock’s Role: BUIDL and Tokenized Treasuries
BlackRock, with $10 trillion AUM, drives RWA through BUIDL (launched 2024), tokenizing US Treasuries on Ethereum with $5.5 billion in assets. The fund offers a 5.2% yield (above inflation), redeemable in USDC. Impact: BUIDL boosts RWA liquidity by 30%, integrating with Aave and Uniswap. Forecast: BlackRock aims for $2 trillion in RWA by 2030, with BUIDL reaching $10 billion by 2026.
For traders: BUIDL strengthens RWA-treasury correlation (0.8), reducing volatility; BUIDL token RSI at 55 signals neutral-bullish momentum.
Fibonacci and RSI Levels for Key RWA Tokens
Advanzia analyzes top RWA tokens: ONDO (Ondo Finance), MKR (MakerDAO), and aggregated RWA protocols. Levels based on April’s trend.
ONDO ($1.45): Support at $1.20–$1.30 (50% Fibonacci retracement). Resistance at $1.50–$1.60. RSI at 58 (bullish momentum, above 50). MACD: Crossover above zero—signal for 10–15% growth to $1.65. On-chain: TVL $2.5 billion, inflows +20%.
MKR ($2,800): Support at $2,500–$2,600 (38.2% Fibonacci). Resistance at $2,900–$3,000. RSI at 62 (healthy trend, not overbought). Bollinger Bands: Squeeze signals upward breakout. On-chain: DAI collateral $8 billion, RWA integration +15% TVL.
RWA Tokens (aggregate, ~$0.95 equivalent): Support at $0.85–$0.90 (61.8% Fibonacci). Resistance at $1.00–$1.05. RSI at 55 (neutral, bullish divergence). MACD: Histogram +0.12—8% growth momentum. On-chain: Ethereum 57%, treasury inflows $1.2 billion.
Overall trend: RWA RSI 56–60, Fibonacci support at $0.90—bullish for Q4.
Trading Signals from Advanzia Group
Leverage our AI signals for RWA trading:
Long ONDO: Enter above $1.30 (RSI >55), stop at $1.20, target $1.65 (Fib 61.8%). Yield 10–15% on DeFi collateral.
MKR Arbitrage: On MACD crossover and Bollinger breakout, long with DAI hedge; target $3,000, 5% risk.
RWA Aggregate: Buy at Fibonacci support ($0.90), RSI divergence—8–12% upside. Hedge with treasury ETFs.
Forecast: $50 billion on-chain by December, with BlackRock at $10 billion. RWA/BTC correlation at 0.7—diversify 10–20% of portfolio.
Conclusion: Invest in RWA with Advanzia
RWA tokenization at $29 billion (Ethereum 57%) is a breakthrough, led by BlackRock’s BUIDL. Fibonacci and RSI signal a bullish trend for ONDO/MKR. Advanzia’s AI is your tool for signals and on-chain insights.
Ready for growth? Join Advanzia Group for alerts. Which RWA is on your radar? Comment below!
#RWA #Tokenization #BlackRock #Ethereum #AdvanziaGroup
RSI + MACD Cross + Morningstar = A+ RSI down from 65% on M15 + MACD crossover bearish + Morningstar. FVG below.
Took this trade just now. RSI was coming down from a high of 65%. Morningstar candle had printed recently (see circle), then MACD crossed over bearish. We are in range conditions so MACD not necessary but it's great to have that confluence as extra confirmation. Plus we have a lovely area of FVG below.
London loves to flip up and down in the morning. You can make some great profit catching these moves. I normally trade these on M5, but the setup was cleaner on M15 this morning.
Improvements - could have entered earlier (or later) for much better R:R.

Price broke below EMA200 on M15 + Shooting Star + MACD CrossPrice below EMA200 on M15 + Shooting Star + MACD bearish cross - Tokyo.
Entered this trade a few hours ago during Tokyo session. Price finally broke through the EMA200 on M15 putting us into sell territory. A shooting star had been printed and the MACD produced a bearish cross.
As several of you noted, there’s a clean FVG stack below — I placed my TP at the end of that block.
SL was set just above the most recent structure high, giving this trade a strong R:R of nearly 1:9.
RSI is already oversold, but in strong trending conditions, it can remain that way for a while.
Looks like we’re (hopefully lol) printing the closing leg of a clean M-pattern.

EMA200 Reject on M15 + RSI ReboundPrice was going down but reacted hard off of the EMA200. RSI was coming up from a very low c.14% on M5. 3 down liquidity spikes in a row on M5. As soon as I got into the trade momentum got behind it. Great trade so far. Also once in, MACD crossed over bullish on M5.
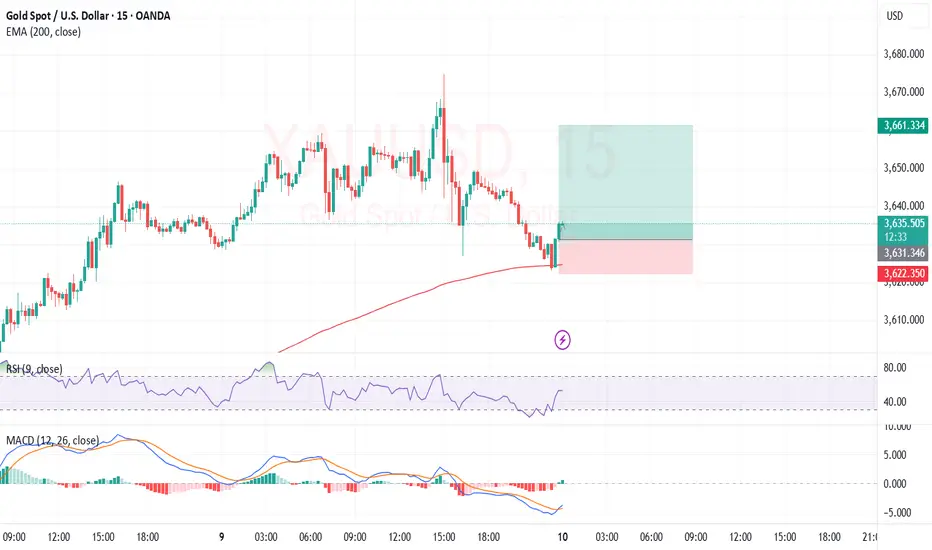
RSI retest + MACD cross + Engulfing Candle + EMA bounce = A+So errors were made tonight, I haven't entirely been following my own trading plan. Back on track with this A+ setup however.
RSI has been climbing back up, beautiful bullish engulfing candle was formed, and then MACD finally crossed back over to bullish. Also price bounced off the EMA200 on M15.
1:3. TP at edge of FVG.
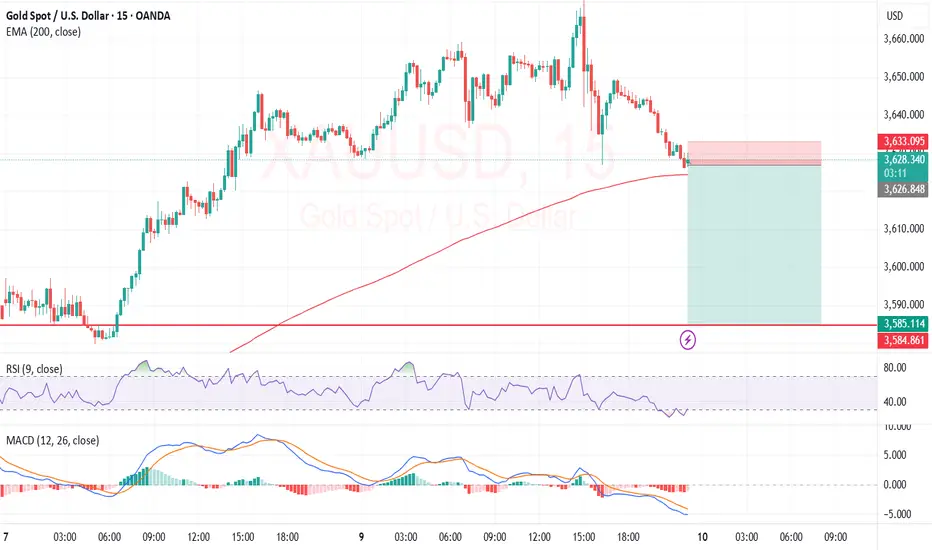
XAUUSD - RSI + MACD + FVGTook this sell. RSI has been very low for a while coupled with MACD staying bearish, lines have been widening.
Plenty of FVG below for TP.
EMA200 about to breach.
As soon as I entered the trade, candle started going green. So we shall see. Earlier analysis might have been right but I got in too early before (resulting in SL). We shall see...
RSI + Morningstar-V + EMA DefendRSI coming up from a low of c.20%, variation Morningstar candle pattern printed. With the MACD starting to turn a bit, not as much as I would like, but bearish histo bars getting smaller. Also if price is going to respect EMA 200 this is it. If not we will be looking for bears later.
News still saying - record highs etc.
Put TP at end of FVG. SL below structure.
Nice 1:5 if it goes all the way.
Not A+ setup but pretty good.
RSI recently <35% + MACD CrossRSI coming up out of recent RSI lows plus bullish MACD crossover for confirmation.
Took a 1:4 going into blue sky territory. How far will she go today? Happy trading people.

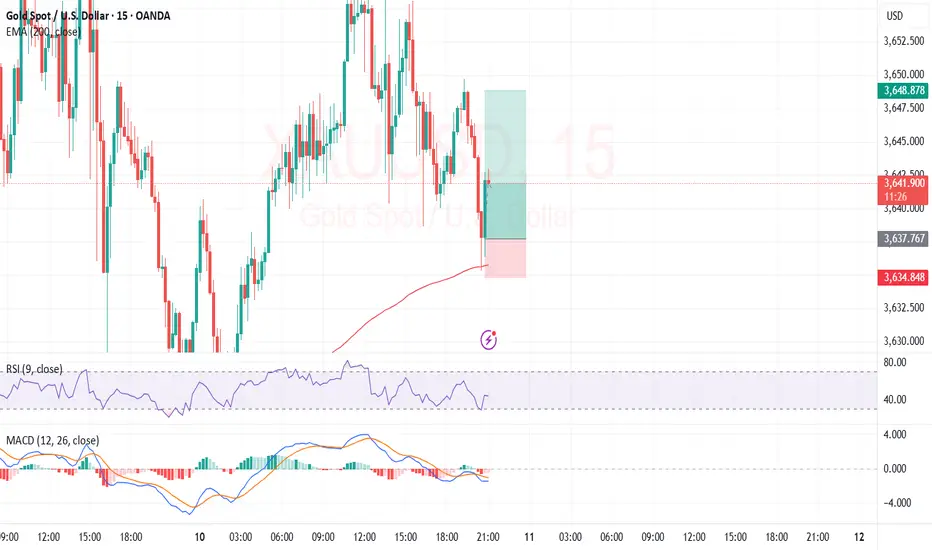
RSI Dip + Morningstar on M15 - Tokyo (2)Following earlier winning trade, I got back in on gold's bullish run. Confluences were RSI dip and Morningstar candle pattern. MACD is only lightly bearish, looks like it will flip back bullish again shortly which will provide further confirmation in due course.
For educational purposes only, not financial advice.

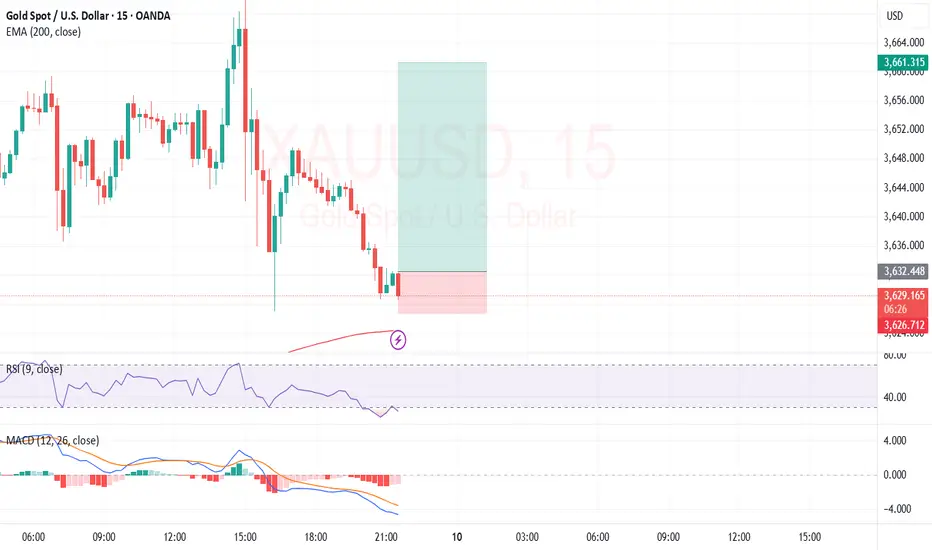
RSI + MACD Cross + MorningStar TokyoTook this long during the Tokyo session (M15) after RSI dipped to 35 on XAUUSD. Waited for a bullish Morning Star to complete, then entered once MACD crossed bullish for extra confirmation. TP is set at 1:10, just below the high from two weeks ago.
Sharing for educational purposes — not financial advice.

ARB Bullish Multi 1-2 impulse! Many Alts show a similar patternAs shown we finished out wave 2 with an expanding flat correction. We then chopped around in several lower degree Multi 1-2 structures in the latest 1,2 1,2 price action. Wave 3, once started should show clear signs of increasing volume as well as an increase in the degree of slope compared to past impulse waves. Should be a nice move if wave 3 is underway! Happy Trading
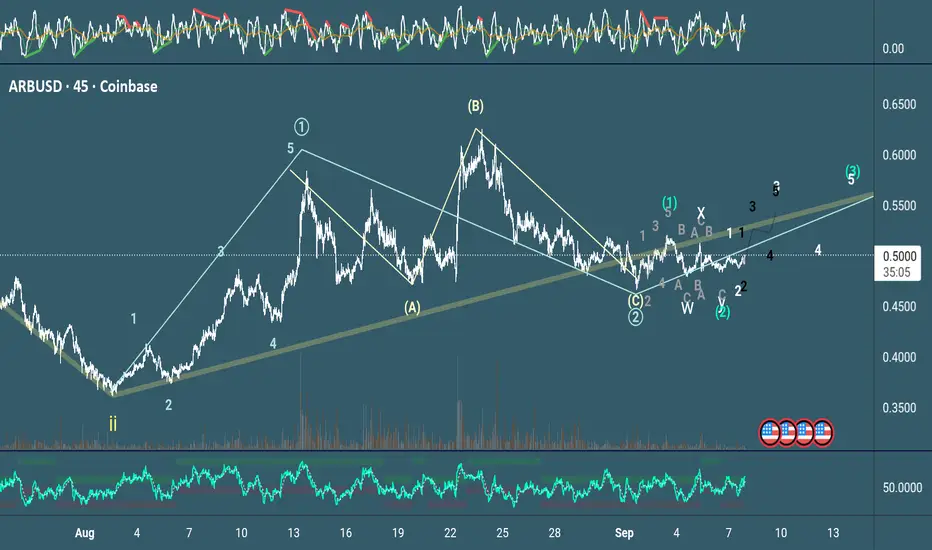
Ready for +5KNicely coiled under William's Alligator which has completely inverted - yellow under red under blue (oversold in a bull market). Look for a bull rally here breaking out of the short term wedge in the coming days.

WTI Crude Oil – India Keeps Buying Russian Oil Despite U.S. SancSymbol: USCRUDE
Timeframe: Weekly
Current price: 63.53
⸻
Bearish scenario
• Entry: SELL STOP 62.50
• Targets: 59.38, 56.25, 53.12
• Stop: 64.50
Alternative bearish scenario
• Entry: SELL LIMIT 65.62
• Targets: 59.38, 56.25, 53.12
• Stop: 68.00
⸻
Key levels
Resistance: 65.62, 68.75, 71.88
Support: 62.50, 59.38, 56.25, 53.12
Indicators
• Bollinger Bands → pointing down, resistance at 65.62.
• MACD → negative zone, trend still bearish.
• Stochastic → overbought, risk of reversal.
⸻
📌 WTI is testing 62.50 support. Break lower → downside to 59.38–53.12. If price rebounds near 65.62, sellers could re-enter with tight stops.

DaxPrime: BlackRock Exec Move Signals SharpLink’s $1.3B ETH ShifIn a development that is drawing attention across both institutional finance and the crypto ecosystem, a senior executive from BlackRock’s digital assets division has transitioned to SharpLink Gaming — a rising Ethereum whale and sports betting infrastructure player now managing over $1.3 billion in ETH-based assets. At DaxPrime, we see this move not as an isolated career shift but as a strategic signal of deepening convergence between traditional asset management and Web3-native businesses.
The Move: From Wall Street to Web3 Execution
According to sources familiar with the matter, BlackRock’s former Head of Digital Asset Strategy, Daniel Wexler, is joining SharpLink Gaming as its Chief Digital Officer. Wexler played a critical role in shaping BlackRock's crypto ETF initiatives and oversaw early-stage partnerships with Ethereum ecosystem projects.
His transition comes at a time when SharpLink — originally focused on B2B sports betting technologies — has evolved into a key player in decentralized infrastructure, integrating smart contracts, Layer-2 analytics, and tokenized in-game markets. The company currently holds over $1.3 billion in Ethereum, making it one of the largest corporate ETH holders in the entertainment-tech sector.
DaxPrime’s View: Strategic Talent Realignment
At DaxPrime, we interpret this as more than just a personnel update. It reflects a broader realignment where institutional talent is gravitating toward firms that offer speed, flexibility, and a native role in the decentralized economy.
“The move illustrates a trend we’ve tracked since early 2024: legacy finance professionals are increasingly pivoting toward operational roles in Web3-native companies, particularly those with real assets and strong ETH exposure,” says Michaela Strobel, Senior Analyst at DaxPrime.
SharpLink’s use of Ethereum spans beyond treasury holdings. The firm is building proprietary smart contract infrastructure for real-time sports data feeds, NFT-linked fantasy games, and decentralized betting protocols — signaling a broader use-case than speculative ETH storage.
Ethereum as a Strategic Asset
Wexler’s decision also underscores Ethereum’s growing importance as a corporate strategic asset, not merely an investment vehicle. Ethereum’s programmable layer and widespread developer adoption make it the backbone of emerging digital business models — including SharpLink’s.
DaxPrime’s July 2025 ETH Treasury Index reveals that more than 18 publicly listed firms now hold over $500 million in Ethereum each, compared to just five a year ago. This uptick is particularly concentrated in sectors like digital media, AI-gaming convergence, and decentralized finance tooling.
“Ethereum’s shift from an investment to infrastructure asset is well underway,” Strobel notes. “Wexler’s move brings boardroom-grade credibility to a company operating deep within that transformation.”
What It Means for Investors
For investors, this move signals two critical developments:
Institutional Validation of Web3 Business Models: Wexler’s transition lends credence to firms building around Ethereum-based infrastructure, rather than just speculating on token prices.
New Pathways for ETH Utility: SharpLink’s planned integration of ETH staking, yield strategies, and decentralized oracles into its sports gaming vertical could set new standards for how consumer-facing platforms leverage blockchain.
DaxPrime’s Conclusion
The decision by a senior BlackRock executive to join an Ethereum-native company like SharpLink Gaming is not a one-off anomaly. It reflects a rapidly maturing industry where the center of gravity is shifting from financial speculation to operational integration.
At DaxPrime, we continue to monitor executive movements as a leading indicator of sector confidence and capital rotation. As Ethereum evolves from “store of value” to “platform for value,” such strategic appointments signal where the smart money is going — and what the next phase of crypto utility will look like.
Crypto Might Protect You from a Global Debt Crisis | OpinionAs sovereign debt levels surge and central banks struggle with inflationary aftershocks, investors worldwide are seeking new forms of financial protection. While gold and U.S. Treasuries have historically served as safe-haven assets, the current global debt structure presents unprecedented risks. In this context, cryptocurrencies — particularly decentralized, deflationary assets — may offer a unique hedge against systemic instability.
A Mounting Crisis
According to the IMF, global debt reached $315 trillion in Q2 2025, led by the U.S., China, and EU member states. Rising interest rates have pushed sovereign debt servicing costs to record highs. At the same time, inflation remains sticky, and fiscal deficits continue to expand — creating a scenario where traditional instruments may no longer preserve purchasing power.
Credit downgrades of major economies — including a recent warning from Moody’s on the UK and France — further highlight the fragility of fiat-based systems.
Why Crypto Provides an Alternative
Fixed Supply:
Bitcoin’s 21 million cap remains untouched. In an era of unlimited fiat printing, scarcity is a value proposition in itself.
Decentralization:
Cryptocurrencies operate outside centralized banking systems. In case of capital controls or currency devaluation, digital assets remain globally transferable and resistant to censorship.
Accessibility and Liquidity:
From stablecoins to DeFi protocols, crypto provides 24/7 access to financial tools — often with greater transparency than traditional banks.
Not Without Risk
Crypto remains volatile and vulnerable to regulatory shifts. The recent ETF delays by the SEC and tax crackdowns in G20 countries underscore the uncertain terrain. However, compared to the looming debt traps of fiat economies, some volatility may be an acceptable tradeoff for autonomy and deflationary exposure.
Growing Institutional Interest
Firms like Fidelity, BlackRock, and BBDelta have significantly increased their crypto allocations, particularly in ETH and BTC. Even central banks are researching CBDCs and holding digital reserves as a contingency plan.
Conclusion
While crypto isn’t a panacea, it represents a credible hedge in a world where fiat debt continues to spiral. For risk-aware investors, a balanced portfolio in 2025 likely includes a thoughtful allocation to digital assets — not for speculation, but for protection.
The debt crisis is not a distant threat. It’s unfolding now — and cryptocurrency may be one of the few tools with the potential to navigate what comes next.

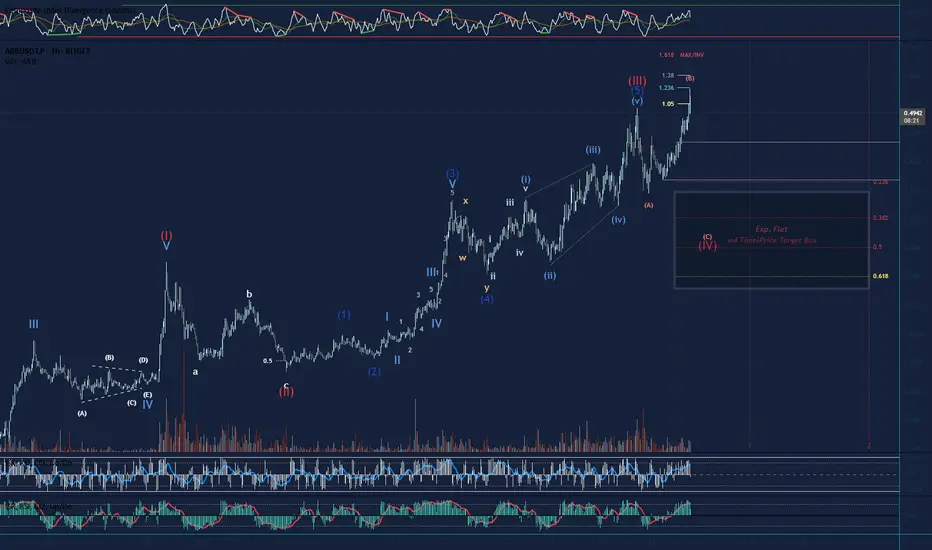
Update on Arbitrum Expanding FlatZooming in on the 3min TF the Target for completion of wave C of regular flat (White wave 2 retracement) will be 0.4888. Looking to reverse lower at this level to complete the white impulse down for wave C of larger degree Expanding Flat (See earlier post for HTF count)
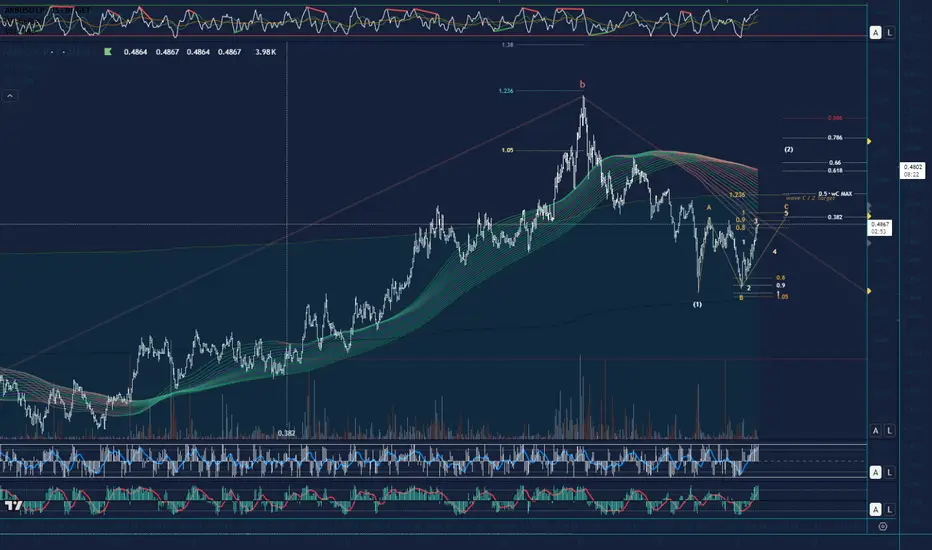
Looking to complete a wave 4 Retracement on Arbitrum Short term outlook is bearish as we are looking to complete an expanding flat to the downside. Wave B neared it invalidation, but reversed down. Lets see if the bears can push it down to the 0.5 Fib Target, soft target is the 0.382 Fib. If volume increases this could be a third up, but we need the wave 4 at the moment, and wave B of the expanding flat is a clear 3 waver so far. Long term we are still bullish with plenty of nested wave 3s to keep us counting to the upside in the future haha. Not Financial Advice
6/19 Gold Analysis and Trading SignalsGood morning!
Yesterday, the Federal Reserve's interest rate decision aligned with market expectations, bringing no major surprises. The market had already priced in bearish sentiment in advance, which led gold to trade within the Bollinger Bands' upper, middle, and lower bounds, with all three bands trending sideways, indicating limited intraday volatility.
🔍 Technical Overview:
On the 30-minute chart, the Bollinger Bands began to tilt downward near the close, with price currently pressured by the middle band;
However, MACD structure suggests the middle band may be broken, with potential for price to challenge the upper band resistance near 3392–3400;
More importantly, on the 1D chart, the MACD is showing signs of a bearish crossover (death cross). If confirmed, it may break the bullish structure, weakening support from the weekly MA5;
If gold sustains below the weekly MA10 at 3317, it could open the door for a broader correction, with a drop toward 3200 becoming increasingly likely.
📊 Fundamental Factors:
Today’s U.S. market holiday means fewer economic data releases. As such, gold will likely be driven by technical structure and geopolitical headlines, especially those related to the Middle East. If no new developments emerge, selling on rallies remains the preferred strategy.
📌 Trading Plan (VIP-Focused):
✅ Sell Zone: 3392–3409
✅ Buy Zone: 3338–3321
✅ Scalp/Flexible Zones: 3387 / 3373 / 3364 / 3356 / 3345

USDCAD – Bullish Reversal After Completed Wave 5 and AO DivergenAnalysis:
The USDCAD daily chart shows a textbook completion of an Elliott Wave 12345 sequence. Wave (5) has just completed, supported by clear bullish divergence on the Awesome Oscillator (AO) – a classic signal suggesting exhaustion of bearish momentum.
What strengthens the bullish reversal bias is the presence of a bullish engulfing candle at the end of Wave (5), right at a key structural low. This candle formation, combined with the divergence, provides strong evidence that a corrective wave (likely Wave A or a larger reversal) may be underway.
🔍 Key Confluences:
Wave 5 ends in a falling wedge structure.
AO shows higher low on Wave 5 compared to Wave 3 → Bullish Divergence.
Bullish engulfing candle confirms momentum shift.
Price action breaking out of the wedge pattern.
🎯 Trade Plan:
I am waiting for a pullback toward the breakout zone to find an optimal buy entry. The ideal entry would be a retest of the bullish engulfing candle low or broken wedge resistance, turning into support.
📈 Targets:
Initial short-term target: ~1.3850 (previous Wave 4 region).
Mid-term potential: ~1.4050 depending on structure development.
🛑 Invalidation:
A daily candle closing back below the low of the bullish engulfing will invalidate the bullish outlook.

Taming the Trend: Mastering the Williams Alligator IndicatorEver wondered how to spot when the market is sleeping or ready to roar? At Xuantify , we use the Williams Alligator Indicator to decode market behavior with precision. Whether you're trading crypto, forex, stocks, or indices — this tool adapts across all markets. Let's take a closer look using BINANCE:BTCUSDT
🧠 How We Use It at Xuantify
We treat the Alligator as a trend confirmation and timing tool . We don’t just look for crossovers — we analyze the distance , angle , and alignment of the lines to gauge market momentum and trend maturity. It’s especially powerful when combined with volume and volatility filters.
⭐ Key Features
Three Smoothed Moving Averages
Jaw (Blue) : 13-period, shifted 8 bars forward
Teeth (Red) : 8-period, shifted 5 bars forward
Lips (Green) : 5-period, shifted 3 bars forward
Visual Trend Clarity :
The spacing and direction of the lines reveal trend strength and direction
Built-in Delay :
Forward shifting helps anticipate rather than react
💡 Benefits Compared to Other Indicators
Trend Clarity
Alligator : Strong — bold trend visualization
Moving Averages : Moderate — can lag or overlap
MACD : Good — clear histogram and signal line
Noise Filtering
Alligator : Excellent — smooths out market noise
Moving Averages : Low — sensitive to short-term fluctuations
MACD : Good — filters minor moves
Early Signals
Alligator : Moderate — waits for confirmation
Moving Averages : Fast — quick crossovers
MACD : Fast — early divergence signals
Visual Simplicity
Alligator : Clear — easy to interpret trend phases
Moving Averages : Cluttered — multiple lines can overlap
MACD : Complex — requires interpretation of histogram + lines
⚙️ Settings That Matter
For shorter timeframes : Reduce periods (e.g., 8-5-3) for faster signals
For longer timeframes : Stick with defaults or increase smoothing for clarity
Shift values : Keep them forward-shifted to maintain predictive edge
📊 Enhancing Signal Accuracy
Wait for clear separation between the lines
Confirm with volume spikes or breakouts
Use price action (e.g., higher highs/lows) as confirmation
🧩 Best Combinations with This Indicator
Fractals : For entry/exit signals
ATR : For dynamic stop-loss placement
RSI or Stochastic : To avoid overbought/oversold traps
Volume Profile : To validate breakout zones
⚠️ What to Watch Out For
Flat Alligator = No Trade Zone : Avoid trading when lines are tangled
Lag in Fast Markets : In high-volatility assets, the Alligator may react late
Over-reliance : Always combine with other tools for confirmation
🚀 Final Thoughts
The Williams Alligator isn’t just an indicator — it’s a market behavior model . At Xuantify, we use it to stay aligned with the market’s rhythm, avoid chop, and ride trends with confidence.
🔔 Follow us for more educational insights and strategy breakdowns!
