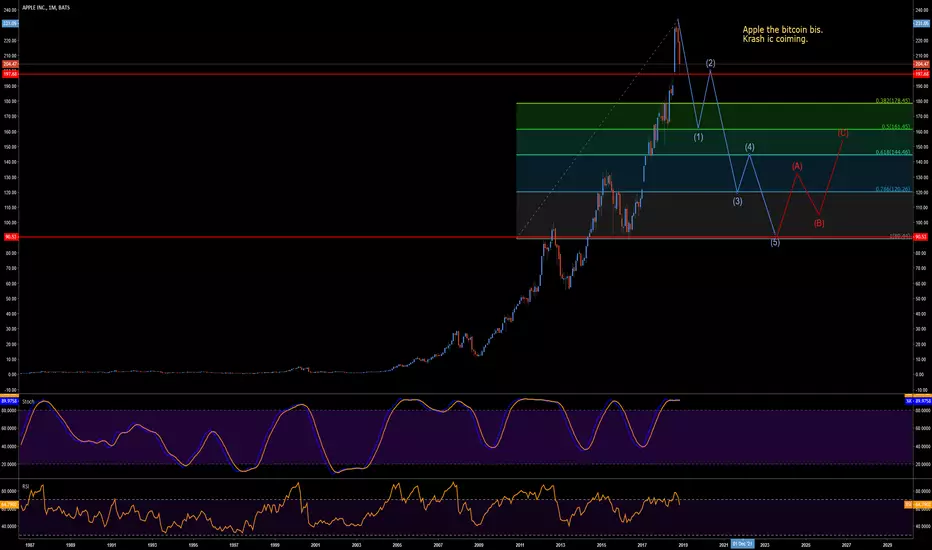
tech bubble participantSquare part of the tech bubble 2.0 along with faang stocks and many others. Lots of short money to be made here
Bubblemarket

Contrarian Play, Bubble is about to burst SPY QQQthe market seens to be indestructible, but the thing is, market has not retest dic lows, like it dit in april 8 2018, that was real whats why markets did go to all time highs, when we have market correction in feb 1, tax cut new sell the news, now we have another story china deal but these news have already price in, the last time that i see market not let it fall to even 20 SMA, Was indeed in Jan 2018, market speculators are creating an atomic bomb with leverage, i think china is gonna unwind the devil, also, i have wathcing currencys, the dolar and yen has been manipulative like the last time we had corrections, the same thing different story,market rise faster but downside oh men, i think we will have a vix 30-50 this time. once this thing star to fall to 280 gonna go down faster to 275, i think microsoft one hit $100 in the next months,also all last rallys have low volume,im worried, but honestly even real state is all time high, market just ignore every negative news and embrace "+" just watching CNBC makes me barf. just becareful about your investment horizon, just in january apple did warning about profits, and now everything is fine? fed has created this massive bubble for years but my actual target for spy these year is 2008 and by march 2020 1999. enjoy will it last the biggest bubble in US History and is not bitcoin. So rare that the fed has decide to cut rates 2 to 0, but the economy is soaring, once those yields hit below 2% panic comes, inverted yield curve have been the most realiable source of predicting Recessions, end of economyc cycles once these bubble burst is already to late. you cant buy puts You are welcome.

S&P 500 is Still a Bearish Index!Aloha, traders.
This post is meant to discuss the market shock today in which the S&P 500 shot up 1.47%, an unexpected turn of events after such a confident downtrend. Upon further examination, however, this rebound should not have been unexpected; a dead cat bounce against resistance made sense. However, I expect the price to touch the top resistance at $2800 tomorrow morning before returning to its bearish trend. I still maintain that the index will crash to $2600, based on the support and resistance lines.
For the time being, we are holding our short position on S&P 500, probably even shorting more if the index works up to 2800 tomorrow.
Thanks for reading, leave a like if you agree!

S&P 500 Demolishes Any Chance of RecoveryAloha, trader! Welcome back to another S&P update.
If you've been keeping up with our posts, I noted over the weekend that traders should be watching the S&P 500 index, on the brink of a crash. This week, that crash has been playing out, destroying the 2 month bullish rally we've been seeing. Today was a big day for the index, as it needed to beat possible support at around $2755. The bears have won yet again, however, and as we predicted, S&P smashed below. We can expect further bearish price action.
I still estimate the index to drop as low as $2500, but perhaps faster than I had originally imagined for such a large fund. Nevertheless, I will hold my short on the index by longing shares in SPXS. I do not expect any noticeable bounces to occur, MACD for the index is strongly indicative of more bearish action, but we've seen crazier.
We've been right about the initial S&P drop, the crypto breakout and Ethereum rally, will we be correct about about a second drop for S&P?
Thanks for reading, leave a like if you agree!

THE GREAT PALLADIUM BUBBLEWow I have been constantly looking for the next big thing after the crypto fury. I've found the gold mine. Or should I say Palladium mine? Even through a recession, the demand for palladium would theoretically stay very high. That in combination with the fact that now word of mouth is spreading and news reports are starting to come out. When fomo kicks in this could be a wild ride.
Very oversold on the weekly here, Waiting for a correction in the coming months before more upwards action.

Bitcoin : change of structure, possible slow and long declineThis is how i see the current Bitcoin crashing structure.
The breakdown below the 6k descending triangle broke the main bullish structure.
I am expecting a slow declining Usd value, in a sort of similar way of the first Bitcoin bubble.
Lonely differences: market cap, and time frame.
As you can see, the current crashing market is developping around 6x slower than the first Bitcoin crash, which makes sense considering the difference of capitalization.
It took Bitcoin around 135 days since the eventual current position in the same structure, to start a bull cycle.
Which means the current Bitcoin cycle could start a bull run in around 2 years.
Yes, this is a possibility.
Of course this is just some technical speculation, but this might not be far from what is about to happen with Bitcoin , 2 more years of bear market.
I could be totally wrong, this is just an hypothetical analysis. But this is something to be aware of, if you are feeling able to invest and wait for some years.
Stay tuned.

Bitcoin Daily Update (day 256)I believe that it is possible to beat the market through a consistent and unemotional approach. This is primarily achieved through preparing instead of reacting. Click here to learn more about how I use the indicators below and Click here to get my complete trading strategy! Please be advised that I swing trade and will often hold onto a position for > 1 month. What you do with your $ is your business, what I do with my $ is my business.
My recent Bitcoin Bubble Comparison - 3 Day Chart led to the following calls: < $5,750 by 11/15/2018 & my prediction for the bottom is $2,718 by 1/20/19 | My Bitcoin Bubble Comparison - Monthly Chart closely mirrored my price and time targets | Calling for $35 ETH before the end of 2018.
Previous analysis / Death cross with 9 and 34 MA’s, close below symmetrical triangle and a breakdown of horizontal support triggered a full entry
Position: Short BTC:USD from $6,353 and short ETH:USD from $205.20
Patterns: $5,600 target from symmetrical triangle was hit within 48 hours of breakdown
Horizontal support and resistance: S: $5,522 | R: $5,875 - $6,150
BTCUSDSHORTS: Bouncing hard and fast but still plenty of room to go before resistance
Funding Rates: Shorts pay longs 0.224% (wow!)
Short term trend (3 day MA): bearish
Medium term trend (8 day MA): bearish
Long term trend ( 34 day MA): bearish
Overall trend: Death cross provided an ideal short entry yesterday evening.
Volume: Finally!!!! If anyone tries to say that this is a bear trap / shakeout before breakout then refer them to the daily volume. When using a combo of the 5 major USD exchanges this is the highest we have seen in ~ 3 months.
FIB’s: (High of Feb 20th and low of Feb 6th')
Candlestick analysis: 1 = $5,863 | 1.272 = $4,262 | 1.4140 = $3,426 | 1.618 = $2,224
Ichimoku Cloud: 4h appears to be lining up with my horizontal resistance at $5,868
TD’ Sequential: Today closed a red 7 and we just opened a red 8
Visible Range: Gap in volume at $5,000 makes me think there will not be the support there that most expect
Price action: 24h: -10.24% | 2w: -10.59% | 1m: -9.28%
Bollinger Bands: Dat' bulge we have all been waiting for : )
Trendline: Connect top of May 5th to top of July 24th. I expect this to be the top of the down trend.
Daily Trend: Bearish
Fractals: Took out every last down fractal from 2018
RSI: Record low! High alert for bearish divergence. One one other time daily RSI was < 19.6 and a 18.32% bounce followed. If that happens again then price would rally to $6,332 (probably while alts have a flight to safety) and that would create a very similar bear trap that we saw in 2014 - 2015.
Stochastic: Monthly is falling into oversold territory. Monthly buy signal + RSI < 45 will be strong indicators of the bottom. Should be combined with weekly RSI < 30. All things to pay close attention to.
Summary: Already took profit on 25% of my BTC’ and ETH’ shorts due to RSI reaching record lows along with the daily TD 8 opening (will often get a 1-4 candle correction on a 7 or an 8 instead of a 9).
Now I am preparing for three options: a bounce that retests $5,868 - $6,150 for resistance. If that happens then I will be considering it the highest probability entry of the year. I expect there to be so big volume waiting to exit their longs at that price range.
Nevertheless I am paying close attention to the bear trap that followed the support breakdown in the 2014 - 2015 bubble (see charts above). The markets have a strong propensity to rekt both bulls and bears whenever possible. A short term bounce back to $6,300 would do exactly that and it is something to prepare for.
The main catalyst that could cause that is a flight from safety out of alts and back into BTC’. Could also see another pump caused by traders exiting Tether. That premium is back to 5% and has been inflating the price on USDT exchanges.
The last option I am watching for is a divergence in the daily RSI like the one that followed the last time it reached < 19.6. If that happens then I plan on exiting 80% - 100% of my position with the intention to re open at 10% - 18% higher.

BTC Bubble Comparison - Monthly ChartI believe that it is possible to beat the market through a consistent and unemotional approach. This is primarily achieved through preparing instead of reacting. Click here to learn more about how I use the indicators below and Click here to get my complete trading strategy! Please be advised that I swing trade and will often hold onto a position for > 1 month. What you do with your $ is your business, what I do with my $ is my business.
The monthly Stochastic and TD' Sequential are showing multiple similarities as 2014 - 2015. The last buy signal did a great job of calling the bottom and it also lined up with a monthly red 8. If that pattern continues then we should get a $2,880 bottom in February 2019 and then it should take 12 months to close back above $6,400. This lines up very nicely with the most recent Bitcoin' Bubble Comparison that I did on the 3D chart.

GPU over stock sell offWith the release of the new GTX1060, I believe this is a confirmation to sell off overstock due to much less global demand. Prep for correction.


Buy 110 support maybe and/ or Buy at 85$ rangeIf $110 doesnt hold then "the bubble of everything has popped" And buy at 84$

"All those dudes who bought early are so lucky, must be rich ""Omg, all those early investor traders must have made shit loads of moneizzz. Was so easy, you just buy some, and wait, it was raising all the time, any dumb dude would have been a millionaire!!"
No.
=>
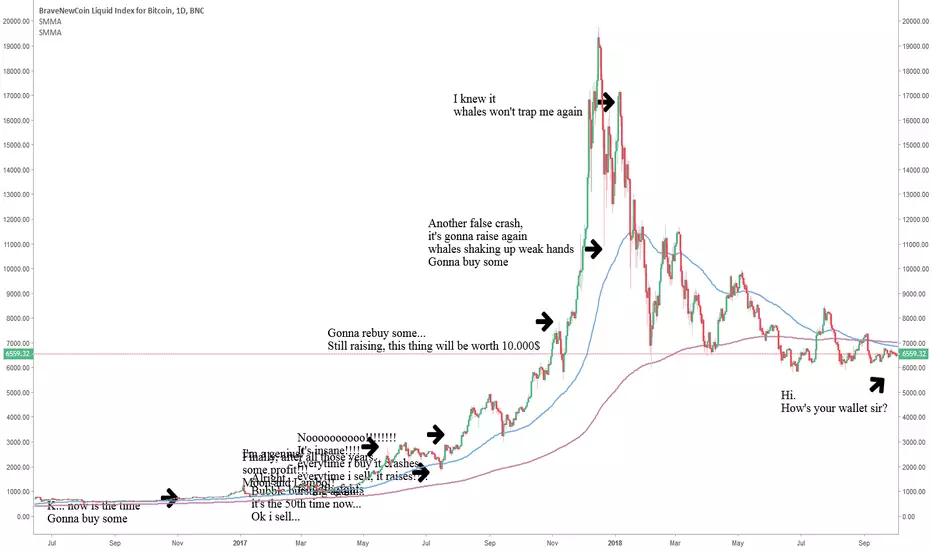
pop goes the bubble.i checked this on the 6 monthly as well and boy it looks parabolic as hell.
This is the monthly chart though.
The signal is clear as bloody day for me.
Finally my monthly indicators are literally ALL in unison.
Simple bearish divergence on the RSI.
Simple bearish divergence on the fast oscillator and collapsing close to the zero line - scary.
Simple bearish divergence on the slow oscillator.
Simple bearish divergence on the histograms on both fast and slow oscillators.
It's as if the stars are lining up.
I don't know about you.
But I'm GTFO stocks rn.
Come back in when poop hits the fan.

BTC USD nearly at decision timeWe know what altcoins will do. They will follow BITFINEX:BTCUSD so why bother on the others?
BTC is the main driver like gold is for silver and S&P is for other markets.
Very short analyse from my site.
Due to AT, we are targeting to the end of the 'after-bubble' triangle that is normally decision time.
We also have very nice channel of accumulation --> $6000 - $6800 where the main battles are.
My assumption is, we will almost hit the bottom of channel: ~ $6100 bounce up, test next support at ~ $6200 and then decide to go up to (depend of the market bullishness) or slowly go deeper for next levels.
Go up - 60%
Do down - 40%
How do you think?
Best Regards!
P4vlus


Bitcoin Bubble ComparisonHave amended my projections to: < $6,000 by October 4th and $2,860 by October 31st for the bottom.

descending triangleif breakdown occurs, looking to go back down to a few cents. maybe like 2 or 3 cents a pop. For those curious this chart doesn't show, but Stellar used to be worth less that 1 US cent in July of last year. theres no reason for it to be valued so high.

Trading Strategy for Parabolic Markets [Part 3]In part 1 I outlined an approach that I have been working on that is aimed towards trading parabolic markets. In part 2 I outlined 4 trades with entries, stop losses and risk:reward calculations. The best position (in terms of risk:reward) has been saved for last.
Notes: Tyler Jenks says, “All hyperwaves are bubbles but not all bubbles are hyperwaves.” This looks much more like a legit bubble than a hyper wave. Weekly chart has been included to illustrate that. | 200 MA > 10 MA > 50 MA | ADX is getting ready to cross 20 in confluence with the bull flag breakout | Weekly ADX getting ready to cross below 20 | Price is currently below 200 day MA and is acting as resistance | 50 week MA is also acting as resistance | Daily RSI = 56.81 and weekly RSI = 53 | Visible Range Volume Profile shows all of the volume at $19 - $50 and very little resistance at higher prices. Since this is not a hyperwave the VRPR and FIB Retracement levels will be very important. The profit targets are also much easier to recognize/calculate.
Q-2 Earnings Report: Deposits: Expected earnings per share: $1.54 vs $1.62 actual earnings per share for a +5.19% surprise. $996.7B vs Projection: $1.009T | Fixed income trading revenue: $308B vs Projection: $3.11B' | Sales from consumer banking and institutional clients: $8.25B & 9.691B for a growth of 2% & 3% respectively.
Time Analysis: Could see it gapping over the 200 day MA on Monday, could also see months of consolidation to follow death cross from 4/26 and ADX falling below 25 on weekly chart.
Possible Entries: Breakout above 200 day MA and 50 week MA - I have set a price alert at $75.59 | Breakout above local high of $81.54 (second price alert) | 50 and 200 day MA golden cross
Risk: Need new low to be established on the weekly after breaking through the 200 MA. If use current low then the risk is 21.25%.
Profit Targets: $125 (+56%) | $236 (+195%) | $399 (+398%)
Risk:Reward: Depends on how much is profit is capitalized at each target and where the next weekly low comes in. Suffice it to say this is the best r:r out of all the positions listed. When there are too many good opportunities for an entry then I like to use the risk:reward ratio to determine the best entry.
Part 1
Part 2
Thank you for reading! If you found this helpful then please like, comment and subscribe!

BTC Out of the BubbleI made this rough sketch on July 9, accurately predicting the dip to 6200 from 6800 and the pump to 8k, and unfortunately, I can't add my refinements to the original chart.
There are a number of notes added and more detailed refinements to this one.
Orginal Idea:

BTC to the BottomThis roughly follows classic bubble theory and Elliot's Wave pattern, continuing the pattern of a descending triangle down to the 80% retracement level - similar to what happened in 2011 and early 2015.

Basic Analysis for ETHUSD based on Bollinger Bands.Hello everyone,
This is my first educational idea on Tradingview and I hope it would be useful for many, your comments, supportive ideas or the counter ones are welcome. I admire sharing ideas in respectful way, after all no one has the whole image, and who claims that is not truthful with themselves, whoever they are.
Let me introduce myself first, I'm a blockchain enthusiastic who believes in the concept of decentralized networks, not only for money transaction solutions but also in the technology itself, what blockchain technology is capable to provide is massive. I'm not an experienced trader, I just started trading my self for less than 1 year, but I like analysis and looking at the bigger image, I usually go long with an appetite to hodl, usually it pays off, even if you bought at the peaks.
However, the crypto market is still lacking regulations, thus why we have this massive fluctuations in this market which is very profitable (at least for many) and also may lead to catastrophic situations if we don't double check on all factors surrounding any buy or sell order.
This basic analysis is based on a simple idea of Bollinger Bands on the weekly chart of ETHUSD, as we can see on the chart the down trend which is marked by a red "bubble" is almost finished, we just started a new yellowish in color bubble, but this bubble is still young and lacking the right momentum for a massive bull run like the one we had by the end of the last year, in my opinion side ways trade will keep playing for the next 3 months (maybe less, maybe more) in values between 300-400$ before a breakout. This expansion and deflection of the bubbles implies on all cryptomarket, including BTCUSD pair.
The main question is, for how long this bottle neck would last? Did we get through it or not yet?
I don't think there would be a breakout for the next major uptrend before touching the 350$ levels again, it's the next main support for ETHUSD on the weekly chart, which is a strong support zone and it was active many times especially in the end of the last year. However, that level could not be the bottom of Ethereum, after all ETHUSD started in way less values last year, from 7 to an impressive figure of 1400$, this led to drawback in the market and we are experiencing that right now. We don't know yet how far in terms of price and time this correction would last, but I don't think ETHUSD would go less than 3 digit number in the foreseen future. After all Ethereum is a protocol and it has many implications that would be useful for businesses and organizations, it gained a lot of attention and after the rally last year which gained a lot of exposure that won't wear off easily.
This idea is not obsolete nor complete, but I would like to add updates to it when the market starts to show where is it going exactly, your comments and arguments would be very valuable and feel free to express in the comments section.
This idea is published for educational purposes only, and it shouldn't be considered as a financial advice.
