Gold long term targetsAs I personally think we will see gold hitting 5600$!
Based on what?
Well this is why I think what I think !
My first target hit long ago(as you can see in the image) and I sold all my Long term position already...Sadly.
I honestly thought price would have retraced a bit but instead it didn't even stop.
This strongly convince me , now that we have created a monthly FVG above 0.75 DRT level, that price will retrace in it and that will give me an advantage to open a light swing trade to last target 5600$.
Check it out and see if you like the idea.
Bullishpattern

XAUUSD 1H – Bullish Continuation with Mapped TargetsGold (XAUUSD) is trading in a strong bullish structure on the 1H timeframe, characterized by consistent higher highs and higher lows. Price is currently consolidating near recent highs, indicating healthy price action and potential continuation rather than reversal.
This chart highlights:
A clear buy-on-dip zone aligned with previous demand
A well-defined invalidation level to manage risk
Multiple upside targets based on market expansion and liquidity zones
As long as price holds above the key structure support, the bullish bias remains valid. Breakout or pullback confirmations from the marked zone may offer continuation opportunities in the direction of the trend.
⚠️ A strong close below the invalidation level would signal a possible shift into correction or consolidation.
🔑 Key Concepts Used
Market Structure (HH / HL)
Demand & Resistance Zones
Trend Continuation Logic
Risk-to-Reward Target Mapping

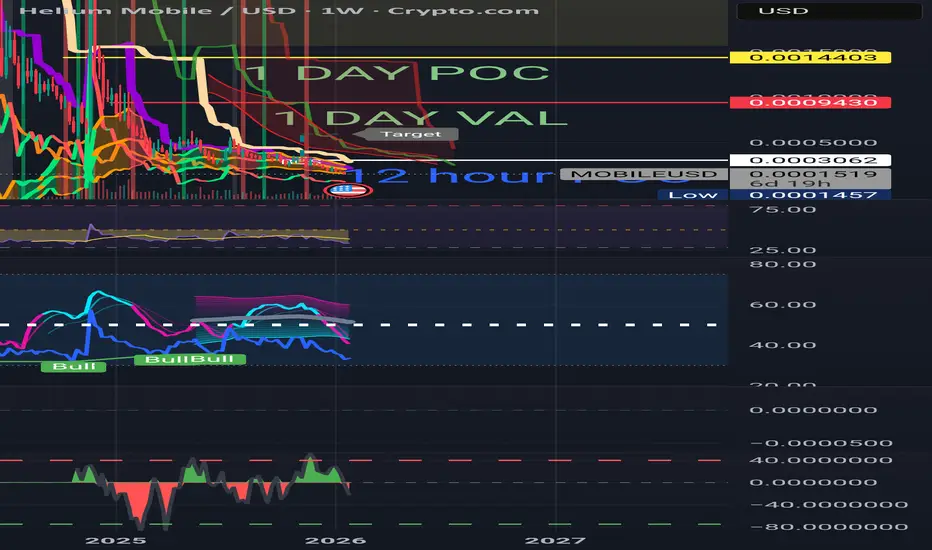
Mobile is ready againBad news & then no news for a while.....
Volume profiles on multiple time frames show some fire is coming IMO...
I lean towards the "revolution of crypto"... Look for 10 cents???
O yeah, they also did a delist and made many panic sell before & after that. Reminds me of buying a F ton of XRP below. I made money of the pump before the coinbase delisting also.
Something has me seeing massive potential beyond most our expectations or it's just another shit coin.
Good luck & REMEMBER NOTHIMGNG I SAY IS FINANCIAL ADVICE
#BTC Bitcoin - UP and then DUMP?Walked trough many analytics, and they have one in common plan, that we are going for correction to 74.000 for #BTC
Sentiment is very bearish across #Crypto and in my opinion we need to start an Uptrend towards $100.000 and only then probably could see correction.
What do You think about this kind of plan?

LONG BNBLONG POSITION
BUY
Entry@879.22-834.00
Stop@803.53
Profits@949.89, @994.75, @1.09307
FOR EDUCATIONAL PERPOSES ONLY

Bullish PennantPAKOXY Analysis
Closed at 325.50 (23-01-2026)
Bullish Pennant Pattern appeared.
Crossing & Sustaining 345 - 348 with Good Volumes may
lead it towards 400 & then 450.
However, breaking 300 may bring more selling pressure towards
275 - 280

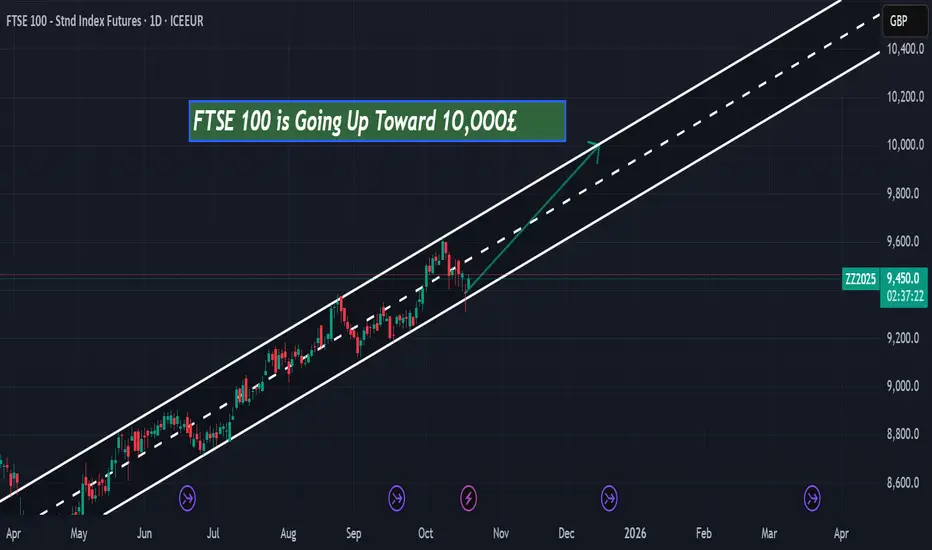
FTSE 100 Outlook: Is the Index on Track to Reach £10,000 by the According to my technical analysis, the FTSE 100 has been moving within a well-defined bullish channel since April 2025. The price structure continues to show higher highs and higher lows, confirming sustained buying pressure and a strong uptrend.
As long as the index remains within this rising channel, the bullish momentum is likely to persist toward the £10,000 level. Based on the current trajectory, this target could be reached in the coming months or by the end of 2025.
NIFTY at Key Support – Foundation for the Next Bull RallyThis is the daily timeframe chart of NIFTY.
NIFTY is showing strong support in the 24,850–24,950 zone. This zone is technically important due to multiple confirmations:
EMA support near 24,956
Fibonacci support near 24,938
Additionally, the channel support lies in the 24,850–25,050 range, strengthening the overall support structure.
On the upside, immediate resistance is seen around 25,500–25,700, while the next major resistance is placed near 26,400–26,500.
If this support zone holds, NIFTY is well-positioned for the next bullish move towards the mentioned resistance levels.
view invalid below 24800.
Thank you.

Trend Continuation DOTDOT - Trend Continuation Setup
In my previous post, I outlined the primary scenario in which we had already seen an A- and B-wave, followed by a C-wave completing within the 23.6% to 38.2% Fibonacci retracement zone.
This scenario has now played out as expected.
From the bottom of the (C)-wave, I currently assume that we have already seen an impulsive Wave (1) of a new 5-wave impulse structure.
However, this move only slightly exceeded the level of the previous Wave (3), which is why I do not yet consider the trend fully confirmed.
For proper trend confirmation, I would now like to see a shallow / flat Wave (2) correction. Such a controlled pullback would allow price to build energy and then break the previous high impulsively.
This would also increase the probability of DOT breaking above the Daily 50 EMA, which would further strengthen the bullish case.
As long as this structural scenario remains intact, I consider the higher-timeframe bias to remain on the long side.
Alternative Scenario (Lower Probability)
An alternative - less likely, but still possible - scenario is that the move previously labeled as Wave (3) was in fact already a Wave (5).
If this is the case, the prior impulse would be fully completed.
Under this scenario, we would have to expect a full corrective move of the entire impulse before any sustainable trend continuation can develop.
Key confirmations would be a clear break in structure and a lack of impulsive behavior on the upside.
At the moment, this is not my preferred scenario. However, if price action and structure start to shift in this direction, I will publish a separate post including a full visual breakdown of this alternative count.

NBIS | A.I. Centric Cloud Platform | LONGNebius Group NV is a technology company that provides infrastructure and services to AI builders worldwide. It offers Nebius AI, an AI-centric cloud platform provides full-stack infrastructure, including large-scale GPU clusters, cloud services, and developer tools. The company also operates through specialized brands: Toloka AI, which partners in data for generative AI development; TripleTen, an edtech platform focused on re-skilling individuals for tech careers; and Avride, which develops autonomous driving technology. Nebius Group was founded by Elena Kolmanovskaya, Ilya Segalovich, Mikhail Fadeev, and Arkady Volozh in 1989 and is headquartered in Amsterdam, the Netherlands.

PRAENG pyramiding new price action 1. Set up - reversal from takeout / support zone
2. Trend Bullish
3. Fake out gave sharp rally
4. Probably target have room for 100% ROI

Inverse H&S2020 Analysis
Closed at 120 (15-01-2026)
Inverse H&S pattern appearing along with Bullish Divergence.
Immediate Resistance seems to be around 125 - 126.
Crossing & Sustaining this level may lead it towards 150+
However, it should not break the right shoulder now.

BMEX – The OG Perps Token Coiling for a Violent Mean-ReversionBitMEX birthed the perp casino long before Binance, Bybit and the rest. Its token has done what most neglected OGs do after launch: bleed inside a clean descending channel while nobody cares.
Now:
• Price has been grinding along the lower half of the channel and just put in a rounded base near the lows.
• Each push down is getting shallower, while bounces are stretching further – classic late-stage compression.
• A reclaim of the mid-channel (dotted line) opens the door for a full channel mean-reversion, with room toward the upper boundary and beyond if we see real FOMO.
In a market where new shiny memes keep rug-pulling, I’m watching the forgotten infra plays – and BMEX fits that bill: OG perp venue, tiny cap, ugly chart that finally looks ready to flip.
I’m not chasing green candles here; I’m stalking the channel break + retest for confirmation. Until then, this sits on my “potential face-melter” list.
As always: not advice, just the map. Trade your own plan.

hopes for a inverse head and shoulder pattern a good contestant looking for inverse head and shoulder pattern in ZOMATO(ETERNAL)

RTY / IWM Weekly: Cup & Handle Projection to $3280A classic Cup and Handle formation has developed on the weekly chart of the [b ]Russell 2000 (RTY) ; this structure is also visible on the IWM ETF.
My target is based on the depth of the Cup, which projects a measured move to $3280 . This represents a potential 24% upside from current prices.
Not Financial Advice. For educational purposes only.

AAPL – Bullish Flag If the Catalysts Show UpApple is pulling back into a descending flag after a strong multi-month rally. This still looks like a healthy consolidation if the next move higher is backed by fundamentals. The bullish case needs catalysts to trigger: iPhone 17 supply catching up to demand, Services growth holding in the mid-teens (high-margin EPS leverage), and gross margins staying resilient despite higher AI spend.
If these start to confirm and price pushes higher, the flag can resolve to the upside. If not, a failure could lead to a minor correction toward the anchored VWAP, which would still be consistent with the broader bullish structure. The oversold RSI suggests downside may be limited near-term, supporting the idea of consolidation rather than a full trend break.

Maybe a new ATH ?as we can see the market still bullish in the high time frames, but also there is a FVG in the daily hit on thursday, so thats another strong confirmartion. And now if we look at 4h time frame we have a FVG and an order blocks to be tested.
after that we can see a probable continuation toward the last week highs.

GBP/USD Possible imminent Longs My bias on GU this week is aligned with the rest of the market — looking for short-term bullish continuation. Price is currently reacting from a 12hr demand zone, and I expect this area to hold given its prior validation.
There is also a deeper, more discounted demand zone sitting at the extreme of the recent bullish structure, which remains a secondary area of interest if price pushes lower.
Confluences for GU Buys:
• Overall structure remains bullish, despite a recent CHOCH to the downside
• Higher-time-frame bias is still bullish unless we see a clear BOS to the downside
• Clean 12hr and 1hr demand zones in close proximity
• Price is slowing down, increasing the probability of a stronger reaction
• DXY approaching supply, supporting potential upside in GU
P.S. Since we’ve seen a change of character, this bullish move may be corrective, potentially leading into a reaction from a higher supply zone. Trade with awareness and adapt to price.

NIFTY Analysis: Crucial Support Levels and Trend Reversal ZonesNIFTY 26500 CE – February Expiry
This is the 15-minute timeframe chart of NIFTY 26500 Call Option (Feb Expiry).
The chart is indicating a strong support zone in the range of 140–150.
If the option price holds above this support zone, a reversal can be expected from this level.
This may lead to positive upside movement in the NIFTY 26500 CE.
THANK YOU !!

Bullish retest possible on $NEARBullish retest possible on CBOE:NEAR 🚀
Key support to be maintained for this setup: 1.580 - 1.600$
I remain cautious under 1.840$ daily basis (key resistance weekly).
A breakout above with fresh volume would lead to a huge bull pressure 📈

GBPUSD: Buy Continuation After Wave 4 CorrectionHappy New Year 2026! We're back in business. Cable remains bullish with clear buy setup after structural pullback completion.📊 Overall Trend Analysis: Primary Trend: BULLISH ✅The GBPUSD (Cable) maintains its upward trajectory. The larger structure remains intact with clear bullish momentum.🌊 Wave Structure Breakdown: Wave 3 (Momentum High): Completed ✓
Strong upside move establishing the bullish momentum high. Wave 4 (Structural Pullback): Completed ✓
Healthy correction retracing to structural support. Current Position: Ready for Wave 5 (Final Bullish Leg)📈
Price Formation Analysis: Key Pattern Identified: Higher Low (HL) Retracement The pullback has formed a Higher Low, which is the classic bullish retracement pattern. This HL formation confirms:
✅ Buyers stepped in at higher levels
✅ Structural support held
✅ Uptrend integrity maintained
✅ Buying is now allowed for continuation
Expected Move:
Price should break above Momentum High 3 to complete the bullish wave structure and form Wave 5.💼 Trade Execution Plan:
Buy Entry: Above 1.3499
Wait for break and close above this level to confirm continuation.
Stop Loss: 1.3482
Risk: 17 pips
Invalidation if price breaks below, suggesting deeper correction.
Targets:
T1: 1.3604 (105 pips potential)
T2: 1.3662 (163 pips potential)
To T1: 6.2:1
To T2: 9.6:1
🎯 Trading Logic:
Why This Setup Works:
Trend Alignment: Trading WITH the bullish trend (highest probability)
Wave Structure: Clear Wave 4 pullback completion
HL Pattern: Higher Low confirms bullish structure
Break & Retest: Entry above 1.3499 confirms momentum return
Clear Invalidation: Stop below 1.3482 keeps risk tight
Strategy:
Wait for price to break above 1.3499, confirming buyers are back in control. This breakout triggers Wave 5 continuation toward targets.
Key Levels Summary:📍 Entry Zone: Above 1.3499
🛑 Risk Management: Stop at 1.3482
🎯 First Target: 1.3604
🎯 Extended Target: 1.3662
📊 Wave Position: Ready for Wave 5 bullish completion
Happy New Year 2026! Let's start the year with clear structure and high-probability setups. 🎆👍 Hit the boost button if you're trading this setup
👤 Follow for continued GBPUSD analysis
💬 Happy New Year traders! 🎉

$ETC - Bullish breakout & Setup BME:ETC - Bullish breakout & Setup 📈
Upper levels i'm watching:
⚠️13.60$
🎯14.10
🎯14.80 - 15.10
🎯15.70
🎯16.50
Pump potential: 15%+ 💥

ONDO - BULLISH OUTLOOK: LSE:ONDO - price analysis:
Strong bullish momentum; but key resistances ahead
