Candlestick Analysis
Adani Green – High-Risk Momentum Play with 30% Upside PotentialSummary
Adani Green has broken out above the critical ₹1,020 resistance level with convincing volume and positive price action. The structure suggests a short-term reversal from the prolonged downtrend. Historically, once breakouts are confirmed, the stock has shown rapid upward moves — for instance, a 48.7 percent surge in November 2024 following a similar setup.
The current breakout targets the ₹1,360 zone, which represents a 32 percent move from the breakout level and corresponds to a prior key supply zone.
Target and Time Frame
Target Price: ₹1,360
Estimated Time Frame: 4 to 8 weeks
(based on previous breakout velocity, momentum strength, and short squeeze potential)
Risks
Valuation remains extremely stretched with a P/E near 100. The market is pricing in multi-year forward growth
High leverage is a structural concern. Debt-to-equity is 6.6x, and a missed execution milestone or policy change—especially the end of the ISTS waiver in June 2025—could lead to volatility
RSI nearing overbought zone. Minor pullbacks or consolidations may occur before continuation
Disclaimer
This analysis is for informational purposes only and does not constitute investment advice or a recommendation to buy or sell any securities. Please do your own research and consult a qualified financial advisor before making investment decisions.
EURUSD: Bullish Continuation Confirmed 🇪🇺🇺🇸
WIth a high momentum bullish candle that EURUSD formed on Friday,
the pair successfully violated a major daily resistance cluster.
I believe that the market will rise even more.
Next goal for the buyers will be 1.186
❤️Please, support my work with like, thank you!❤️
I am part of Trade Nation's Influencer program and receive a monthly fee for using their TradingView charts in my analysis.
GOLD (XAUUSD): 5000 Level Soon
Gold closed in a very strong bullish mood, breaking an intraday
horizontal resistance zone.
There is a high probability, that the market will reach 5000 psychological
level soon after the market opening.
As 5000 level is a very critical structure, traps and manipulations
will likely occur after its test. I will monitor a price action and will
provide an update shortly then.
❤️Please, support my work with like, thank you!❤️
I am part of Trade Nation's Influencer program and receive a monthly fee for using their TradingView charts in my analysis.
A+ Setup Consolidation Breakout StrategyConsolidation Breakout Strategy (Summary)
In this strategy, the first step is to identify a clear consolidation zone and mark it with a box to define the trading range visually. Once price is ranging, we wait patiently for a valid breakout or breakdown with a strong candle close outside the range.
If you want additional confirmation before entering a trade, it’s important to recognize candlestick patterns. Understanding patterns such as Doji, Bullish/Bearish Engulfing, Hammer, Shooting Star, Morning Star, Evening Star, and others will significantly increase the accuracy of your execution.
After the breakout, we do not enter immediately. Instead, we wait for a retest of the breakout level. The retest candle becomes our Point of Interest (POI) and serves as the execution entry, ensuring the trade aligns with both price action and candlestick confirmation.
Stop-Loss Options
Two stop-loss methods can be used:
1. Aggressive Stop Loss
• Placed below the low of the retest candle (for buys) or above the high (for sells).
• Provides better risk-to-reward, but has a higher chance of being stopped out, especially on lower timeframes.
2. Conservative Stop Loss
• Placed on the opposite side of the consolidation zone.
• Offers more protection against fake breakouts and is more suitable for consistent and prop-firm style trading.
Take-Profit Methods
Primary TP — Price Projection (Measured Move)
• Measure the full height of the consolidation range.
• Project the same distance from the breakout point in the direction of the move.
• This projected level is used as the main target, as shown on the chart.
This method is especially useful when price is trading in new territory or near all-time highs, where no clear resistance is present.
Trailing Stop for Trend Continuation
Since price does not move in a straight line and often forms new micro-ranges during trends, a trailing stop approach is used to capture extended moves:
• After price creates a new consolidation, move the stop loss below the most recent range low (for buys) or above the range high (for sells).
• Continue trailing the stop behind each new structure until stopped out.
This is a trend-following management method designed to maximize reward-to-risk and allow winners to run.
Alternative Trailing Methods
Traders may also trail stops using indicators such as:
• 21 SMA, or
• SuperTrend
In this case, the stop loss is trailed below (for buys) or above (for sells) the indicator as long as trend conditions remain valid.
Future Use of the Range Zone
The original consolidation zone is extended to the right because it often acts as a future support or resistance area. As shown on the chart, price later returned to the range, respected it as support, and continued higher — confirming the importance of these zones.
Performance Expectation
When all rules are followed correctly — proper consolidation, confirmed breakout, retest entry, and disciplined risk management — the realistic win rate for this setup is approximately 50% to 65%, with positive expectancy due to favorable risk-to-reward ratios.
⸻
This Consolidation Breakout Strategy is just one of my A+ setups. There are many more high-probability strategies I use and will be sharing soon.
Cabeero
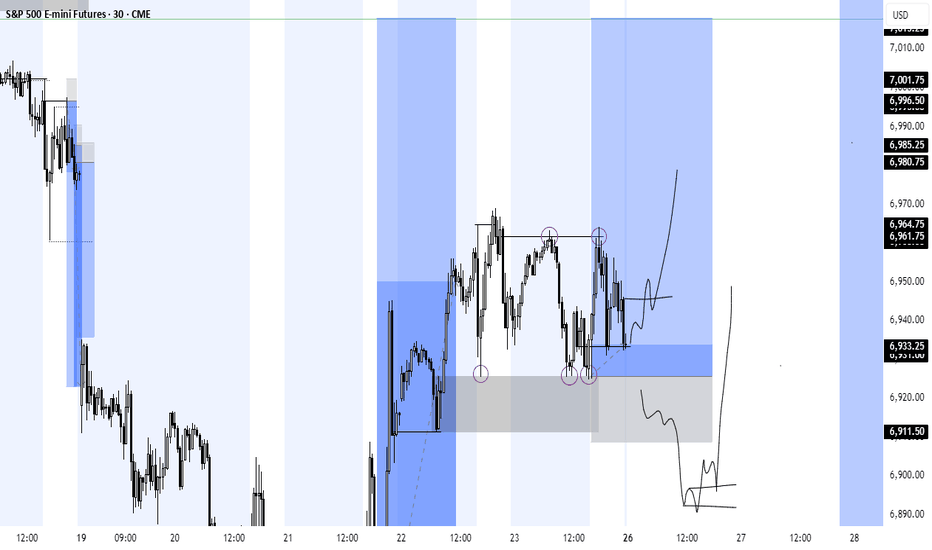
S&P 500 updateI had another scalp buys at this area before market close, but am not sure if it's going to hold.
Am still bullish on S&P, I have 2 swings buys below that I shared for free here. Price might violate my recent buys and move lower to fill imbalances before hitting target or it will break higher and use the OB as identified, but am still holding the buys.
CRUDE OIL (WTI): Bullish Continuation
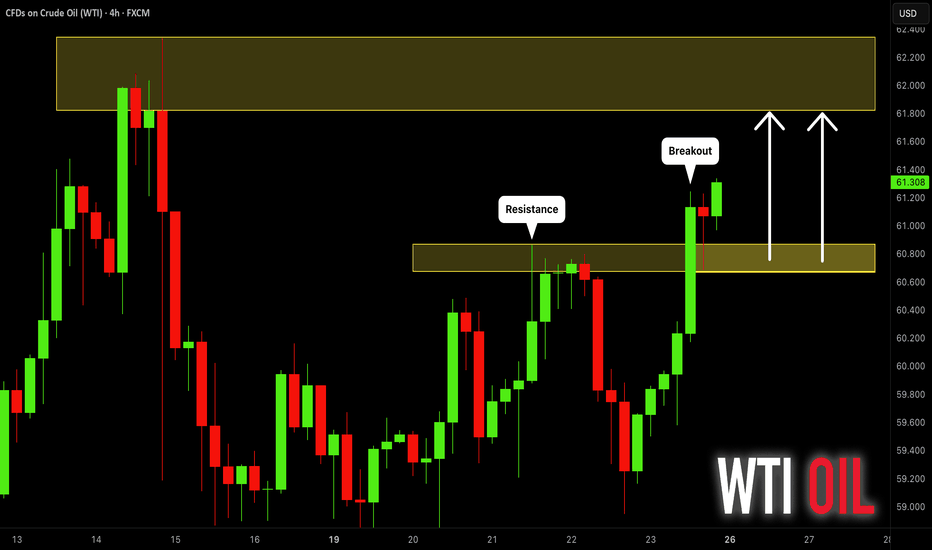
WTI Crude Oil is going to continue rising, following
a confirmed bullish break of structure on a 4h time frame.
Next resistance - 61.8
❤️Please, support my work with like, thank you!❤️
I am part of Trade Nation's Influencer program and receive a monthly fee for using their TradingView charts in my analysis.
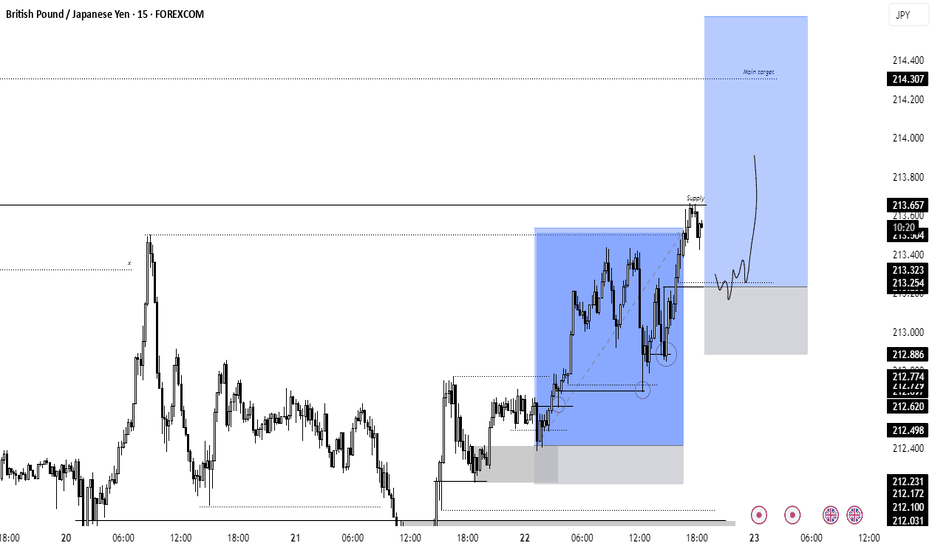
Long trade
Pair GBPUSD
Buyside trade
Thu 22nd Jan 26
4.00 pm LND to NY overlap
Entry 1.35047
Profit level 1.35921 (0.647%)
Stop level 1.34810 (0.175%)
RR 3.69
GBPUSD — Sentiment & Narrative Analysis
Market Sentiment: Buy-Side Favoured (Conditional Continuation)
Higher-timeframe context shows sell-side liquidity already mitigated from the prior range, with price transitioning into acceptance above the key mid-range equilibrium. The market structure reflects a shift from corrective behaviour into controlled expansion, rather than impulsive distribution.
During the London–New York overlap, price held above the prior breaker / reclaimed resistance zone, signalling institutional acceptance rather than rejection. This overlap window typically serves as a validation phase, and the price's failure to re-enter the lower range suggests strong buy-side sponsorship.
Volume and execution clusters around the entry zone indicate absorption of residual sell orders, with price respecting the premium PD-array rather than seeking discounts. This behaviour is consistent with late-stage accumulation transitioning into continuation rather than exhaustion.
Psychologically, the market is positioned for a clean buy-side run toward resting liquidity above recent highs, with minimal incentive for price to rebalance lower unless the structure is invalidated.
Long trade
ONDOUSDT Perpetual (15-Minute)
Sentiment Summary
Bias: Short-term Buy-side (mean-reversion → continuation)
Session Context: NY Session PM
Structure Context: HTF corrective → LTF accumulation resolved
Market Context:
ONDO experienced a sharp sell-side expansion, aggressively clearing downside liquidity and reaching a clear discount extreme. That sell-off exhausted momentum and was followed by base-building and acceptance, signalling a transition from liquidation to accumulation.
Narrative:
After the sell-side sweep, price stabilised into a range, forming higher lows and reclaiming internal structure. The recent upside move shows bullish displacement and FVG creation, indicating that buyers are now in control on the lower timeframe. This behaviour suggests the market has completed its corrective phase and is rotating back toward value and prior supply.
Liquidity & Order-Flow:
Sell-side liquidity is fully harvested below the range
Bullish FVGs forming and holding as support
Buy-side liquidity resting above the consolidation highs acts as the draw
Execution Logic:
The buy-side bias is justified following discount mitigation + structural reclaim, targeting a rotation toward prior highs/imbalance.
Entry 5min TF
22nd Jan 26 - 600+ Ticks To End The Week! Bullish Closure Today With Price Supporting The Upper Range Of The NWOG C.E.
I Will Be Studying How Future Down Close Candles Support The Mid-Week Bullish Thesis Up-to $26,200.
Inefficiency @ $25,764.75 - $25,801.50 Is What I Am Looking At To End The Week With A Bang!
Every Candle Has Psychology — Let’s Decode 3 of ThemHave you ever thought that every single candle carries its own psychology behind it?
If not, don’t worry — that’s exactly what this educational idea is about.
In this lesson, we’re going to break down the psychology behind three of the most popular candles, using a skeptical and practical approach.
In this post, I’ll focus only on single-candle structures.
If you’d like me to cover 2-candle or 3-candle patterns next, drop a comment and let me know.
Let’s start with one of the most famous candles of all time:
🔨 1) Bullish/Bearish Hammer — What’s Really Happening?
Assume we’re looking at a bullish hammer.
Sellers tried everything they had to push price lower.
But buyers stepped in aggressively, forced price back up, and closed the candle near the top.
Psychologically, this tells us two things:
Sellers didn’t just fail — they got liquidated
Buyers gained confidence, and new long positions may fuel upside momentum
The small upper wick represents the last desperate attempt by sellers.
Best execution idea:
Placing a stop-buy above the upper wick.
Why?
Shorts above the wick get liquidated
The sellers’ final defense is removed
Price can accelerate upward with momentum
Win rate improves significantly when:
The hammer forms after an uptrend
Price is aligned with moving averages (e.g. SMA)
🔥 2) Bullish/Bearish Engulfing — Momentum Shift Confirmed
This is one of my personal favorites.
Sellers print a solid bearish candle.
The next candle fully engulfs the previous body to the upside.
What does this mean?
Sellers gave up.
Not gradually — instantly.
Buyers completely dominate the zone, reclaiming all previous losses and closing strong.
This candle is especially powerful when it forms:
After a pullback into a box range
Near a trendline
After a support/resistance break
Psychologically, it often signals:
The start of the second impulse wave
A strong continuation opportunity
A very clean and reliable trigger when context supports it.
🧱 3) Marubozu — Beginning or End?
Marubozu candles usually appear in two very different places:
At the end of a trend
At the start of a new trend
Understanding which one you’re dealing with is critical.
Signs of a trend-ending Marubozu:
Price reaches major levels (e.g. above 4H Pivot Points)
A long, aggressive trend precedes it
RSI is overextended
Price is near strong support or resistance
Result?
➡️ Expect range or correction, not continuation.
Psychology:
Participants exhausted themselves just to reach the level —
not to break it.
Signs of a trend-starting Marubozu:
Price was previously ranging or boxed
Volume was compressed before the move
RSI is far from extreme levels
Orders accumulated inside the range
The longer price stays inside a range,
the more orders build up — and once released, the move becomes sharp and fast.
🧠 How to Trade Them Properly
End-of-trend Marubozu:
Take profits or close positions.
Start-of-trend Marubozu:
You can enter, but it’s smarter to:
Wait for confirmation
Enter on later triggers with smaller stop loss
Improve R/R ratios
By the way, I’m Skeptic , founder of Skeptic Lab.
I focus on long-term performance through psychology, data-driven thinking, and tested processes.
That’s it.
Now get outta here.
Nifty Analysis EOD – January 23, 2026 – Friday🟢 Nifty Analysis EOD – January 23, 2026 – Friday 🔴
106-Day Support Snaps: Bears Breach the Gate ?
🗞 Nifty Summary
The Nifty started with a mild 27-point Gap Up, entering a high-voltage battle zone between 25,250 ~ 25,350. This 100-point range saw wild intraday swings that trapped both sides before a clear direction emerged.
At 11:35 AM, the bulls finally gave up, leading to a decisive IB Low breakout. The bearish sentiment accelerated as the PDL (Previous Day Low) was breached at 1:15 PM.
Despite a brief attempt to hold the 25,180 level, the index plummeted to its “last resort” support of 25,060, closing the session at 25,048.65 (-0.95%). This marks the lowest close in 72 sessions (106 days), dragging the index back to levels last seen on October 8, 2025.
🛡 5 Min Intraday Chart with Levels
🛡 Intraday Walk
Today was a session of systematic distribution.
The morning’s 100-point “tug-of-war” served as a distribution phase before the floodgates opened. Once the 25,250 floor was lost, the slide was relentless.
The most significant technical event was the daily close below the channel’s bottom band. While the Jan 21 low of 24,920 still stands as the final line of defense, today’s close has significantly weakened the reversal thesis, shifting the focus toward a potential bearish continuation.
📉 Daily Time Frame Chart with Intraday Levels
🕯 Daily Candle Breakdown
Open: 25,344.60
High: 25,347.95
Low: 25,025.30
Close: 25,048.65
Change: -241.25 (-0.95%)
🏗️ Structure Breakdown
Type: Strong Bearish candle (Marubozu-style).
Range: ≈ 323 points — High intraday volatility.
Body: ≈ 296 points — Aggressive, unchecked selling pressure.
Upper Wick: ≈ 3 points — Absolute lack of buying strength at the open.
Lower Wick: ≈ 23 points — Minimal demand even at the extreme lows.
📚 Interpretation
This is a high-conviction Bearish Breakdown candle. Opening at the day’s high and closing near the day’s low suggests that the market is in a “Sell on Rise” mode. The breach of the 106-day closing low indicates that the medium-term trend has been severely damaged, and the previous recovery attempts are being invalidated.
🕯 Candle Type
Bearish Marubozu-Style / Breakdown Candle — Signals powerful downside momentum; further weakness is expected unless the index reclaims the channel bottom immediately.
🛡 5 Min Intraday Chart
⚔️ Gladiator Strategy Update
ATR: 256.30
IB Range: 98.85 → Medium
Market Structure: Balanced
Trade Highlights:
10:18 Long Trade: SL Hit (Caught in the morning battle whipsaw).
11:38 Short Trade: Target Hit (R:R 1:1.73) (IBL Breakout).
13:16 Short Trade: Target Hit (R:R 1:3.03) (PDL Breakout).
Trade Summary: A disciplined performance despite the early stop-loss. The strategy correctly pivoted to the short side as the balance shifted. The PDL breakout trade was the star of the session, capturing the vertical drop to the 25,060 support zone with a strong 1:3.03 R:R.
🧱 Support & Resistance Levels
Resistance Zones:
25180
25270
25310 ~ 25335
25430
Support Zones:
25025 ~ 25000
24970
24920 (Critical Floor)
24840
24770 ~ 24740
🧠 Final Thoughts
“The 24,920 level is now the only shield left.”
The daily close below the channel is a major red flag.
If the 24,920 low is breached in the upcoming sessions, the bullish reversal sign from January 21 will be completely negated.
At that point, the structure will confirm a bearish continuation with targets shifting toward the 24,600 ~ 24,400 zone. Until then, expect the bears to maintain their grip, using every minor bounce as a supply window.
✏️ Disclaimer
This is just my personal viewpoint. Always consult your financial advisor before taking any action.
GBP/CHF: Gap is Going to Be Filled!I spotted a nice gap down opening on 📈GBPCHF.
Following a significant downward trend, the pair is now showing a strong indications of bullish sentiment.
A bullish breakout from the neckline of a cup and handle pattern has been observed on the 4-hour timeframe, occurring after a test of daily support.
It suggests that the price is likely to increase and close the existing gap.
The target is set at 1.0731.


