Candlestick Analysis

Nifty Analysis EOD – January 14, 2026 – Wednesday🟢 Nifty Analysis EOD – January 14, 2026 – Wednesday 🔴
Harami Cross at the Edge: Bulls and Bears Battle for the 25,600 Line.
🗞 Nifty Summary
The Nifty opened with a 60-point Gap Down, but buyers quickly intervened, filling the gap within minutes to test the 25,750 ~ 25,780 resistance zone. After multiple failed attempts to break out, the index slipped back toward the day’s low, finding temporary refuge at a bullish trendline.
A second recovery attempt successfully breached the IBH and the resistance zone, marking a day high of 25,791.75.
However, the joy was short-lived; a sharp rejection followed, snapping the trendline and dragging the index through the CDO and IBL. Nifty eventually tested the PDL (25,603) with precision, sparking a late 111-point bounce to close at 25,665.60.
The result is a Harami Cross pattern on the daily chart, signaling deep indecision as the index remains trapped within the previous day’s range.
🛡 5 Min Intraday Chart with Levels
🛡 Intraday Walk
Today was a theatre of high-octane drama. The charts show a relentless tug-of-war, with the index climbing and sliding sharply as both camps fought for dominance.
The rejection from the 25,790 area confirms that sellers are still heavily active at higher levels, but the “Double Bottom” effect near 25,600 (testing today’s low of 25,603.95 against yesterday’s 25,603.30) shows that bulls are not ready to surrender this psychological floor.
The intraday trendline failure at 1:30 PM was the pivotal moment for bears, while the final recovery from the PDL saved the bulls from a catastrophic breakdown.
📉 Daily Time Frame Chart with Intraday Levels
🕯 Daily Candle Breakdown
Open: 25,648.55
High: 25,791.75
Low: 25,603.95
Close: 25,665.60
Change: −66.70 (−0.26%)
🏗️ Structure Breakdown
Type: Doji Candle (Harami Cross).
Range (High–Low): ≈ 188 points — moderate volatility.
Body: ≈ 17 points — weak directional conviction.
Upper Wick: ≈ 143 points — massive rejection from higher supply zones.
Lower Wick: ≈ 45 points — localized buying support near the PDL.
📚 Interpretation
The Harami Cross, appearing within the massive range of January 13, indicates a total standoff. The long upper wick (143 points) is the most telling feature, proving that every attempt to sustain above 25,750 is being met with aggressive selling. However, the fact that Nifty closed 15 points above its opening (CDO) and held the 25,600 support suggests a base is attempting to form.
🕯 Candle Type
Bearish Rejection / Indecision Candle — Highlights overhead supply; the market is coiling for a breakout from this Harami structure.
🛡 5 Min Intraday Chart
⚔️ Gladiator Strategy Update
ATR: 211.39
IB Range: 123.15 → Medium
Market Structure: Balanced
Trade Highlights:
11:27 Long Trade: SL Hit (Bulls trapped during the failed IBH breakout).
13:32 Short Trade: Target Hit (R:R 1:2.59) (High-conviction Trendline Breakout).
14:23 Short Trade: SL Hit (V-shape bounce from PDL support).
Trade Summary: A mixed day for the strategy. While the 1:2.59 short trade perfectly captured the trendline collapse, the extreme volatility near the range extremes (IBH and IBL) resulted in two stop-loss hits. The net result remains protective in a non-trending “Balance” market.
🧱 Support & Resistance Levels
Resistance Zones:
25693
25750 ~ 25780 (Major)
25820
25855 ~ 25880
Support Zones:
25600 (Critical)
25550
25475
🧠 Final Thoughts
“The 25,600 Line in the Sand holds... for now.”
Today confirmed that while the bulls have the heart to defend 25,600, they lack the lungs to climb past 25,800.
Today confirmed that while the bulls have the heart to defend 25,600, they lack the lungs to climb past 25,800.
We are officially in a “Squeeze” zone. The market is coiling, and the next directional move will be determined by a breakout from this tight “Harami Cross” structure.
For tomorrow, I’m watching the 25,600 level like a hawk; if it snaps, the floor is far below, but before that, bulls might attempt 25750 once again.
✏️ Disclaimer
This is just my personal viewpoint. Always consult your financial advisor before taking any action.

German 40 with potential shooting star reversal in daily charttoday - with current status - bearish movement.
waiting for closing to confirm potential end of strong bullish impulse of the last 2 weeks.

NZDCAD ____ BEARISH TRADE IDEAHi Guys,
I do expect a bearish January... and right now price just cleared relatively equal highs and printed a strong bearish rejection candle.
My expectation is that we run out Nov 2025 low.
Cheers,
Jabari

GOLD (XAU/USD): Confirmed BoS & More GrowthI see clear confirmed break of structure and a violation of a significant intraday horizontal resistance on a 4-hour timeframe on Gold.
It is highly probable that the market will continue to rise.
The next level to watch is at 4680.


WARNING - Michael Saylor Manipulates Market - Buys 1.5 BillionPlease give me a follow on tradingview for future updates!
------ MARKET MANIPULATION WATCH
Looking at the 1 Week Chart for BTCUSD, it appears that we're about to see a golden cross on the MACD (12,26,close)
However, on the 1-month chart, the MACD and RSI data looks terrible , with a death cross that began around October 2025. See chart:
Although the 4 hour view or other short term views may look bullish, the 1 day is showing negative signs.
Today Michael Saylor purchased 1.5 Billion of Bitcoin.
Troublesome waters. Be VERY careful, you may see charts with a false golden cross due to saylors massive whale market manipulation. Many long-term HODLers are selling right now, probably for good reason.
Happy Trading and Please subscribe/follow me here on tradingview for future updates.


Long trade Buyside trade
Pair PENGUUSDT Buyside trade
Thu 8th Jan 26 LND Session PM 3.00 pm
Entry 0.011734
Profit level 0.013628 (16.14%)
Stop level 0.011588 (1.24%)
RR 12.9
Market Structure & Context
Higher-timeframe structure remains bullish, with price respecting a range low/demand base following prior expansion. The market completed a liquidity sweep into equal lows, inducing sell-side liquidity before displacement. Subsequent BOS (Break of Structure) confirms bullish continuation intent. Price re-entered and respected a discount Fair Value Gap (FVG), aligning with optimal trade entry conditions.
Market behaviour suggests accumulation → manipulation → expansion, with London PM acting as the fuel for directional continuation


CO.PA LONG - RSI extreme positive divergenceSince long this stock shows positive divergence on the chart.
Something is going to happen.
A bit speculative, but don't miss the chance to make profit of this signal.

#GBPNZD: Swing Buy Latest Update 15/12/2025 Swing Setup! Dear Traders,
Swing Buying Setup On OANDA:GBPNZD 📈
🔺The GBP/NZD pair has been bearish for a few weeks. It recently broke through the bearish trendline and is currently correcting. The current volume suggests further price growth and volume is likely to increase throughout the week.
🔺Keep your stop loss below the previous low and your take profit at the red horizontal line. Always use risk management and conduct thorough research before making any buying entries.
When To Buy? 💭
🔺The best buying zone is the current price zone where the price is likely to reverse. We’re simply waiting for the market volume to increase.
Support And Encouragement❤️🏆
Like and comment on our trading ideas, this will help us help you more.
As always stay safe and trade safe!
Team Setupsfx_

Next draw on liquidity 15min lows have been liquidated, A break of structure to the upside has occured on the lower 3min TF and the next draw on liquidity is too target recent 15min highs. Risk/Reward 1:2

Too Late to Buy Silver?Hello I am the Cafe Trader.
Today we’re looking at Silver (SLV). After a strong, almost vertical run many are wondering if this has more in the tank? or are we too late?
Unfortunately when breaking new territory on pricing, it can be hard to pick tops or bottoms, but here are some ways you can play SLV if you are late to the game
Top of Demand . This is where the current Strong demand is sitting. We should see a reaction at this level. People at this area have aggresive sentiment, and will be looking to add here. If we start to break this level, then we could see the market try and find liquidity again.
Green Scenario
If buyers continue to defend the Top of Demand around the mid-60s, Silver can stay elevated and work higher through consolidation. This would likely look choppy at first, but as long as demand holds, the path remains open for a continuation even into the 100s (Many people might look to take profiit at $100 since it is a psycological number, so keep that in mind.)
Entry around $64 - 64.50
Exit (your choice) but I gave you a 3/1RR option.
Stop loss can be tighter then what I have drawn here, but with the volatility this high, keep it super tight, or loose, nothing in between. I am showing a loose Stop loss.
Red Scenario
If we lose the Top of Demand, I would expect a deeper rotation into the Strong Demand zone below. That area represents conservative area for buyers after such an aggressive run. A dip into that zone would not be bearish in the bigger picture — it may even pose a hotter reaction. We want price to hold above that Key level . The closer you can get an entry to that price the better.
Long Term
Aggressive: Top of Demand (~64)
Value: Strong Demand (~48–50)
Extreme Value: Key Level / Bottom of Demand (~44)
Overall, Silver looks strong. The question isn’t whether the trend is bullish — it’s whether buyers choose to hold price up here, or let it rotate lower to build a stronger base. Either outcome can still support higher prices over time.
Happy Trading,
@thecafetrader

Nifty Analysis EOD – January 13, 2026 – Tuesday 🟢 Nifty Analysis EOD – January 13, 2026 – Tuesday 🔴
Fib 0.618 Defense: Expiry Day Rollercoaster Ends in 296-Point Volatility!
🗞 Nifty Summary
The Nifty started the session with a promising 90-point Gap Up, seemingly continuing yesterday’s bullish momentum. However, the optimism evaporated instantly as the index dived 195 points from the first tick, hitting the 25,700 mark.
After forming a temporary base and recovering 120 points to 25,820, Nifty encountered a textbook Double Top pattern, which triggered a second collapse back to the day’s low. A period of consolidation followed before a final flush-out broke the IBL, dragging the index to a day low of 25,603.30.
Interestingly, this low coincided exactly with the Fib 0.618 level, sparking a violent 150-point recovery to close at 25,714.20 (-0.22%).
While heavyweights like Reliance, LT, and Trent acted as major anchors, the intraday swings provided a paradise for agile traders.
🛡 5 Min Intraday Chart with Levels
🛡 Intraday Walk
The day was a masterclass in “stop-hunting” and liquidating over-leveraged positions on both sides. The initial “Open = High” (almost) structure led to a vertical drop that trapped morning bulls.
The recovery to 25,820 was promising until the Double Top confirmed that the bears weren’t finished. The breakdown to 25,603 was the ultimate “capitulation” move. The subsequent sharp recovery suggests that the 0.618 Fibonacci level is being defended as a major structural floor.
Despite the bearish close, the massive 129-point lower wick indicates that demand remains potent at the extreme discount zone.
📉 Daily Time Frame Chart with Intraday Levels
🕯 Daily Candle Breakdown
Open: 25,897.35
High: 25,899.80
Low: 25,603.30
Close: 25,732.30
Change: −57.95 (−0.22%)
🏗️ Structure Breakdown
Type: Bearish candle with a long lower wick.
Range (High–Low): ≈ 296 points — exceptionally high intraday volatility.
Body: ≈ 165 points — reflects firm selling pressure from the opening gap.
Upper Wick: ≈ 2 points — zero buying strength observed near the highs.
Lower Wick: ≈ 129 points — strong, aggressive buying rejection from the Fibonacci base.
📚 Interpretation
The candle is a portrait of a market in flux. Opening at the top and closing significantly lower confirms that the morning gap was used as a massive distribution window.
However, the recovery of nearly 130 points from the lows (the lower wick) confirms that the 25,600 zone is a high-demand territory. The market is oscillating violently, looking for a stable equilibrium after the recent “Phoenix” recovery.
🕯 Candle Type
Bearish Candle with Strong Lower-Wick Rejection — Signals heavy overhead supply but strong underlying support at the 0.618 Fibonacci level.
🛡 5 Min Intraday Chart
⚔️ Gladiator Strategy Update
ATR: 214.01
IB Range: 198.95 → Medium
Market Structure: Balanced
Trade Highlights:
10:04 Long Trade: Target Hit (R:R 1:1.08) (Trendline Breakout)
12:41 Short Trade: Target Hit (R:R 1:1.95) (IBL Breakout)
Trade Summary: Despite the chaotic expiry day swings, the strategy remained disciplined. The morning long capture was a quick scalp before the Double Top formed. The afternoon Short trade on the IBL breakdown was the high-conviction move of the day, capturing the slide toward the Fib 0.618 target.
🧱 Support & Resistance Levels
Resistance Zones:
25820
25855 ~ 25880
25940 (Crucial)
Support Zones:
25600
25550
25475
🧠 Final Thoughts
“The Fibonacci levels don’t lie, even on expiry day!”
Today’s price action proves that 25,600 is the line in the sand for the bulls.
If we gap down below this tomorrow, things could get ugly. But if we sustain above it, the “reversal” story is still on the table.
I’ll let President Trump decide if he wants to tweet the Nifty back to 26,000 or if he’s too busy “hiring and firing” to worry about our 0.618 levels! Let’s see what the opening tick brings on Wednesday.
✏️ Disclaimer
This is just my personal viewpoint. Always consult your financial advisor before taking any action.

NZDUSD SHORT Market structure bearish on HTFs 3
Entry at Weekly and Daily AOi
Weekly Rejection at AOi
Previous Weekly Structure Point
Daily Rejection At AOi
Previous Daily Structure Point
Daily EMA retest
Around Psychological Level 0.57500
Touching EMA H4
H4 Candlestick rejection
Rejection from Previous structure
TP: WHO KNOWS!
Entry 125%
REMEMBER : Trading is a Game Of Probability
: Manage Your Risk
: Be Patient
: Every Moment Is Unique
: Rinse, Wash, Repeat!
: Christ is King.


USDJPY – Moving Closer to Potential Intervention LevelsYesterday, the US dollar took a hit against many major currencies as traders reacted negatively to news that the Federal Reserve had been served with grand jury subpoenas from the US justice department threatening a criminal indictment, which was widely seen as a major escalation of the Trump administration’s challenge to the US central bank’s independence.
What was interesting is that USDJPY managed to hold firm, registering only a brief dip to 157.52 (Jan 12th low) before resuming its push back to highs just above the 158 level. Move forward 24 hours and it is perhaps no surprise that after observing this type of price action, USDJPY has extended its up move to a high of 158.97 at the time of writing this morning (0630 GMT).
Previous attempts to probe this area have been met with verbal intervention from Bank of Japan (BoJ) and Ministry of Finance (MoF) officials who have mentioned the potential for physical intervention if JPY weakness, dollar strength continued to be an on-going problem, and this was again the case overnight with officials warning against ‘one sided’ JPY moves (Reuters). In the past, these types of comments alone were enough to push USDJPY back lower again, but it remains to be seen if this will be the case on this occasion.
The reason for this is that traders may need to factor in the impact on the dollar (USD) side of the currency pair from US CPI data that is released at 1330 GMT. This inflation update could have an outsized influence on the direction of USDJPY depending on whether it deviates above market expectations or not. This is because it could significantly change the current market outlook for 2 Fed rate cuts in 2026, with the first being due as soon as April.
Many observers are watching 160.00 in USDJPY as the first line in the sand that may draw actual intervention from the MoF, so paying attention to moves around this level could be prudent. Assessing the technical outlook could also be beneficial.
Technical Update: Can The Current Move Higher Continue?
January has been a positive month for USDJPY so far, with the move from the 156.12 low on January 5th to this morning’s current 158.97 high, marking a 1.8% advance. This follows the recent slowing in the upside momentum, which resulted in a choppy, sideways phase of price activity from the November 20th high.
However, as the daily chart above shows, today’s current price action is producing a new recovery high for this up move. That naturally raises the question of whether the current strength can continue, or if this will once again prove to be a brief break to new highs before fresh weakness emerges. In this situation, being aware of the next key support and resistance levels could be important in helping to gauge where price action may head next.
Potential Resistance Levels:
There is no guarantee that a break to new recovery highs in price will lead to a sustained period of strength, and as the weekly chart below shows, there is another layer of historical resistance, which at the time of writing (0630 GMT) is currently being tested at 158.88, a level which corresponds to the January 2025 failure high.
Given how long this resistance has remained in place, the 158.88 level arguably represents an important area to monitor. A closing break above this point could be needed to unlock potential for further upside attempts. If such a break occurs, the next upside focus might then shift toward 161.95, which is the July 2024 failure point.
Potential Support Levels:
Of course, the 158.88 resistance level may still cap USDJPY on as closing basis tonight, allowing fresh weakness to develop. If that happens, attention could shift to 157.19 as the first possible support level. This is the 38.2% Fibonacci retracement of the December 16th to January 13th advance. A closing break below 157.19 may be needed to signal scope for a move to lower levels.
A confirmed closing break below 157.19 could trigger further downside pressure, with 156.12, which is the deeper 61.8% retracement, emerging as the next support. If that level also gives way, the downside potential may extend toward a test of 154.39, which is the December 16th low.
The material provided here has not been prepared accordance with legal requirements designed to promote the independence of investment research and as such is considered to be a marketing communication. Whilst it is not subject to any prohibition on dealing ahead of the dissemination of investment research, we will not seek to take any advantage before providing it to our clients.
Pepperstone doesn’t represent that the material provided here is accurate, current or complete, and therefore shouldn’t be relied upon as such. The information, whether from a third party or not, isn’t to be considered as a recommendation; or an offer to buy or sell; or the solicitation of an offer to buy or sell any security, financial product or instrument; or to participate in any particular trading strategy. It does not take into account readers’ financial situation or investment objectives. We advise any readers of this content to seek their own advice. Without the approval of Pepperstone, reproduction or redistribution of this information isn’t permitted.

SILVER (XAGUSD): Confirmed Breakout
As I predicted yesterday, Silver successfully violated a key
horizontal resistance cluster.
It turned into a support now.
I will expect a bullish continuation from that.
Next resistance - 88.0
❤️Please, support my work with like, thank you!❤️
I am part of Trade Nation's Influencer program and receive a monthly fee for using their TradingView charts in my analysis.

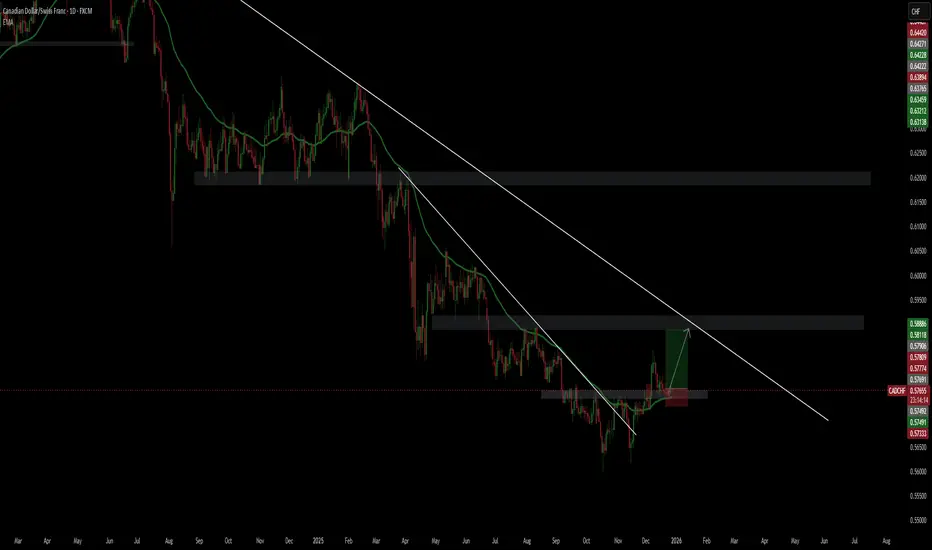
CADCHF LONG SCENARIO Here I'm using a slightly different approach.
So I'm using a 1:3+ RR and not the usual 1:1, because this is kinda different setup and here I'm combining the breakout of the minor resistance zone, which is now a support zone + the breakout of Daily 50 EMA + the breakout of the internal descending trend line (DTL).
Now is retesting all of these 3 indicators with SL not so far below and TP is the Weekly 50 EMA + minor zone + touch of the bigger weekly DTL (I'll put screenshot of the Weekly chart).
!!!- I already have an open trade from 22.12 from around this level here and I'm using only 0.4 risk for this trade, because it's a bit different from my strategy, but I like how the setup looks and everything is adding up perfectly + it's a clean setup.
Solana Starts 2026 With Builder Momentum and Institutional SignaThe opening of the first weekly newsletter of Solana in 2026 is straight to the point. Market algorithms can be broken, yet there is no lack of development activity. The update is a comparison of dull price movement and consistent ecosystem development. It positions the present stage as the stage where constructors still ship even though there is wider indecision on the crypto market. This stance is indicative of the continued attempt by Solana to decouple short-term sentiment and long-term network development.
Set the Tone of the Year: The Institutional Headlines
The most interesting headline is that Morgan Stanley has also submitted an S-1 to the SEC in order to launch a spot Solana ETF. The filing is not a positive sign yet itself represents the rising institutional interest in Solana as an invested asset. Meanwhile, initiatives supported by Wyoming proceeded with the FRNT mint of stablecoins. These developments collectively imply that regulatory-exposed infrastructure in the area of Solana is still evolving, despite the wider latent risk appetite being discriminatory.
In addition to the news by institutions, the newsletter focuses on active product launches within the Solana ecosystem. Over fifteen projects made updates or new tools last week. Among the highlights, there are Jupiter JupUSD stablecoin and Smart Money tracker by Birdeye, both focused on making on-chain liquidity and transparency better. Such launches are indicative of further experimentation and refining, despite the fact that the speculative volumes of trading are uneven in a setting where such speculative trading is still going on.
Proportion Metrics Point to Real Usage Growth
There are multiple ecosystem milestones, signifying growing use and not trite hype. Season 1 volume of Solana Mobile is recorded at 2.6 billion, which suggests it is not limited to only the DeFi users. Meanwhile, SuperteamEarn has surpassed 150,000 users, as an indicator of an increase in the involvement in work and contribution systems based on Solana. These numbers indicate that components of the ecosystem are scaling without making much noise regardless of the price increases and decreases in Bitcoin or Ethereum every day.
The graphic and visual focus of the newsletter was a hand-drawn cartoon of a mailman with packages that represented the unending shipping. The picture received more than 210,000 views within a time span of 24 hours, which is a strong statement that the development goes on despite the mood in the market. This story has been the focus of the positioning of Solana. The network focuses on builders and infrastructure to ensure credibility among the developers, institutional investors and long-term players.
In a more general sense, the update by Solana is an indicator of a common stage in the cycles of cryptocurrencies. Slow price action frequently is accompanied by preparatory work that is visible subsequently. Although ETF filings and the release of stablecoins does not necessarily mean adoption, it is a positive indication of continued activity by institutions and developers alike. In the case of the crypto market, it implies that the development of infrastructure persists when the retail sentiment becomes cold.

Plan for 13h January 2026 Nifty future and banknifty future analysis and intraday plan.
Quarterly results-
This video is for information/education purpose only. you are 100% responsible for any actions you take by reading/viewing this post.
please consult your financial advisor before taking any action.
----Vinaykumar hiremath, CMT
