NQ forecast Q1
Hello I am theCafeTrader.
Today I wanted to give a longer-term outlook on the NQ. I do day trade NQ futures daily, but this view is zoomed out and meant to give context, not entries.
First and foremost, the green circles highlight a series of higher lows and higher highs. Structurally, that’s a sign of weakening sellers. This would be the third attempt at this supply zone, and will put a lot of pressure on these sellers.
On top of that, we developed a clear Strong Demand zone in mid-December. That area has already done its job by stabilizing price and forcing shorts to cover. When demand forms this cleanly after a pullback, it usually means the market isn’t done yet.
With that in mind, I do think the market has room to push higher into Q1. A minor pullback would be healthy, and if price rotates back into Strong Demand , I would expect a very aggressive reaction to the upside.
Because this is a longer-term chart, I’m not posting price targets or entries. Use this as directional context and tailwinds for tech-heavy names you may already be trading or holding.
Happy Trading,
@thecafetrader
Candlestick Analysis

#GBPUSD BullishNot a bad entry for Asian session possibly can hold through some of London session I believe the move slowly happening now I have enough confirmations to confirm the move.

Bearish sentiment on CRYPTOWith multiple weekly rejection at the 4T price zone, price dropped 10% week ending 10/6/25; indicating a possible bearish trend.

Lupin Ltd | Long Downtrend Reversal with Fibonacci ConfirmationLupin Ltd has shown a notable reversal after a prolonged downtrend and is now sustaining above the 0.5 Fibonacci retracement (golden zone), indicating a shift in trend and strengthening bullish momentum. The price structure suggests accumulation at lower levels, followed by steady higher closes.
The stock appears poised for an upside move, and a decisive breakout above current levels could trigger further momentum-driven buying. The overall chart setup supports a continuation toward higher resistance zones.
Outlook:
A confirmed breakout from current levels may lead to a 5–10% upside in the near to medium term.
Risk Management:
A close below the 0.5 Fibonacci level would weaken the bullish bias and invalidate the setup.
Disclaimer: This is for educational purposes only. Please manage risk accordingly.

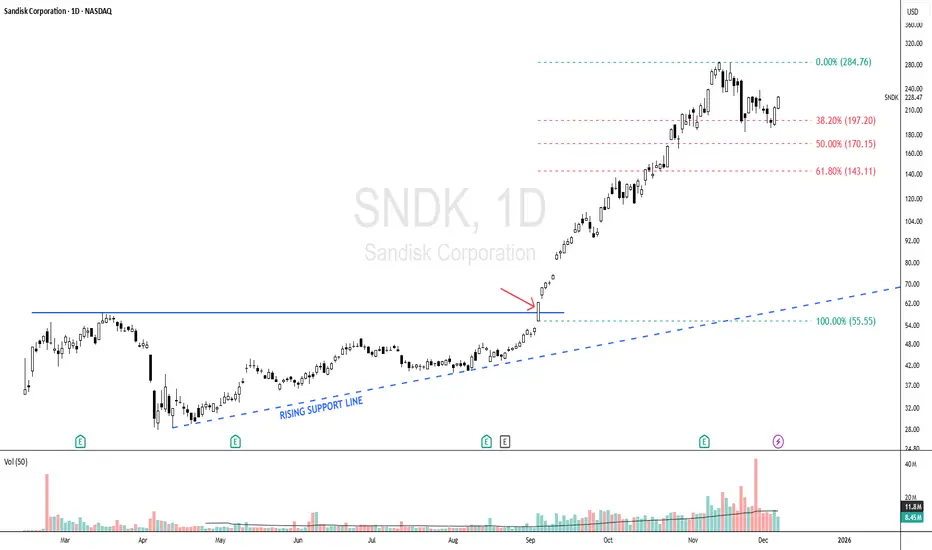
SNDK - Bullish Scenario Since 04 Sept, Momentum Still Intact!SNDK - CURRENT PRICE : 228.47
🔥 Bullish Scenario Supported by Trend Structure & Fibonacci Reactions
SNDK began showing early signs of a bullish scenario when price respected a rising support line , indicating steady accumulation and higher lows forming. The major bullish confirmation occurred on 04 September , when price broke above the 55.55 level (look at red arrow), triggering strong momentum and leading to a rapid vertical rally. As with many fast-moving stocks, a healthy retracement followed, and SNDK pulled back precisely toward the Fibonacci 38.2% golden ratio, where the stock found support and began forming a new base. This behavior suggests the prior uptrend remains intact, and the uptrend may resume as long as the stock continues to hold above this retracement zone.
Some Elliott Wave practitioners may also interpret the current structure as a developing Wave 5, suggesting the potential for another upside leg if the trend continues to follow impulsive wave behavior.
Take note that I'm using logarithmic scale chart because the share price has already risen more than 300% since the 04 September breakout, making it more suitable for analyzing large percentage moves and trend structure.
ENTRY PRICE : 228.47
FIRST TARGET : 270.00
SECOND TARGET : 324.00 (Projected based on Fibonacci extension)
SUPPORT : 183.00 (The low of 21 Nov HAMMER candle)
Long trade
5min TF
BNBUSDT.P — Sentiment Analysis (5-Minute | Institutional / VWAP–Liquidity Read)
Overall Sentiment:🟢 Short-Term Bullish Continuation | Intraday Buy-Side Control
Market State
BNB is trading in an intraday continuation phase following a successful reclaim of value. The prior consolidation resolved higher with acceptance above key intraday references, shifting the auction from balance into directional expansion.
Liquidity & Auction Narrative
Sell-side liquidity below the recent consolidation was engineered and absorbed.
The subsequent move higher shows clean follow-through, not a stop-run fade.
Upside liquidity above prior session highs remains active and targeted.
Value, VWAP & Fair Price
Price has accepted above VWAP and upper deviation bands, signalling premium acceptance.
The prior value area has flipped to support, reducing the probability of a deep pullback.
As long as VWAP holds, the bullish auction remains intact.
Volume & Momentum
Expansion legs show participation without climax.
No bearish momentum divergence at highs; momentum remains trend-aligned.
Consolidations appear flag-like, favouring continuation.
Summary
BNBUSDT has resolved higher from value with sustained acceptance above VWAP, indicating intraday buy-side control and favouring continuation while reclaimed support holds.
15min TF

DOW JONES INDEX (US30): Bullish Trend Continuation
I see a confirmed BoS on US30 index and a valid
violation of a resistance based on a previous ATH.
With a high probability, the market will rise more soon.
Next resistance - 49500
❤️Please, support my work with like, thank you!❤️
I am part of Trade Nation's Influencer program and receive a monthly fee for using their TradingView charts in my analysis.

Buy the Strongest One_Torrent PharmaHi traders,
Currently Torrent pharma gave breakout with trendline Support.
Go long In both Cash market and F&O until it breaks previous Market structure.
Note:- Only for educational purpose.

SILVER (XAG/USD): Confirmed Break of StructureI see a clear confirmed bullish breakout of an important intraday structure on 📈SILVER, with a 4H candle closing above it.
There's a strong likelihood that the market will keep climbing and hit the 81.00 level shortly.

USDCAD(USDCAD | 30m — Educational Analysis)
This profile is dedicated to educational market analysis through the lens of institutional price behavior, focusing on market structure, liquidity, and supply & demand dynamics.
The chart above illustrates a recent bearish break of structure (BOS) on USDCAD, followed by a corrective phase where price is currently interacting beneath a defined supply zone — an area that previously initiated strong bearish displacement.
From an institutional perspective, such zones are not treated as signals or trade instructions, but rather as areas of interest where order flow, acceptance, or rejection can provide valuable information about market intent.
At this stage, price action remains reactive and conditional:
•Acceptance below supply maintains bearish structural context
•Rejection or consolidation offers insight into positioning and liquidity
•Any outcome is evaluated only after confirmation by price
•No assumptions are made in advance.
🧠 What This Channel Represents
This is a public trading journal, not a signal service.
Here you’ll find:
•Clean chart structure
•Liquidity-aware context
Supply & demand mapped from displacement
•Probability-based scenarios, not predictions
There are:
❌ No buy/sell calls
❌ No entries, stops, or targets
❌ No profit claims or guarantees
All content is shared strictly for educational and discussion purposes only and does not constitute financial advice
📌 Channel Philosophy
Price is the final authority.
•Structure defines bias.
•Liquidity reveals intent.
•Patience protects capital.
If you value discipline over hype and process over emotion, you’re welcome to follow, engage, and exchange perspectives.
Let price confirm the narrative.
⚠️ Disclaimer
This analysis reflects personal chart interpretation and market study.
It is not financial advice.
Always conduct your own research and risk assessment.

EURCHF📊 EURCHF — Bearish Structure Shift & Supply Interaction
(Educational Market Commentary | Intraday / HTF Context)
This analysis is shared strictly for educational and informational purposes only. It reflects personal chart observations based on price action, market structure, and liquidity behavior. Nothing presented constitutes financial advice, trade recommendations, or execution guidance.
🔍 Market Structure Context
EURCHF has recently delivered a bearish break of structure (BOS), signaling a shift in short-term directional bias. The breakdown was impulsive, suggesting active sell-side participation rather than a corrective pullback.
Following the BOS, price displaced efficiently to the downside before beginning a corrective rotation, indicating rebalancing rather than immediate trend reversal.
🧠 Supply Zone Logic
The highlighted supply zone marks the origin of the bearish displacement that caused the structural break. From an institutional perspective, this zone represents an area of interest, not a signal.
If price retraces into this zone, the reaction will be key:
•Strong rejection may confirm remaining sell-side order flow
•Acceptance above the zone would suggest weakening supply and possible structural repair
•Until interaction occurs, the zone remains a reference within a bearish framework.
⚖️ Probabilistic Price Scenarios
From a probability-based standpoint:
•Bearish continuation remains valid while supply holds
•Deeper pullbacks may occur to rebalance inefficiencies
•Consolidation below supply is also a •healthy outcome
No outcome is assumed without confirmation from price behavior.
📌 Channel Philosophy
This journal focuses on:
•Structure over indicators
•Liquidity over emotion
•Process over prediction
•Discipline over hype
There are no signals, no guarantees, and no performance claims — only structured analysis and transparent market logic.
If you value institutional structure, liquidity-based reasoning, and rule-driven charting, feel free to follow and engage.
Let price confirm the narrative.

EUR/CAD: Bullish Continuation After ConsolidationThe EURCAD pair had been accumulating within a horizontal range on the 4-hour timeframe for over a week.
Today, its resistance was breached with a strong bullish movement.
The price may experience further growth. The nearest resistance level is at 1.6174.

GBPUSD: BoS Trading 🇬🇧🇺🇸
I see a confirmed bullish break of structure on GBPUSD on a daily.
After a breakout, the market retest a broken structure and we see
a strong buying imbalance on an hourly time frame.
Expect more growth today.
Goal - 1.3575
❤️Please, support my work with like, thank you!❤️
I am part of Trade Nation's Influencer program and receive a monthly fee for using their TradingView charts in my analysis.

Asia Session Break-InOne-Hour Timeframe Summary
On the one-hour timeframe, gold is currently trading within a clearly defined price trap during the Asia/Tokyo session. Price action is compressed between identified structure levels, creating conditions for an Asia session break-in move.
One-Hour Chart Highlights
• One-hour price trap established
• Shallow supply zone identified from trap swing high
• Shallow demand and support zone identified from trap swing low
One-Hour Trade Logic
• A confirmed close above the one-hour supply structure triggers a long entry targeting 10 points, while a confirmed close below the one-hour demand structure triggers a short entry targeting 10 points.


DAY1 LIVE DAY BY DAY BACKTEST JOURNALThis will be my backtesting journal live record of 2026 Price Action

$GOLD Bearish Engulfing Weekly CloseSlight bearish engulfing on the TVC:GOLD weekly close with bearish divergence.
The rotation into CRYPTOCAP:BTC could finally be happening 🥹
Will post TA on that soon.

Long trade
BTCUSDC.P — Sentiment Analysis (15m | Institutional / Liquidity–VWAP Read)
Overall Sentiment: 🟢 Bullish Continuation | Value Reclaim → Expansion
Market State
BTC has transitioned from intraday balance into directional expansion. The most recent pullback was corrective and failed to accept back into value, signalling that the auction has resolved in favour of the buy-side.
Liquidity & Auction Narrative
Sell-side liquidity beneath the Asian/London lows was engineered and absorbed.
The subsequent push higher shows clean acceptance above reclaimed levels, indicating a successful bullish auction, not a stop-run. Upside liquidity remains active and magnetised, with no immediate signs of distribution.
Value, VWAP & Fair Price
Price is holding above VWAP and upper deviation bands, confirming premium acceptance.
The former balance area has flipped to support, reducing the probability of mean reversion.
As long as VWAP is defended, trend conditions remain intact.
Bullish continuation dominates, supported by:
Strong intraday structure
Defended pullbacks and momentum alignment
Acceptance above VWAP/value
Summary
BTCUSDC has resolved higher from value with sustained acceptance above VWAP, indicating buy-side control and favouring continuation while reclaimed support holds.

INBS – Intraday Short | Parabolic Move → Rejection@INBS @Intraday @Short @NASDAQ
INBS made a sharp intraday expansion and ran straight into a heavy supply zone. After the push, price failed to hold highs and started to show clear rejection.
Short positions are taken on weakness after the rejection. This is an intraday mean-reversion setup with a favorable risk to reward profile.
Parabolic moves without base tend to retrace fast once momentum stalls.
Key Observations
Parabolic extension into prior resistance
Rejection from supply zone
Failure to hold VWAP
Long upper wicks near highs
Momentum slowing after the spike
Once buyers failed to continue the move, sellers stepped in aggressively.
Execution Plan
@Entry: Short on rejection below resistance / VWAP
@Invalidation: Clean reclaim and hold above the highs
@Target: Prior demand zone / intraday base
@Risk: Tight, defined above resistance
@Time: Intraday only, no overnight hold
Market Logic
Fast moves attract late buyers. When continuation fails, those buyers become liquidity for shorts.
This is not about predicting a top — it’s about reacting to failed continuation and respecting structure.
Trade management is key. Partial covers into weakness, protect profits.
@DisciplineOverPrediction
@TargetTraders

GBPUSD – 1H | Supply & Demand Reaction Within Ascending ChannelGBPUSD remains in a bullish structure, trading inside a well-defined ascending channel. Price is currently pulling back from supply and reacting at a key demand zone aligned with channel support.
As long as price holds above demand, bullish continuation toward the upper channel and prior highs remains the preferred scenario. A clean break below demand would signal a deeper corrective move.
Key Levels:
• Supply: 1.3515 – 1.3540
• Demand: 1.3395 – 1.3415
• Trend Invalidation: 1.3385 (H1 close)
Bullish Scenario:
• Price holds above 1.3395
Bearish Scenario (Correction)
• H1 close below 1.3385
• Failed retest of demand as resistance

Amazon $AMZN weekly demand level at $221 is holdingAmazon weekly demand level at $221 is holding as expected. Amazon stock is trying to to print a new weekly high. Any long positions should be managed. Waiting for new imbalances and weekly highs.

Nifty Analysis EOD – January 5, 2026 – Monday🟢 Nifty Analysis EOD – January 5, 2026 – Monday 🔴
Bears Strike Back: 26,375 Rejection Triggers 140-Point Breakdown.
🗞 Nifty Summary
Nifty started the session on a flat note but immediately witnessed an early slip of 95 points, finding initial support at the 26,275 level.
A strong recovery followed, briefly shifting sentiment to bullish as the index breached the day’s high. However, the 26,375 resistance zone proved to be a formidable ceiling, gradually pushing prices back into the Initial Balance (IB).
The afternoon session was marked by extreme volatility; around 2 PM, an IBL breakdown was attempted, but the CPR BC support triggered a sharp “false breakout” spike back into the IB.
Ultimately, the bears regained control, dragging the index down nearly 140 points from the peak. Nifty concluded the day 34 points above the low but a significant 90 points below the PDC, marking a clear bearish victory after a day of intense tug-of-war.
🛡 5 Min Intraday Chart with Levels
🛡 Intraday Walk
The session was a masterclass in market “drama.” The first hour saw high-velocity swings of 100 points, exhausting both early bulls and bears.
The mid-session sideways grind lured traders into a false sense of security before the 140-point breakdown commenced. The most critical technical event was the 2 PM IBL break; while the CPR provided a temporary floor, the inability of bulls to sustain the recovery confirmed that supply was overwhelming demand.
Bears successfully shifted the battlefield lower, ending the day with a dominant stance.
📉 Daily Time Frame Chart with Intraday Levels
🕯 Daily Candle Breakdown
Open: 26,315.40
High: 26,378.20
Low: 26,238.50
Close: 26,272.15
Change: −43.25 (−0.16%)
🏗️ Structure Breakdown
Type: Bearish Rejection Candle
Range (High–Low): ≈ 140 points → High intraday volatility
Body: ≈ 43 points → Moderate bearish close
Upper Wick: ≈ 63 points → Strong rejection from the 26,375 resistance zone
Lower Wick: ≈ 34 points → Some late buying interest from the day’s lows
📚 Interpretation
The long upper shadow is the defining feature of today’s candle, confirming heavy supply at higher altitudes. While the market attempted a bullish extension, the failure to hold above the IBH suggests a lack of follow-through conviction. The close near the lower third of the range indicates that momentum has shifted in favour of the bears for the short term.
🕯 Candle Type
Bearish Candle with both Side wicks
(Signals potential reversal or cooling of bullish momentum; the breach of today’s low will confirm further downside.)
🛡 5 Min Intraday Chart
⚔️ Gladiator Strategy Update
ATR: 170.93
IB Range: 94.65 → Medium
Market Structure: Balanced
Trade Highlights:
13:59 Short Trade: Trailing Exit (1:0.93) (IBL Breakout)
Trade Summary: The system successfully identified the IBL breakdown at 13:59. However, the subsequent interaction with the CPR support zone created a volatile “whipsaw” environment. A trailing stop was utilized to protect capital, resulting in a near 1:1 exit as the market entered its late-day “drama” phase.
🧱 Support & Resistance Levels
Resistance Zones:
26277
26320
26375 (Major Supply Wall)
Support Zones:
26235 ~ 26210 (Immediate Floor)
26155
26104
🧠 Final Thoughts
“The bulls have lost the immediate high ground.”
After today’s rejection at 26,375, the short-term bias has tilted toward the bears. For the upcoming session, the 26,235 ~ 26,210 zone is the final line of defense for the bulls. If this floor gives way, we could see a swift test of 26,155. Bulls need a decisive gap-up or a strong reclamation of today’s IBH to regain their footing.
✏️ Disclaimer
This is just my personal viewpoint. Always consult your financial advisor before taking any action.

Long trade
BTCUSDC.P — Sentiment Analysis (1H | Institutional / Liquidity Lens)
Overall Sentiment: 🟡 Neutral → Constructively Bullish
(Range Re-accumulation with Upside Bias)
Market State
BTC is currently operating in a range-reaccumulating environment following a prior bearish impulse. Price has transitioned from aggressive downside expansion into balanced auction behaviour, with repeated acceptance around a well-defined value area.
Liquidity & Auction Narrative
Sell-side liquidity below prior lows has been partially consumed, with no sustained follow-through. Repeated downside probes have resulted in quick reclaims back into value, indicating sell-side inefficiency. Upside liquidity above recent range highs remains intact and magnetised.
📦 Fixed Range Profile & Fair Value
The Fixed Range Volume Profile highlights a clear Point of Control / True Fair Value within the range: Price is oscillating around value rather than trending away from it. Acceptance above the value area high has improved relative to prior attempts This behaviour suggests inventory rebalancing and re-accumulation.
📉 Volume & Bubble Behaviour
Larger volume bubbles appear during liquidity sweeps and reclaims, not during continuation.
This suggests forced participation (stops, liquidations) rather than trend-following volume.
Subsequent compression reflects absorption by stronger hands.
Session Behaviour
Asia continues to form range boundaries
London and NY repeatedly probe range extremes
Recent NY behaviour shows improved acceptance above mid-range
Session sequencing supports a gradual bullish skew, not immediate breakout.
📘 Summary
BTCUSDC is consolidating around fair value following sell-side absorption, signalling re-accumulation rather than continuation. Acceptance above value keeps sentiment constructively bullish, with range highs acting as the next liquidity draw.
