Nifty Analysis EOD – December 17, 2025 – Wednesday 🟢 Nifty Analysis EOD – December 17, 2025 – Wednesday 🔴
Bears Breach PDL: Critical Defense at 25800 Support Zone.
🗞 Nifty Summary
The Nifty opened with a 52-point Gap Up, but the optimism was short-lived as the first candle immediately filled the gap. While bulls attempted a recovery, the 25920 ~ 25930 resistance zone proved insurmountable, triggering a hard sell-off.
This downward pressure decisively broke the CDL, PDC, and the PDL. After breaking the PDL, the index entered a 40-point consolidation phase before another breakdown tested the lower levels.
The 25800 ~ 25815 zone shifted from support to resistance during the session. Nifty managed a late 50-point recovery from its lows to close at 25,822.65, marking a loss of -41.55 points (-0.16%).
Significantly, bears have captured the ground by securing a close below the PDL.
🛡 5 Min Intraday Chart with Levels
🛡 Intraday Walk
The majority of the day’s significant movement was compressed into the first half. The failure at the 25920 zone confirmed that supply remains heavy at higher levels.
The breakdown below the PDL was the technical highlight of the day, signaling that bears are successfully pushing the structural boundaries lower.
The late-day recovery shows some buying interest, but the fact that 25800 ~ 25815 acted as resistance into the close suggests a cautious outlook for the bulls.
📉 Daily Time Frame Chart with Intraday Levels
🕯 Daily Candle Breakdown
Open: 25,902.40
High: 25,929.15
Low: 25,770.35
Close: 25,818.55
Change: −41.55 (−0.16%)
🏗️ Structure Breakdown
Type: Bearish candle (small body).
Range (High–Low): ≈ 159 points — moderate volatility.
Body: ≈ 84 points — reflecting persistent bearish pressure from the open.
Upper Wick: ≈ 27 points — limited buying strength near the open.
Lower Wick: ≈ 48 points — buyers attempted to defend lower levels, creating a supportive tail.
📚 Interpretation
The candle structure reflects a market under pressure. While the change in percentage is small, the internal dynamics—specifically the failure to hold the open and the breach of the PDL—point to a bearish bias. The lower wick suggests that while buyers are present near 25770, they lack the momentum to reclaim the opening price.
🕯 Candle Type
Bearish Candle with Lower-Wick Support Attempt — Signals selling pressure, though buyers are showing interest near the 25800 support zone.
🛡 5 Min Intraday Chart
⚔️ Gladiator Strategy Update
ATR: 193.4
IB Range: 77.80 → Medium
Market Structure: Balanced
Trade Highlights:
0:34 Short Trade - Trailing SL Hit
14:04 Short Trade - Trailing SL Hit
Trade Summary: The morning short trade successfully capitalized on the rejection from the 25920 resistance zone. However, the late-afternoon contra-long attempt met with further selling pressure at the 25815 resistance, resulting in a stop-loss hit as the market failed to sustain the bounce.
🧱 Support & Resistance Levels
Resistance Zones:
25890
25930 ~ 25920 (Major Supply)
25985
Support Zones:
25800 (Immediate Support)
25740 ~ 25715 (Last Resort Zone)
🧠 Final Thoughts
“The 25800 level is the current fort for the bulls.”
The close below the PDL is a warning sign. For tomorrow, if the 25800 level fails to hold as a support base, the 25740 ~ 25715 zone will be the “last resort” for the bulls to prevent a deeper correction.
Bulls need to reclaim and sustain above 25890 to neutralise the current bearish momentum.
✏️ Disclaimer
This is just my personal viewpoint. Always consult your financial advisor before taking any action.
Candlestick Analysis

GBP/CAD: Another Bearish Confirmation The GBPCAD pair has violated a support level within a horizontal trading range on a 4-hour chart.
This suggests a strong bearish signal for intraday trading.
I anticipate a decline to at least the 1.8330 level.


USDJPY OutlookWe might start seeing bullish buildup cause price just mitigated a Demand Key level from the higher timeframe.

Buying GCGC closed bullish on 4H. Bearish 1H low was tagged as sweep of liquidityThere are 15M and 30M bullish engulfing candles. Going for 4H high which should provide 2,5R

FireHoseReel | ARB 4H Range Structure with Pre-Breakout Zones🔥 Welcome To FireHoseReel !
Let’s dive into Arbitrum (ARB) analysis.
⛳️ ARB Fundamental Overview
Arbitrum (ARB) is an Ethereum Layer-2 scaling solution ranked #56 on CoinMarketCap. It makes transactions faster and cheaper while supporting many dApps.
👀 ARB 4H Overview
ARB is trading inside a 4-hour range, with the upper boundary at $0.2242 and the lower boundary at $0.1875. At the moment, two pre-breakout zones have formed, both offering potential trading opportunities.
📊 Volume Analysis
Compared to other coins, ARB’s volume remains relatively strong. However, while price is ranging inside this box, volume has slightly decreased compared to previous levels. A volume expansion could trigger the next move and drive price out of the range.
✍️ ARB Trading Scenarios
🟢 Long Scenario 1:
A break above the pre-breakout zone at $0.2025, supported by rising buying volume and an RSI momentum break above the 46 level, could provide a valid long setup. The next resistance is located at the range high around $0.2242.
🔴 Short Scenario:
A break below the pre-breakout zone at $0.1921, confirmed by increasing selling volume and an RSI momentum break below the 32 level, could offer a short opportunity. The next support lies near the range low at $0.1875. Since these two levels are close, the position would be entered slightly earlier.
🧠 Protect your capital first. No setup is worth blowing your account. If risk isn’t controlled, profit means nothing. Trade with rules, not emotions.

How To Judge First Candle Of Nifty 50This video explains how to judge the first candle of the Nifty 50 index by observing price behavior at the market open. The discussion focuses on how the opening candle reflects early participation, directional intent, and momentum, and how its bullish or bearish nature can be interpreted using basic price action logic.
The objective of this video is to help build understanding around opening-session behavior and candle structure from an educational perspective, without offering any trading or investment recommendations.

FireHoseReel | BNB Daily Analysis #22🔥 Welcome To FireHoseReel !
Let’s dive into BinanceCoin (BNB) analysis.
👀 BNB 1D Overview
On the daily timeframe, BNB is forming a trading range of roughly 10%. If this structure continues, it will likely develop into a clear daily box and consolidation zone. The upper boundary of this range is at $923, while the lower boundary is at $823.
📊 Volume Analysis
After printing an ATH at $1,376, BNB’s volume dropped sharply. With volume currently compressed, the next expansion in volume could trigger a move larger than expected.
✍️ BNB Trading Scenarios
🟢 Long Scenario 1:
A break above $923, which marks the top of the trading range, accompanied by strong buying volume confirmation, could provide a solid long setup on BNB.
🔴 Short Scenario:
A break below $823, the bottom of the trading range, confirmed by increasing selling volume, could offer a valid short opportunity on BNB.
🧠 Protect your capital first. No setup is worth blowing your account. If risk isn’t controlled, profit means nothing. Trade with rules, not emotions.

GOLD (XAUUSD): High Chance for a Rise?!
I see a confirmed bullish change of character on Gold on a 4h
time frame after a release of high impact US news yesterday.
With a high probability, the market will rise more today.
Goal - 4345
❤️Please, support my work with like, thank you!❤️
I am part of Trade Nation's Influencer program and receive a monthly fee for using their TradingView charts in my analysis.

USD/JPY, AUD/JPY Probe SupportThe daily charts for USD/JPY and AUD/JPY show bears have taken control and are considering a break of their respective support levels.
Matt Simpson, Market Analyst at City Index.

AUD/USD tests 0.6625 as bulls lose steamAUD/USD has retraced back towards 0.6625, a level that previously capped bullish advances earlier in the year. Having already tested the level before bouncing, the proximity allows for two-way trades to be established depending on how price action evolves in the near term.
The message from RSI (14) and MACD is one of waning upside strength, providing a cautious signal to bulls rather than an outright bearish bias favouring downside. That adds weight to placing more emphasis on price action when assessing directional risks and trade setups.
Should the pair continue to hold above 0.6625, longs could be set above the level with a stop below, targeting 0.6685 (10 Dec high) or resistance at 0.6700.
Alternatively, if the pair extends the bearish retracement beneath 0.6625 and holds there, the setup could be flipped with shorts set on the break with a stop above for protection. 0.6580 (13 Nov high) or 50-day moving average both screen as potential targets, although those entering the trade should pay close attention to price action around 0.6600. If the price can’t push through convincingly, consider nixing the position.
Good luck!
DS

GU buysAlready moving. Buys from OB after engineered liquidity sweep targeting highs. Beautiful setup.


GBPCAD SHORTMarket structure bearish on HTFs 3
Entry at both Weekly and Daily AOi
Weekly Rejection at AOi
Previous Weekly Structure Point
Daily Rejection At AOi
Daily Previous Structure Point
Around Psychological Level 1.84500
Touching EMA H4
H4 Candlestick rejection
Rejection from Previous structure
TP: WHO KNOWS!
Entry 120%
REMEMBER : Trading is a Game Of Probability
: Manage Your Risk
: Be Patient
: Every Moment Is Unique
: Rinse, Wash, Repeat!
: Christ is King.

XAUUSD December 16 XAUUSD Analysis
Gold shows bullish reversal potential after sweeping the Previous Day Low (PDL). Targeting buy-side liquidity at 4,350.00. • Plan: Buy at 4,287.90, SL below 4,265.00. Move SL to entry after hitting TP1.
Trade plan ( This is for educational purpose)
XAUUSD | Daily
🟢 Buy: 4,287
🛑 SL: 4,265
🎯 Take Profits:
1. TP1: 4,310
2. TP2: 4,335
3. TP3: 4,350(PDL Liquidity)
Confirmation: Bullish rejection after PDL sweep.
Invalidation: Daily close below 4,260.00.

Gold Long Today 📉 XAUUSD | Short-Term Pullback Trade
Bias: Bullish Pullback (Correction in Bearish Structure)

Nifty Analysis EOD – December 16, 2025 – Tuesday🟢 Nifty Analysis EOD – December 16, 2025 – Tuesday 🔴
Open=High Day: Bears Take Full Control, Closing Nifty on Critical Support.
🗞 Nifty Summary
The Nifty started with a Gap Down of 33 points and immediately extended losses by another 75 points, establishing an Open = High (O=H) formation—a clear signal of bearish dominance.
The initial bounce from the PDL quickly faded, leading to a break below the PDL. The 25890 level acted as a temporary pivot for most of the session, but selling pressure gradually pushed the Nifty down to the next support zone of 25860 ~ 25840.
The day closed near the low at 25,860.10, with a loss of -167.20 points (-0.64%). The day was full of volatility due to the weekly expiry, and bears were firmly in control, successfully denying any significant recovery.
The close right on the important support zone of 25860 ~ 25840 raises the serious question: Is the short-term bull trend fading?
🛡 5 Min Intraday Chart with Levels
🛡 Intraday Walk
The Open=High formation meant sellers controlled the price from the very first tick. The failure to reclaim the PDL after the initial bounce was a strong technical signal that the short-term trend was reversing.
Nifty spent the majority of the session in a sustained downtrend, grinding against the minor support levels until it settled on the 25860 ~ 25840 zone.
The lack of any significant recovery at these levels is a major concern, as it suggests buyers lacked the conviction necessary to defend key structural points.
📉 Daily Time Frame Chart with Intraday Levels
🕯 Daily Candle Breakdown
Open: 25,951.50
High: 25,980.75
Low: 25,834.35
Close: 25,860.10
Change: −167.20 (−0.64%)
🏗️ Structure Breakdown
Type: Bearish candle.
Range (High–Low): ≈ 146 points — moderate volatility.
Body: ≈ 91 points — reflecting clear selling pressure and bearish control.
Upper Wick: ≈ 29 points — early buying attempt but quickly rejected, contributing to the O=H structure failure. (according Pre-Open Price)
Lower Wick: ≈ 26 points — minor buying interest near the lows.
📚 Interpretation
The strong bearish body and the close near the day’s low confirm seller dominance. The absence of a long lower wick indicates that buyers lacked conviction at the 25860 support level. The current close is precarious, sitting right on the final major support before the deeper levels of 25740 ~ 25715.
🕯 Candle Type
Bearish Continuation Candle — Indicates sellers maintaining control; further downside is possible unless a strong bullish reversal appears immediately.
🛡 5 Min Intraday Chart
⚔️ Gladiator Strategy Update
ATR: 197.24
IB Range: 79.10 → Medium
Market Structure: ImBalanced
Trade Highlights:
0:34 Short Trade - Trailing SL Hit
14:04 Short Trade - Trailing SL Hit
Trade Summary: The steady, grinding downtrend made capturing clean trades difficult, resulting in two stop-loss hits on breakout attempts. The low-conviction price action near support zones led to choppy movements that struggled to generate the required high R:R targets.
🧱 Support & Resistance Levels
Resistance Zones:
25890
25930 ~ 25920
25985
26030
Support Zones:
25800
25740 ~ 25715 (Critical Base)
🧠 Final Thoughts
“The test of the bulls is tomorrow’s open.”
The close on the 25860 ~ 25840 support zone is highly critical. To confirm the fading bull trend, we need to see a decisive close below 25740 ~ 25715.
For tomorrow, a break below today’s low (25,834) will open the door to 25740. Until we see a strong follow-up close above 25930, bias remains negative.
✏️ Disclaimer
This is just my personal viewpoint. Always consult your financial advisor before taking any action.

DOW JONES (US30): Pullback Trade
I see a confirmed bullish Change of Character on US30
on an hourly time frame after a test of an intraday support.
I expect a pullback now at least to 48427 level.
❤️Please, support my work with like, thank you!❤️
I am part of Trade Nation's Influencer program and receive a monthly fee for using their TradingView charts in my analysis.

USDCHF: High Chance for Recovery?! 🇺🇸🇨🇭
USDCHF may continue recovering after a test
of a strong intraday horizontal support.
It looks like we got a bearish trap below that
and we see a relatively strong bullish momentum now.
Goal will be 0.7985
❤️Please, support my work with like, thank you!❤️
I am part of Trade Nation's Influencer program and receive a monthly fee for using their TradingView charts in my analysis.

4H ascending triangle pattern, be cautious when shorting.#XAUUSD OANDA:XAUUSD TVC:GOLD
The medium- to long-term bullish outlook remains unchanged, influenced by the continuous increase in gold holdings by central banks around the world. Gold prices are currently testing the short-term resistance level of 4345 again, and many people may short gold at this level once more. However, from a longer time frame perspective, the trend may have formed an ascending triangle structure. Once it breaks through 4345, the gold price may further test the previous high of 4370-4380, or even reach a new high. Therefore, avoid blind trading in the short term. A prudent trading strategy would still be to consider going long on gold after it retraces to the short-term support level of 4330-4320. Of course, if the price of gold rises sharply to near the previous high, you can also try shorting with a small position.
In summary, the current market requires a flexible approach, with buying on dips being the primary strategy and selling on rallies only as a secondary measure. The focus this week is tomorrow's NFP data.

Selena | XAUUSD 4H - Bullish Continuation Structure ATH SOONFOREXCOM:XAUUSD
The market absorbed prior selling pressure and transitioned into sustained higher highs and higher lows. Current price is trading above the previous consolidation range, suggesting continuation toward higher liquidity zones, while pullbacks remain corrective within trend.
Key Scenarios
✅ Bullish Case 🚀 →
🎯 4350 → 🎯 4420 → 🎯 4500
❌ Bearish Case 📉 → Breakdown below 4050
Current Levels to Watch
Resistance 🔴: 4350 – 4450
Support 🟢: 4180 / 4050
⚠️ Disclaimer: This analysis is for educational purposes only. Not financial advice.

FireHoseReel | TOTAL3 Consolidation Signals the Next Market Move🔥 Welcome To FireHoseReel !
Let’s dive into Crypto Total Market Cap Excluding BTC & ETH (TOTAL3) analysis.
👀 TOTAL3 4H Overview
TOTAL3 is currently moving inside a 4-hour range, and the top 10 coins in the market are also consolidating within this box. From a pure supply–demand perspective, a breakdown below the range low could apply further downside pressure to this index and trigger broader weakness across the top 10 coins.
✍️ TOTAL3 Trading Scenarios
🟢 Long Scenario:
A breakout above $900B can act as an alert zone for the first bullish wave in the market. Setting an alert around this level allows you to stay engaged if upside momentum starts for top-tier assets.
🔴 Short Scenario:
A breakdown below the range low could increase selling pressure across the market, leading to stronger capital outflows from the top 10 coins.
🧠 Protect your capital first. No setup is worth blowing your account. If risk isn’t controlled, profit means nothing. Trade with rules, not emotions.

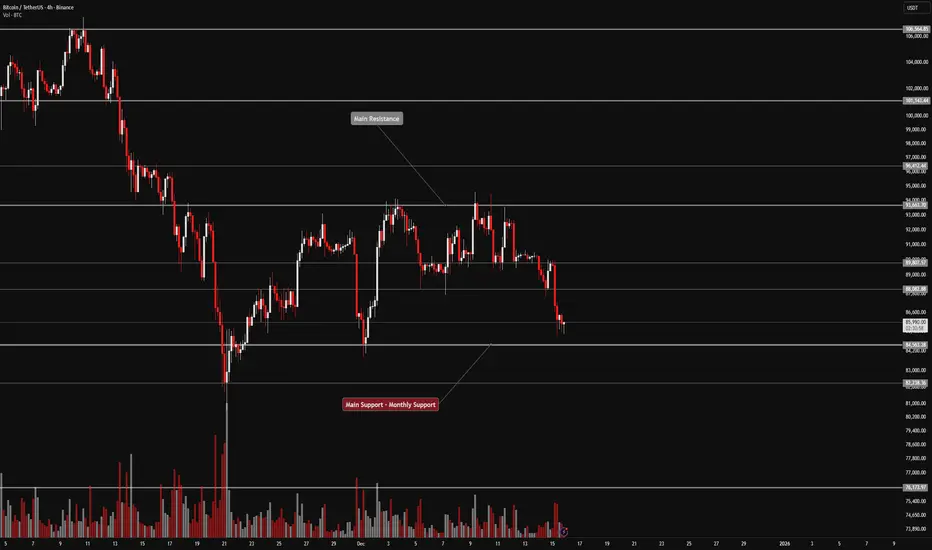
BTC 4H Range Structure With Key Breakout Levels🔥 Welcome To FireHoseReel !
Let’s dive into Bitcoin (BTC) analysis.
👀 BTC 4H Overview
Bitcoin is currently trading inside a 4-hour range, with resistance at $93,663 and support at $84,563. A breakout from this box could trigger a major move. Keep in mind that December holiday conditions, especially Christmas, are keeping overall market volume relatively low.
📊 Volume Analysis
After breaking $88,082, Bitcoin’s volume shifted into strong selling pressure, printing a large 4H sell-off candle. A renewed volume expansion could lead to another significant move and potentially push price out of this range.
✍️ BTC Trading Scenarios
🟢 Long Scenario:
A breakout above $88,082 with rising buy volume could activate a low-risk long setup (~0.25% risk). If buying pressure expands into higher timeframes, the next resistance levels are $89,807, $93,663, and $96,412.
🔴 Short Scenario:
A breakdown below the current support near $84,563, confirmed by increasing sell volume, could provide a solid short opportunity.
🧠 Protect your capital first. No setup is worth blowing your account. If risk isn’t controlled, profit means nothing. Trade with rules, not emotions.