Bitcoin Analysis – November 22 | Ready to Build Structure ?Bitcoin Analysis – November 22 | Ready to Build Structure? 🧩📉
Hello to all traders out there! Hope you’re having a great day wherever you are.
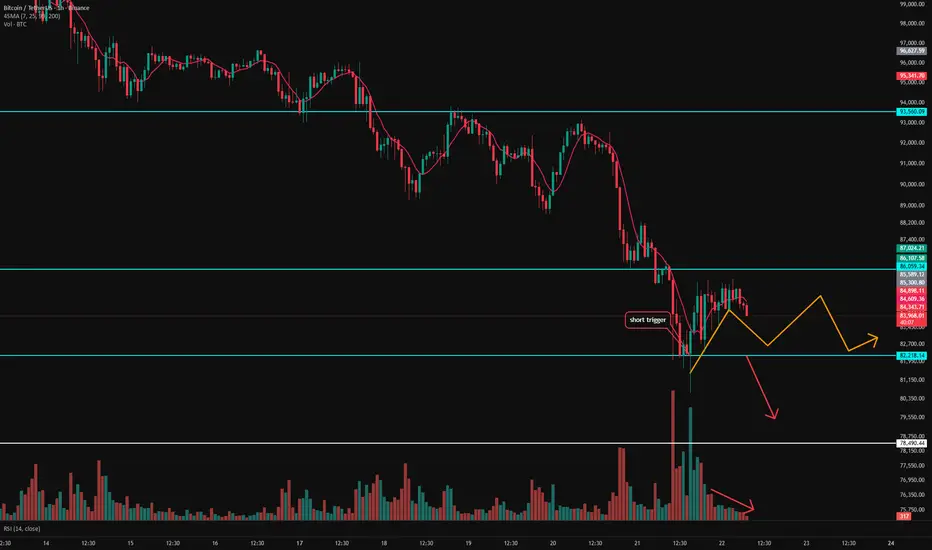
As you can see, price refused to drop below the $82K level and is currently in a resting phase.
Also worth noting:
📉 Fear & Greed Index is at 11 — extreme fear.
Now let’s break down the possible scenarios for today:
🟦 Scenario A – Likely Range & Structure Building
One of the most probable scenarios today is a range, something we usually see on Saturdays.
Here’s why:
Price already gave a solid reaction to the $82K level
But volume keeps dropping — naturally, because it’s Saturday
Many traders are waiting for the market to build structure so they can take proper triggers
A ranging market today makes sense, and it can actually be a great time to:
Review your trade journal
Scan for strong potential coins for the upcoming week
⏰ Tip: I recommend checking the chart every 4 hours — especially before the 4H candle closes and during the US session.
🟥 Scenario B – Breakdown & Short Opportunity
Another strong scenario: a drop below $82,200.
This level is a valid short trigger only if broken, but ideally, I want to see one more retest first.
Why?
The market reacted too aggressively to this level earlier — meaning it might not be a “clean” level yet.
A second reaction would confirm it more reliably.
If $82.2K gets retested on the 1H timeframe, I’ll likely take a short with a tight stop.
🟩 Scenario C – Pump Above $86K? Still Not Longing
If price pushes above $86K, I’m still not opening longs.
I want to see buyer strength first.
If buyers lose momentum after the move up, then the first lower high / lower low, or even equal structure on the 1H timeframe, gives me a clean short setup.
In a bearish environment, every new high is a shorting opportunity.
🔚 Final Thoughts
These are today’s scenarios.
And remember:
💡 Risk management, position sizing, and reward-to-risk matter far more than any chart you see online.
Your goal is simple: stay alive long enough to become profitable.
Wishing you all a profitable day!
If you have any thoughts, feel free to share them in the comments. 📩
Candlestick Analysis
Estimated Bullish Probability: 80%
Weekly: Hammer+ → Light Green (strong weekly bullish hammer)
Daily: Hammer → Light Green (bullish daily hammer)
4H: Rising Three Soldiers+ → Light Red (bullish candlestick pattern, but 4H MACD is a short-term pullback)
Step 1 — base MACD color probability
Row Weekly Light Green / Daily Light Green / 4H Light Red → Low–Moderate (55–65%).
Use the midpoint for calculation:
Base MACD probability = 60%.
(Arithmetic check: 55 + 65 = 120; midpoint = 120 ÷ 2 = 60.)
Step 2 — adjust for candlestick patterns (how strong each pattern is on its timeframe)
Weekly Hammer+ (strong weekly bullish hammer) → +10% (weekly patterns carry heavy weight).
Daily Hammer (daily bullish hammer) → +8% (meaningful daily confirmation).
4H Rising Three Soldiers but MACD = Light Red → the candle is bullish, but the MACD color is a short-term pullback, so we give a small +2% (pattern helps, but momentum mismatch reduces its effect).
Step 3 — digit-by-digit arithmetic (exact)
Start with base: 60
Add Weekly hammer+: 60 + 10 = 70
Add Daily hammer: 70 + 8 = 78
Add 4H rising three soldiers (small bump): 78 + 2 = 80
Final result = 80%
Final answer
➡️ Estimated Bullish Probability: 80%
Quick interpretation / trade guidance
Weekly + Daily both show bullish hammers → strong higher-timeframe bias is up.
4H shows a bullish candle pattern (Rising Three Soldiers) but MACD is Light Red — that indicates a short-term pullback or consolidation. The candlestick pattern reduces the risk of immediate reversal but the MACD color suggests waiting for a 4H flip to green for the cleanest entry.
Practical entries: scale in on strength, or wait for 4H Light Red → Light Green flip (or a strong bullish 4H close). Use a stop below the 4H structure; consider a larger position if 4H confirms.
Rocket boost this content to learn more.
Warning!! Trading is risky please use a simulation trading account before you trade with real money

Stock market will test yearly levels below current supportAs the yearly candle closes and the new one opens, there is an orderflow pattern that is well developed. This will play out again as always 💎

Potential Sell Setup in EURGBP towards External LiquidityI identified a valid Sell Setup in the EURGBP which could be very interesting in the coming week
We see strong indications within the Chart Level, Current Market phase and and confirmation from the Accumulation/Distribution indicator that a Lower Low is very likley.
Eventhough the Orderflow within the EURGBP ist bullish. Big Players could reposition under lows which makes an internal short push likley.
Thats why my TP is set crucualy into the low.
As soon as we create a LL the Short Setup becomes invalid for as we enter a External W1 Demand Zone where I plan to position myself Long again
Hope this insight of mine was helpfull
All the best :)
JMA 🐬

GBPAUDThis was my Sell setup on GA but with the recent push down after the liq sweep, price might not mitigate my entry level. This level is still valid until price breaks the low and creates a BOS.
Manage risk

AUDJPYContinuous bullish bias on the pair. Due to the liq sweep and the recent push up price might not mitigate my Demand entry. But I'll keep my limit open till invalidation.
Manage risk if interested

FireHoseReel | Crypto Index Overview🔥 Welcome FireHoseReel !
Let’s dive into the analysis of Four major crypto Index.
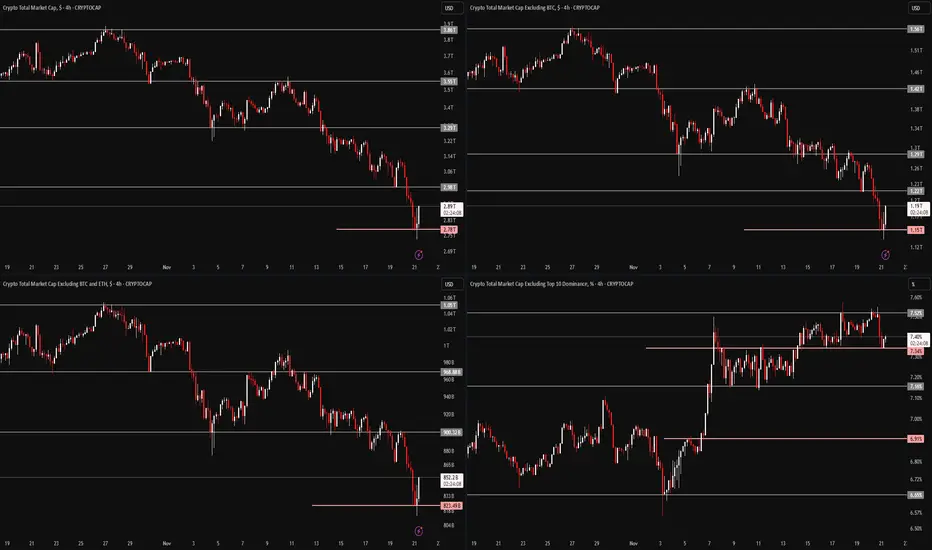
🔶 TOTAL (Crypto Market Cap) – 4H Timeframe
On the 4-hour timeframe of TOTAL, we can see a strong correlation with Bitcoin’s chart. After approaching the $4T zone, the total market cap went through a deep correction, testing multiple support levels and eventually breaking them.
It’s now sitting around $2.78T, marking a $1 trillion drop, which is something unprecedented in the crypto market.
The current support lies at $2.78T, and this level aligns closely with the upper resistance of USDT dominance, creating an important confluence. If this confluence strengthens, TOTAL may continue moving downward while USDT dominance pushes higher.
The major resistance for TOTAL is the $3T zone, and a breakout above it could create a pullback to the recent Bitcoin decline.
🔶 TOTAL2 (Altcoin Market Cap Excluding BTC) – 4H Timeframe
On the 4-hour timeframe of TOTAL2, we see a strong correlation with Ethereum’s chart.
TOTAL2 dropped from around $1.5T down to nearly $1T, following the recent sell-off in Bitcoin and Ethereum. It tested its supports and eventually lost them.
Currently, TOTAL2 is positioned near $1.15T, and breaking below this level could lead to a deeper correction in Ethereum.
On the other hand, reclaiming and breaking above $1.22T may push TOTAL2 upward and act as an early signal for a new bullish wave (mostly a pullback) in Ethereum and its ecosystem projects.
🔶 TOTAL3 (Altcoin Market Cap Excluding BTC & ETH) – 4H Timeframe
On the 4-hour timeframe of TOTAL3, the chart aligns with the performance of the top 10 altcoins.
TOTAL3 previously hovered around $1.05T and has experienced a milder decline compared to TOTAL and TOTAL2. It is currently sitting at its major support near $832B, testing a multi-timeframe support zone.
A breakdown of this level could extend the correction across the top altcoins.
However, breaking above the $900B area could generate a pullback and corrective wave against the recent downside leg, signaling potential upward movement.
🔶 OTHERS Dominance (others.d) – 4H Timeframe
On the 4-hour timeframe of OTHERS.D, we’re looking at one of the most important crypto indicators, especially in times like this. This index helps us understand when the altcoin bull market (altseason) may begin and when it's time to start building spot portfolios.
Despite the market volatility, OTHERS.D has held itself inside a stable 4H trading range and is currently reacting to the midline of its 1H range.
If Bitcoin dominance had increased during this period, altcoins could have faced an even deeper correction. However, on-chain data shows that altcoins are receiving far more attention compared to previous years.
A breakout above 7.52% on this indicator could be an early signal of a potential upcoming altcoin bull run.
🛞 Risk Management & Disclaimer
Please remember to always use proper risk management and position sizing. Nothing in this analysis is financial advice. The market can change quickly, so always trade based on your own strategy, research, and risk tolerance. You are fully responsible for your own trades.
FireHoseReel | USDT Dominance & BTC Dominance Overview😄 Hey! How’s everything? Hope you’re doing great!
🍾 Welcome to FireHoseReel — make sure to follow and enjoy the analysis along the way.
If you ever want a custom chart breakdown, just leave a comment and I’ve got you.
😎 Let’s dive into the analysis of two major crypto dominances: USDT and Bitcoin.
✔️ USDT Dominance Technical Analysis
• On the 4-hour timeframe of USDT dominance, we can see that after repeatedly breaking through multiple resistance levels on the chart, USDT.D has reached a point of heavy overbought conditions. It’s now sitting at a strong resistance zone.
If this resistance breaks, USDT dominance could push even higher, which would bring additional downward pressure on the market, especially on Bitcoin and altcoins, leading to another wave of selling.
• If USDT dominance rejects from this zone and starts moving downward, the nearest support to be tested is around 6.148%. Losing this support would signal the beginning of the first bullish wave in the market, giving us a potential opportunity to start opening long positions once this level breaks down.
• Another key level is the resistance at 6.623%.
If USDT dominance breaks above this level, it could trigger an even stronger bearish wave compared to the previous one, causing a deeper correction across the market.
✔️ BTC Dominance Technical Analysis
• On the 4-hour timeframe of Bitcoin dominance, we can see that after the recent market drop, BTC.D also moved downward and went through a relatively deep correction.
What’s important here is that despite the decline in Bitcoin dominance, altcoins did not experience a heavy correction, and most of them held their levels without major downside movement.
• If Bitcoin dominance loses the 58.80% level, it could extend its correction even further.
However, the key reversal zone for the 4-hour trend lies at 59.31%. A breakout above this level can trigger a solid bullish wave in BTC.D.
• Our confirmation for this bullish wave would be the formation of a higher low above this resistance zone, signaling a potential upward trend continuation.
🛞 Risk Management & Disclaimer
Please remember to always use proper risk management and position sizing. Nothing in this analysis is financial advice. The market can change quickly, so always trade based on your own strategy, research, and risk tolerance. You are fully responsible for your own trades.

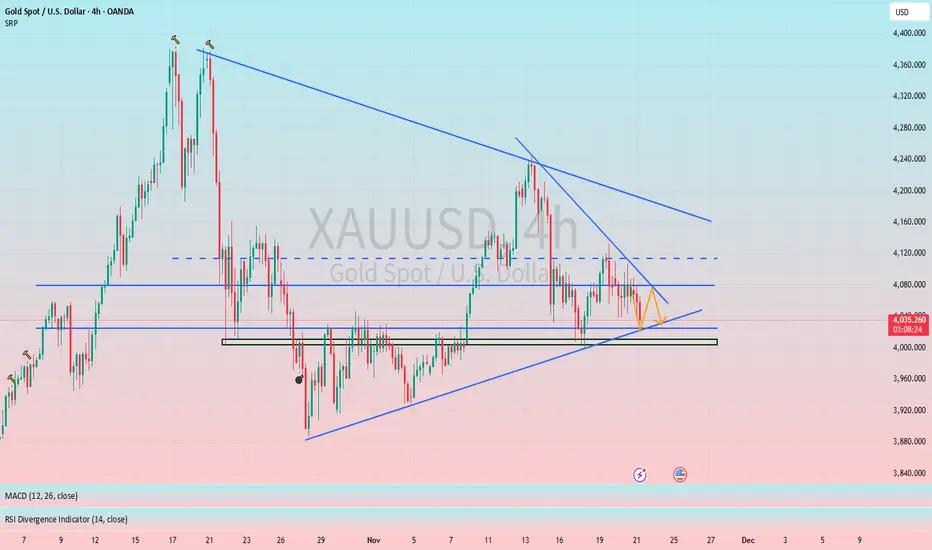
Breakout from a triangle pattern indicates a potential direction#XAUUSD OANDA:XAUUSD TVC:GOLD
From a trend perspective, gold is currently in a triangle consolidation range. As time goes on, the short-term resistance is also moving downwards. Therefore, gold did not provide us with a suitable opportunity to participate in trading last night. Gold is currently continuing its decline and may further test the 4025-4015 support level. If it pulls back to this level, we can consider a small long position in gold.
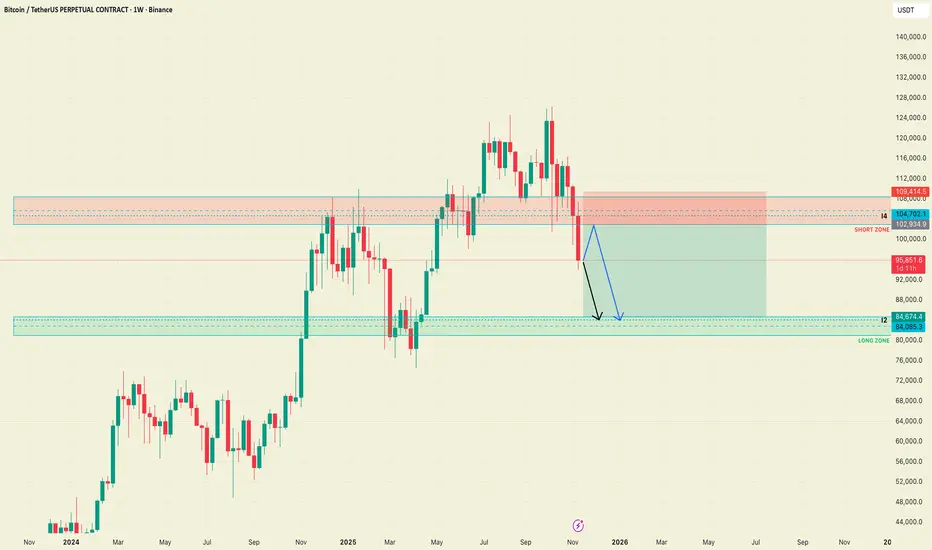
BTC after reaching the targets from the previous analysis After reaching the targets from the previous analysis, I see two possibilities from a weekly timeframe:
Either the price directly drops to $84,085, or BTC makes a pullback to values between $102,934 and $104,702, from where I would look for a short position towards $84,674.
My trading plan would be:
Entry: $102,934.9
SL: $109,414.5
TP: $84,674.4
RRR: 2.82
Gold 🔵Entry
🔴SL
🟢TP
*`ANALYSIS`*
1. Strong support level respected several times
2. 30 min candle closed below support, meaning support is broken
3. Didn't sell cause the SL would have been big & the candle was breaking the previous candles low in first 2minutes without making a liquidity wick first.
*`Entry`*
When price broke the low of previous exhaustion candles wick with stops above the previous 15min candle high.
*`Set-up`* Impulse Entries
*`Session`* Pre-London
*`Trade Result`*
+0.8%💰
+24pips🎯

FireHoseReel | BNB Daily Analysis #2😄 Hey! How’s everything? Hope you’re doing great!
🍾 Welcome to FireHoseReel — make sure to follow and enjoy the analysis along the way.
If you ever want a custom chart breakdown, just leave a comment and I’ve got you.
😎 Now let’s jump into the analysis of my favorite coin: BNB .
👀 BNB – 4H Timeframe
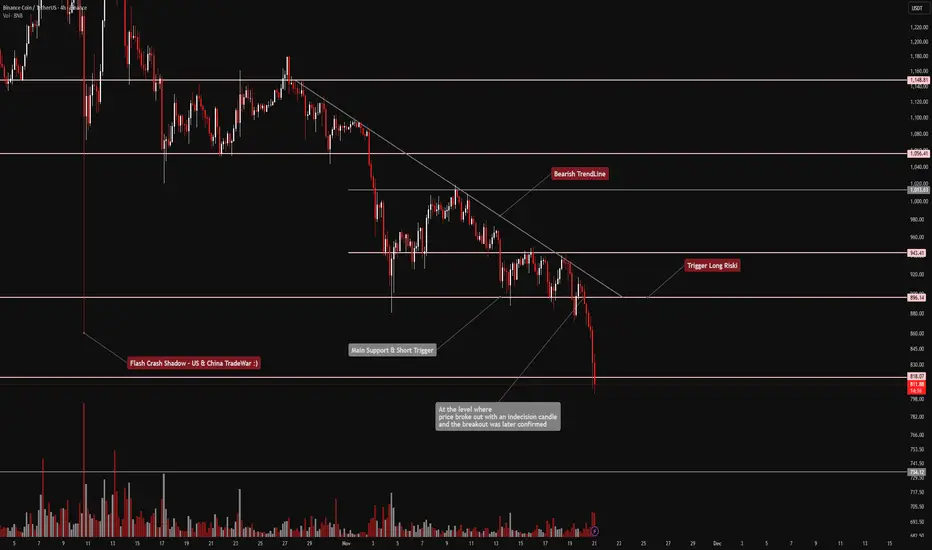
BNB recently gave us a short trigger on the 4-hour chart after breaking its key support at $896. Price dropped right toward our first target at $818, hit it cleanly, and is now stuck in a “mid-zone” with no clear direction.
Even on a multi-timeframe view, we currently don’t have any valid entry trigger, so we need to wait for new structure formation before planning the next move.
📊 Volume Analysis
Our volume indicator played a major role here:
Once the support broke and the short trigger activated — exactly as mentioned in yesterday’s analysis — sell pressure increased sharply.
Whales also started selling their BNB as soon as the support failed, and many traders used this opportunity to enter short positions.
Volume is still showing bearish pressure, and the last two 4H candles had a strong increase in selling activity, turning into clear downward momentum.
✔️ Now let’s analyze something different — BNB/BTC pair
On the 4H timeframe, this pair is still moving inside its trading range and has managed to maintain its relative strength against BTC.
However:
• A breakout above the range high at 0.010162 could trigger a strong bullish move
• A breakdown below the range low at 0.009800 could lead to a deeper correction in the BNB/USDT pair and accelerate the bearish momentum there
For now, the pair holds a bullish bias, but we need confirmation through an actual breakout.
✍️ Current Scenarios
We don’t have a new setup today, as yesterday’s short position already played out and is still valid.
For a new entry — long or short — we need BNB to build a fresh market structure and give us a clean trigger.
Until then, patience is the best strategy.
🛞 Risk Management & Disclaimer
Please remember to always use proper risk management and position sizing. Nothing in this analysis is financial advice. The market can change quickly, so always trade based on your own strategy, research, and risk tolerance. You are fully responsible for your own trades.
Why is Microsoft Stock $MSFT dropping hard?Microsoft just did what every impatient trader hates… after a massive rally, the candles are shrinking, emotions are rising, and here comes the correction everyone said ‘couldn’t happen.’ Today I’ll show you—using pure supply and demand—why MSFT is being magnetically pulled back into the monthly demand imbalance like a toddler to a candy shop. No fundamentals, no drama… just price action, imbalances, and patience. Let’s dive in.
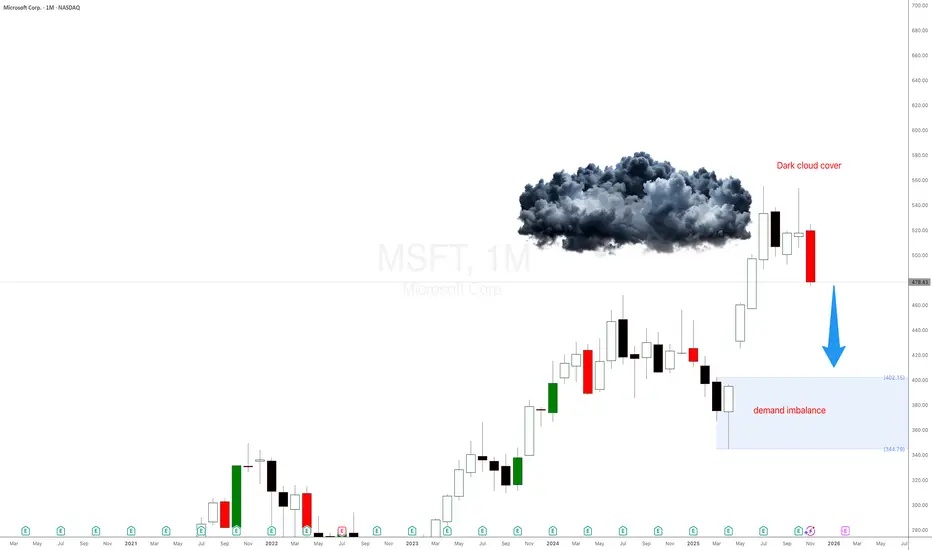
Microsoft Monthly Supply & Demand Analysis
After Apple’s strong monthly correction setup, Microsoft (MSFT) is showing the exact same pattern — but even cleaner.
This is what I love when I teach traders to learn to trade stocks using pure price action and supply and demand imbalances. You don’t need news, earnings, or any guru opinion — everything is already priced in at the higher timeframes. Just like I explained in the Supply and Demand Free Course , the bigger timeframes tell you what the professionals already did months ago.
Let’s break it down.
Candles Shrinking = Momentum Weakening
Fast-forward to mid/late 2025:
- The wide-bodied candles disappeared
- Small-bodied candles appeared
- Then came the big bearish candle
This is classic momentum decay. This is exactly when most traders start acting emotionally:
- They zoom into 5-minute charts
- Their IQ drops by 50 points
- They forget the trend
- They forget the imbalance
- They become chart zombies
But price action never lies — we’re simply seeing exhaustion after a massive markup.
Is Apple Stock $APPL About To Crash Hard?Apple. Yes, one of the most liquid, most loved, and most worshipped stocks on the planet is about to teach retail traders a very expensive lesson. And no, you don’t need fundamentals, Bloomberg breaks, or Tim Cook whispers. You just need supply and demand imbalances, price action… and a little patience — the hardest skill ever created by nature.
Let’s dive into why AAPL could drop like a stone straight into the next monthly demand level. And yes… smaller timeframes can turn us into absolute dummies, so today I’ll save you from yourself.
Apple. The king of liquidity. The heavyweight champion of market capitalization. The stock that every beginner wants to buy… usually at the worst possible moment, of course.
And today, we’re going to talk about what really matters for the next years — the monthly supply and demand structure, not the tiny little M15 candles that make us behave like confused chickens.
Why Apple Is Setting Up a Major Drop (Again)
AAPL has been in a long-term bullish trend for years, but what many traders forget is this:
👉 Rallies eventually need to correct.
👉 Big imbalances act like magnets.
👉 Smaller timeframe “signals” make people behave like total dummies.

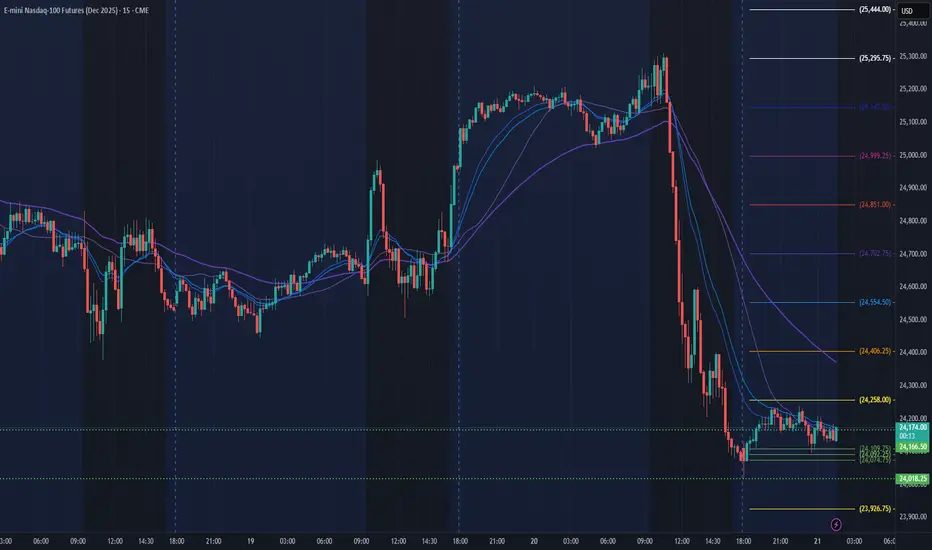
NQ Power Range Report with FIB Ext - 11/21/2025 SessionCME_MINI:NQZ2025
- PR High: 24166.25
- PR Low: 24018.00
- NZ Spread: 331.0
Key scheduled economic events:
09:45 | S&P Global Manufacturing PMI
- S&P Global Services PMI
Session Open Stats (As of 12:35 AM)
- Session Open ATR: 525.13
- Volume: 66K
- Open Int: 301K
- Trend Grade: Long
- From BA ATH: -8.4% (Rounded)
Key Levels (Rounded - Think of these as ranges)
- Long: 26636
- Mid: 25410
- Short: 24039
Keep in mind this is not speculation or a prediction. Only a report of the Power Range with Fib extensions for target hunting. Do your DD! You determine your risk tolerance. You are fully capable of making your own decisions.
BA: Back Adjusted
BuZ/BeZ: Bull Zone / Bear Zone
NZ: Neutral Zone
CRUDE OIL (WTI): Bullish Move After Trap
There is a high chance that Crude Oil will pull back
from the underlined daily key level.
I see a confirmed bear trap followed by a bullish imbalance
candle on an hourly.
I expect a rise at least to 58.51 level.
❤️Please, support my work with like, thank you!❤️
I am part of Trade Nation's Influencer program and receive a monthly fee for using their TradingView charts in my analysis.

Nasdaq 100, Tesla and Apple OutlookWall Street is on the verge of closing lower for a third week for the first time in eight months. I explain why I think there could be further losses ahead, why Tesla (TSLA) is a preferred short setup and why to keep an eye on Apple (AAPL).
Matt Simpson, Market Analyst at City Index

AUDCHF: Price Cross Below H1 ATLDaily TF:
Price is ranging with a weak bearish bias
Strong trend indication will occur after price breaches below HTL
H1 TF:
Price crosses below ATL
Sell stop triggered as downside momentum is expected to pick up

NZDCHF: Trend ContinuationDaily TF
Not much to say other than price is in a clear downtrend
H1 TF
Price crossed below ATL and is holding
EMA20 is barely below EMA60 so this is a weak downtrend confluence
Trading: definitely proceed with caution and consider reducing size and then scaling in momentum picks up

AUD/JPY: Exhaustion at The High?AUD/JPY briefly traded at a 16-month high on Thursday before reversing lower. At current levels it’s on track to form a spinning-top doji on the weekly chart, and it has already printed a shooting-star candle on the daily at the November high and monthly S1 pivot.
Given the multi-week bearish RSI divergence and false breakout at the highs, the bias is for some mean reversion towards at least the 20-day EMA. The 100 handle and 50-day EMA near the January high also make viable downside targets for bears, should the yen enjoy a bout of risk-on strength.
Matt Simpson, Market Analyst at City Index.

Gold Bearish OutlookExpecting CSE:GC TVC:XAU to be bearish for the rest of the month
- Seasonals lean bearish till EOM
- Commercials are highly short while Small traders are highly long
- OI relatively high
- CLEAR Market structure break
- CLEAR IRL to ERL target

BITCOIN ON MOUNTLYHello everyone,
I’ve been reviewing Bitcoin on the monthly timeframe and analyzing its local lows, and the results turned out to be quite interesting. Since the major correction in December 2017, Bitcoin has shown recurring corrective structures on this timeframe. When measuring the drawdowns from cycle tops, we typically see corrections in the 70–80% range. Also, before each major downturn, the price tends to form two local lows, with the second one usually providing traders a final opportunity to exit.
This year, based on both historical behaviour and current market dynamics, we’re seeing a similar pattern develop. Considering these factors, I expect the market to remain bearish for at least the next nine months. I see the current potential bottom near $58,800, and if this level breaks, the maximum correction could bring Bitcoin down into the $29–33K range.
On the upside, the $93–102K zone remains, in my view, the most favorable range for exiting the market.
Wishing you all success.

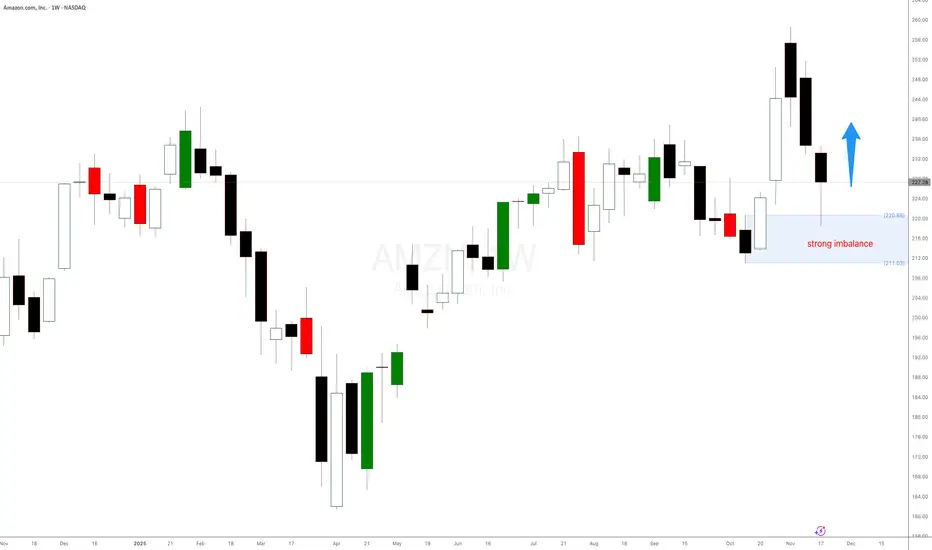
Is Amazon exploding again? New weekly demand in controlIs Amazon exploding again? New weekly demand in control at $224. Expecting a decent rally from here in the following days.