A Crypto Year In Review - Life ends, but death lasts foreverIt's been exactly a year since I got into this market, and it's been quite an adventure. I've learned a lot about myself, psychology, and market behavior. It hasn't been easy. However, a year of my life has gone, and I'm not really comfortable with losing any more of my life to observing this market. So, this will be my final analysis until I see fit to return, which will probably be tomorrow ; ). Just kidding. I really need a break, and it's possible you won't see me until sometime in January. Mental health is important, and this market is brutal. This is only to my small group of followers (and to myself). If you want to skip most of the text, just read the 4 bullet points at the bottom.
I had a feeling that we'd eventually need to meet the log trend line formed at the end of the previous bear market. Didn't think it would happen this quickly, but here we are. As you can see, today's "bounce" happened right on that line, in the 4200 area. There are no long term supports below 4100 or so, which means bulls better hope it holds. Right now, it seems like it's failing, but the 4K-4.1K area is holding FOR NOW. The only "supports" below here that I can see are 3K, 2.5K, and 1.8K (dotted lines). It's actually pretty good that we've gotten to this area so quickly, because now we can get it over with and see if there's any real strength left in the market. There are definitely a large amount of buyers here, which is good (confirmed by volume). They may need to see this log line continue to hold before confidently entering bigger positions though. Additionally, the U.S. Dollar really does look like it's on the verge of collapse. This would be good for Bitcoin. This really doesn't look like a convincing bottom yet, which is concerning. This next drop needs to cause a significant spring, ideally all the way up to the 5200 area. Either that, or we need to stall here and slowly move up along the log trend line, as we did at the end of the previous bear market. Since this market is so crazy though, anything can happen. Bitcoin can crash all the way to 2K and rebound in a single day, if a group of whales plan accordingly. So be extra careful. I'm posting this as a YOLO long trade just for fun. If it goes up from here, it would be nice to see my chart turn green when I push the arrow :P If it crashes and burns, so be it. Lessons learned.
Alts are showing some bounce attempts now...though most of these bounces are continuing to get sold, which is good for day traders, as they can just keep swing trading to accumulate more for the "real" bounce up, or the next breakdown. Volatility is clearly back with a vengeance, and if you're caught on the wrong end of a trade at this time, it wouldn't look good. This market is not a very forgiving casino at the moment.
I am still more bullish on alts like XRP and XLM than Bitcoin. This can change, but they've shown such strength recently that I have become a firm believer in their resilience, and their ability to become true payment methods in the future. They are starting to show some signs of weakness though. There are also hidden bullish divergences going on in alt price action as well. For example, we should have seen BAT crashing down below 3K on the BTC ratio, but it has held 3500 quite well so far. This signals to me that it may be ready to reverse its long term downtrend against Bitcoin. Also, NANO, which I have used often to gauge market sentiment (as speculative investors see it as a "new" Bitcoin alternative), has gotten back to its 2600 support pretty quickly, although it's still struggling to hold. This is fairly bullish, nonetheless, and it's still above the $0.75 bottom from August.
For future reference, I am making a list of which popular alts have shown the most strength (in my opinion), and which have shown the most weakness. This is based on a variety of factors (volume, ability to hold support since the August 13th 2018 bloodbath, active communities, strong marketing, good investor sentiment overall, etc). I speculate the ones that have shown the most strength will have the biggest returns in the near future, and many of the weak alts will remain flat for a while until improvements are made, or until they fade away completely. As with every huge speculative market crash, certain assets never recover. What goes up must come down, but what goes down doesn't necessarily have to go up. Life ends, but death lasts forever. This is why I can't waste more time on this market.
Anyway, this is not a complete list. These are just specific ones I've been keeping track of over the last year, and observing their performance. I have held each of these coins, at least briefly, in the past year. Bitcoin would actually be on the weaker list, along with Bitcoin Cash, because they've been having an identity crisis (investors will likely be turned off by this), and have inferior technology to XRP and XLM. They have also dropped below support levels more than some alts. Some of the strong alts are making a case for potentially flipping Bitcoin in the future in terms of market cap value. This has something I've been saying for a while. I'll admit, it's totally speculative, but I was right at least in the short term, that XRP and XLM would continue to do well despite the market sell-off. You can read about why I predicted that in my previous analyses. Here is the list:
STRONG ALTS:
XRP
XLM
BNB
NANO
EOS
GVT
SLT (1000% since February, 500% since I bought in, even in this bear market) - The biggest winner in my portfolio, but the smallest investment (oh the irony). I sold half my stack recently back to XLM to take some profit, but I have a feeling it could go up much more long term. Still waiting to buy back lower. Patience is key in any market.
NEUTRAL ALTS:
IOTA
BAT
ADA
TRX
VET
WEAKER ALTS:
NEO
ETH
ENG
WTC
ICX
OMG
This list is obviously subject to change, but this is how I see it now. We'll see how all these coins do in the future.
Anyway, for anyone reading this, I hope you've enjoyed some of my analyses. A year constantly observing this market is enough for me. It'll be fun to look back in a few months time to see how everything plays out.
My speculations in summary:
1) XRP may very well surpass Bitcoin, and XLM may very well surpass ETH
2) Bitcoin IDEALLY needs to hold 4100-4200 to remain bullish long term, but a GIANT bullish wick to extreme lows (3K-1.8K) IS possible, so be careful.
3) Some alts look much better than others
4) Life ends, but death lasts forever. Get out and enjoy your life.
Here is my recent post about the market (on the XRPBTC chart):
And my recent Bitcoin analysis:
This is not investment advice. I am clearly not a professional financial advisor. Just someone who knows a bit of TA and has been following this crazy market over the last year. Bye for now.
Good luck!
-Victor Cobra
Capitulation

Bitcoin | $BTC - $BTCUSD | Don't panic just HODL think long termNo need to Panic if you are a Hodler for the long term.
This is Capitulation!

Load up your trolleys and grab a mary poppins umbrella!Bitcoin fell to new lows as I'm sure everyone frantically knows and my previous trade was stopped out. In hindsight I should not have been using Bitfinex charts. The discrepancy between exchanges makes for inaccurate TA so I'll be sticking to Coinbase for my market direction until there's parity again. Not all bad news though, we may have had the capitulation we were waiting for. Before all the lucky perma bears start screaming the dirty $3k number all over the place, Bitcoin seems to have found support on the larger previous trendline connecting the highs in December 2017 to the highs in July 2018. This could potentially mean that the pop we had on 15 October was a break out from a prior falling wedge and we have now successfully tested that wedge as support. If we drop back into this wedge I am expecting a large rebound. RSI is also oversold at the lowest levels it has been since January 2015, so I don't believe that there really is not much room for additional selling pressure. Same applies to all relevant time frames so get shopping and load your trolleys.
A move back into the apex of the previous wider falling wedge will hopefully see a breakout from there. When tether drops like this the market becomes unsettled so hopefully the volatility keeps on creeping back over the next week so the breakout can take place with strong volume.
If we have a deathcross on the 3D chart between MA50 and MA200 then this trade is trade is invalidated and we stay below the trendline resistance at least until SEC decision date on 29 December 2018 imo so keep an eye on your 3 day moving averages and use appropriate risk management, especially at these levels (if you're swing trading).

BTC 3D must hold 200 MA. Dump looming? Calm before the storm?Will the bears hibernate this winter? Obviously, there has been a lot of comparisons between the 2014 and 2018 Bitcoin bear markets. While the fractals haven't been identical, I think we are somewhere in the red box and will soon start the final capitulation dump. Currently, we're at the end of a massive descending triangle, which break to the downside 70% of the time, so a break of market structure and increased volatility is imminent. The 3 day is on the 200 MA with multiple EMAs all pointing towards the downside/200 MA cross. Ask yourself this: Why hasn't the price action responded to all the positive news in the market? Why do we continue to make lower-highs on the daily? Why do we continue to have bearish EMA crosses on multiple time-frames (3D, 5D, Weekly)? Oh, because WE ARE IN A BEAR MARKET. And this market has been too positive, in my opinion. Plan to hear some bad news and major FUD, soon. I think we can easily drop 50% from here before the next bull market. Moment of silence for all the people that got liquidated on that $1500 candle stick a few days ago... Personally, I'm taking a neutral position in fiat with a bear bias and ready to catch these bounces for some nice swing trading. Remember to look at the big picture (weekly + monthly) charts - we are clearly in a bear market and they end in capitulation. With that said, I think 2019 will be the year.

Bitcoin Macro AnalysisHere's another Bitcoin Macro Analysis:
1. D1 BB is max squeezed since the start of 2018 - high volatility major move soon (up or down)
2. volume is consolidating/declining - end of correction soon (move up or down)
3. some alts are starting to pump: XRP, BCH, LTC (both bullish or bearish)
4. shorts have declined from the record highs 40000 but are rising again towards 31000 and still above longs at 27000 (both bearish or bullish)
5. BAKKT launch in november soon (bullish)
6. ETF decision kind of postponed (bearish)
7. DOW S&P FAANG at record highs - possible stock market crash soon (bearish)
8. DXY starting to rise (bearish)
9. NVT Ratio at record highs charts.woobull.com (bearish. bullish only in massive adoption)
10. Fear and Greed Index rising (bearish or sideways)
11. We are making new higher lows since July (bullish)
Common sense:
1. BTC will not drop while shorts >> longs. It will likely drop when shorts < longs or around the same level.
- If everyone's shorting who's making the money? Whales/Exchanges simply won't give away their money to bears for free.
- It will most definetely drop only when shorts are at record lows with longs high enough
- they don't have enough liquidity to instantly drive the price up, people aren't bying, there's no follow through.
- they make money by slightly squeezing bears in sideways ranges until enough shorts are liquidated, longs are on a rise and it's finally time to drop
2. Stock market crash/dip will also mean BTC drop and Gold rise which can happen prior to or around the same day just like in Feb 2018.
- The opposite is not true. BTC collapse will not result in a stock market crash, but rather in a small dent
- BTC in general does not correlate with DJI and S&P, only with major trend defining moves.
- Some say the new Great Depression and Financial Crisis 2008 is coming
3. DXY sometimes reverse correlates with BTC on large TFs
- Fed rising interest rates => DXY rises => BTC drops
4. Pumping alts may signify a BTC rally soon (bullish) or an alt season (bearish)
- It's easier to pump a cheap alt and shift market sentiment to bullish
- Alts have their own cycles and a cycle in relation to BTC.
- In a normal market When BTC moves up a bit some alts follow, some decline
- when BTC moons/crashes alts moon/crash 5-10x more. In anticipation of a BTC rally alts can pump 5-10x more than the subsequent BTC move
- if an alt has already pumped prior to BTC move it won't likely pump again after
- alt season happens during BTC consolidation after a major move. During this time alts have their own cycles and are less dependent on BTC
pump cycle: ALTUSD -> ALTBTC -> BTCUSD -> ALTBTC -> ALTUSD
alts are sold for BTC, which is used to buy other ALTBTC pairs which are pumped in their turn, then BTC is pumped up and sold to complete the cycle
5. BAKKT is legally required to have BTC and should be accumulating now. They might have their own ETF/Futures, they don't need SEC's approval
They will rather buy it before launch and dump it after when the price rises.
6. High NVT Ratio means either massive adoption (which is definetely not) or a bubble and a crash soon.
7. Fear and Greed Index is a cumulative sentiment across all major platforms: buy when index is low, sell when index is high. It's rising now, not good time to buy.
8. Making it seem an overly Bearish Concept
- when market comes to a point when there's not enough liquidity and sellers willing to sell whales use fake sell walls to continue to accumulate and squeeze last bits.
- when accumulating the Market Makers usually don't sell their BTC to make the price go down further, but rather open large fake walls of shorts to scare people into selling into their longs
- that's why there's no big short squeeze, because there's nothing to squeeze - whales will remove the walls once the price approaches
- you can spot it when price first drops into a trading range with shorts rising and then pops back up out of it with the same amount of shorts closing (the avg shorts remain the same before and after the range)
____________________________________________________
There are 2 counts:
1) WXYXZ (red)
triangle in Z and the end of correction - both bullish and bearish
- Bullish - we may go up and retest 11000 pivot (thin Ichimoku cloud will soon allow that) in 12345 up trend
- Bearish - WXYXZ can transform into a larger WXY and become only its first W wave, with whatever wave X up follows being just an upwards correction
2) WXY (blue) - bearish
Down Trend continuation in wave Y
Key levels (may trigger a major move):
- Supply Line (purple)
- Down Channel/Triangle Top (green)
- ADCDE triangle top side (yellow)
- Pitchfork top band (green)
Key targets:
- Pivot Retest (11750) (max possible price till year end)
- Pitchfork Mean Line (4200)
- 5150 and 5500 Demand Zone bottoms
- 23.6% Fib level Algo Target + Y of WXY Projection Confluence
- 7500 Demand Zone tops
- 7400 D1 SMA/EMA 200
Good Luck! Please, don't trade based only on my analysis, confirm/disprove using other sources.

Bitcoin: We're gonna ri-ri-ri-ri-rise til we fall!Bitcoin is in a bullish pennant and we have RSI hidden bullish divergence on the 4 hour chart. BTC has found support at $6560 (0.618 fib) and we will probably have some sideways action until we have a breakout to the upside within the next day. Volume has been dropping steadily so expecting capitulation once we get closer to our pennant support. The break out should coincide with a break above the Daily MA50 and the break above the pennant resistance should take BTCUSD above the Daily MA100 at around $6750.
We can expect strong buying pressure once we break through the blue trend line which connects the peaks on 24 July, 4 September and 28 September. Price should then carry enough momentum to break the heavy $6800 resistance and should then reach $7026 at 1.272 fib with an extension to $7127 at 1.414 fib. $7127 also coincides with the large yellow trend line resistance which connects the peaks at 05 May and 24 July. A close above this yellow trend line above $7272 at 1.618 fib should spark a short term rally, however this will be a strong level of resistance given its fib positioning and price could turn from there for a retest of $6800 support. This yellow trend line also serves as resistance for the large bearish descending triangle playing out on the weekly chart.
Remember the bear market is not over until BTC is over the daily MA200 so take caution when everyone starts piling in to the 4th quarter ''bull run".
Good luck and happy trading!
Previous analysis:

How To Spot The beginning of Bitcoin Capitulation Look at chart. The perma bulls that are going to get slaughtered are going to say short squeeze once shorts reopen at at 6900/7000 after the market makers absorb all the liquidity from 5950 upward and fill their shorts at 6900/7000. Since everyone has a potential 6900 target they will break 7k making a fake breakout appear to the upside only to absorb all your liquidity since you just fillled their shorts.
Whales have to make a broadening wedge down to 5950 to get as much liquidity for the final move up to the 7k region because on balance volume in the market keeps going down. They break 6k in order to liquidate the fomoshorts to fill a larger position in their longs
Remember chad whale buying up all the bitcoin all the way up to 7300? He Filled his Shorts at the top, MY short squeeze we going to the moon. Who in the world is gonna squeeze them if their is no whale buying pressure left to the upside. Why didnt anybody squeeze the chadwhale's shorts at 7300? You would think some whale would have with that many shorts would be targeted by another whale for a short squeeze would have created a gigantic move up if they wanted the market to go bullish.
Think like a Market Maker. Do a false breakout by breaking just over 7k to get everyone bullish to you fill their shorts. On balance volume is lowest since Sepember/August 2017 when price was 3 to 5k. The market makers need to take the price lower to increase the on balance volume in the market to provide more liquidity( look at the on balance volume). Look at the weekly order blocks for on balance volume for the most liquidity for the market makers

Bitcoin Price on Thin IceBitcoin’s support zone between $6500 and $5750 has been under ceaseless attack throughout 2018 and on each occasion the buyers have come in to firm up the price, but are the cracks starting to widen? After a hard sell-off at the beginning of the month of September, Bitcoin's critical support zone (orange area) was once again tested and once again it held. This price zone is the thin ice that has staved off a plunge into icy depths which would surely make even the staunchest Hodler shiver!
It is clearly noticeable that the rally off the support zone has become weaker on each occasion. Currently, volatility is low relative to historical price action which is clearly illustrated by the narrowing of the Bollinger Bands. Low volatility is a precursor for impulsive price action, which suggests that spill to the downside from here may possess the required momentum to finally break through the resilient support zone.
Should we break through, I expect the price to fall hard and fast. Looking at previous levels of significance, I believe that likely areas of potential support exist at $5000 and $3000 (red dashed lines). Of course, it is also possible for the price to break out the prevailing bearish trend with a move to the upside. We will need to see the price move above at least the local high at $7500 and then $8500 before bulls can start to claim that the bearish trend is invalidated (blue dashed lines).
Bitcoin has had a torrid 2018 and whilst personally I am bullish on Bitcoin and crypto in general from a fundamental perspective, the harsh reality is that in the short/ medium term things can get worse. Bear markets that follow periods of extreme overperformance, as witnessed in crypto markets last year, commonly experience extended periods of underperformance. At least for now, a battered Bitcoin continues to tread warily above the icy crust, but a crack in the frozen surface is likely to give way to a hypothermic decent.

BTCUSD 4H - UpdateBTC has continued to exhibit bearish behavior over the past week, unable to close above $6540 and is now flirting near the lows of the support zone. We can see that BTC broke down from the bearflag and is now stuck in another triangle near the lows.
We can expect a bounce to trigger stops above the $6500-$6600 level before continuing lower and testing the lows of the year. If the lows do not hold, we can see that most stops will be placed around the $5750 area, which would cause capitulation of the entire crypto market.
If the capitulation does occur, most investors/traders will panic to get out of their positions, which will cause the market to plunge quickly and violently to the $5400-$5100 area. Unless the market gets good news regarding this months ETF decision, there isn't much bullish sentiment or news to propel BTC upwards.
Please hit the 'like' button and give us a follow!
As well, let us know what you think about our chart and where you see BTC price heading.
Thanks

BTC. If sh** happens-- I don't think we're going to run away from here to the South, but sh** happens. Just a plan B. It's better to have one. So. This are our lowest supports. Still waiting for price rising up to ~6800.
!! Stay tuned via discord, telegram and twitter.

ETH Capitulation - Is there an end in sight? During the beginning of the crypto sell off earlier this year, Ethereum was one of the highest performing alts for a great period of time.
I believe this was because during the beginning of this bear market, people were not as hesitant to take risky investments such as ICOs, AND also, many ICO developers were likely cashing out their tokens for Ethereum, all in turn, helped levitate the price.
However, as time went on, and the bear trend did not reverse, people began to panic.
ICO bag holders went running for cover, cashing out what little was left of their investment.
All mean while ICO developer whales realized it may be time to cash out their MASSIVE stacks of Ethereum while the price is still relatively high.
All in turn we get Ethereum capitulation.
Now I do not know if the end is in sight,
however, based on harmonics, we have a possible Bullish Gartley setup on the ETH/ BTC pair.
Not only that, but ETHUSD is nearing my first support level buys at 230.
Based on my trading strategy, 2 out of the 2 currency pairs show possible support around these levels. I plan leverage against my USD to start building a ETHBTC long. If all goes to plan and ETHUSD finds support, I will start purchasing Ethereum outright.
My preferred entry is right at the 1.618 fib level
I hope you all enjoyed my analysis!
Please let me know what you think in the comments below!
DISCLAIMER:
Please note I am only providing my own trading information for your benefit and insight to my trading techniques, you should do your own due diligence and not take this information as a trade signal.

A Theory about Bitcoin"Short now, and buy in at 5,600."
Is what I would recommend if I were more confident in my analysis.
I just want this post to point out a few things.
Bitcoin hasn't reached a long-term RSI around 44 in quite some time.
Bitcoin RSI was only this low in 2016 Q3-4. The prices was roughly $560.
So why does this matter? The answer is entirely speculation. My current understanding of bitcoin is that multiplying by 10 to the price doesn't change what makes bitcoin special, the technology speaks for itself. Money should not be easy to create hence the surmounting difficulty of minting and mining bitcoin (as well as various other mineable alts). This also being attributed to the bi-yearly reward halving (ie 2018 bubble & 2020 www.bitcoinblockhalf.com ).
Here is where things get a little more esoteric. If a short bull run in 2016 corrects to 560, then who's to say we won't see a bottom of 5,600. What is so special about $5,600 and $560?
Psychology my dear Watson.
I remember a friend of mine saying, "Do you know how long I was waiting for 5k bitcoin?" It was a huge price point for him as well as many strong-handed investors. What we are all waiting for is "capitulation," where bears and bulls cannot decide on which way to go. For bitcoin however, it's obvious the answer will be to go up.

Capitulation?I see the signs of capitulation in the PM minder markets.
$Nugt could go up 80% like previous time, with a target of around $24.
However, I'm aware we haven't seen real capitulation yet, but from a technical perspective, things looks quite safe to go long.

I've seen this movie before - I know how it ends.Get your big boy pants out guys, this one is happening real quick. I'm starting to scale in. Ammo locked and loaded to continue scaling in through the low 200's
Fastmarket warning. I'm going to be updating this published post with lower timeframe stuff since the daily isn't low enough resolution. Gonna get real interesting. Going to be an interesting trade considering BTC is nowhere near as rekt as ETH.
I wonder if we'll set some bull divs on the lower timeframe as this thing digests the impulse move we just had.
Measured move play would be quite interesting. That's the main thing I'm banking on. Regardless of what happens, I think we're at the point of "breakeven or profit" for spot longs.

BTC Decision TimePrice is at an even $7000. 'Rounded Bottom' or 'Capitulation'. Let's see which way this goes!
(Chart mainly for my reference)

Capitulate or Accumilate?I have been day-trading almost every single day since late 2016, Overall I'm long my dream buy is 1,800 - 2,000
Everbody thinks that we are out of the woods, I am betting against that. Just another lower high, didn't even come close to 10k, watch out for old-key support/resistance levels on ALL coins. I like to check big moves and pair it up with bitcoins performance at the time, a great run in January ($3 per XRP) and BTC was 19k. If ETF does become approved this could validate consolidation rather than capitulation. Past performance of BTC is always a great time-capsule although not a crystal-ball clearly some projects are even still very overvalued or undervalued shareholders decide their fate. 90 percent of these projects keep in mind are still a huge WIP if developers stay committed so will the shareholders.
Happy trading everyone, and good luck!

BITCOIN : Load the FOMO train, capitulation comingHuge bearish divergence forming on 4Hr.
BTC Overbought on daily for the first time since December.
BTC Dominance at all time high since 8 months.
Alts bleeding hard, everybody selling to put money in BTC, making BTC break important key levels, to make people think bull run has started.
No retracement since the completion of inverse H&S.
People buying anticipating ETF Decision.
My point of view ? BTC is going to consolidate for the rest of the week. Probably going to 8.4k$ maximum. Might see some whicks above, but that will be it. Then we will see a huge sell off leading to capitulation. THEN, Bull run will be able to start.
100% Cryptosaurus Rex Certified.

Dow (capitulates) & kicks $GE out which may be great for longsEvery index fund will need to sell GE and this could create an opportunity in GE as price is near sellers exhaustion which could lead to capitulation. Although this would be a multi year hold, the fact that the Dow capitualted could open up for longs.

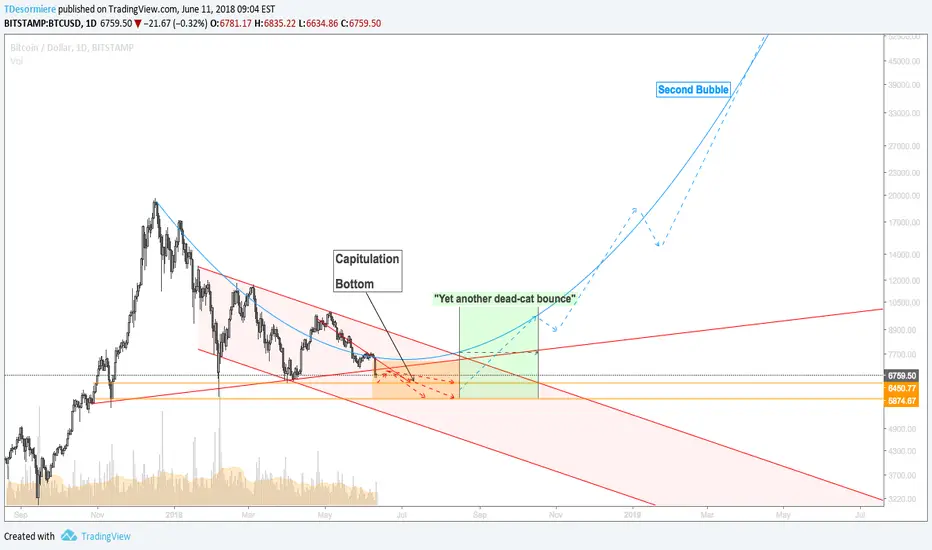
Second Bubble possibilityIf the flat phase happens this summer a bull market is likely at the end of 2018 and early 2019, and if big fundamental changes happen in the crypto-space (that could fasten crypto-adoption for example: fiat pairs on major exchanges and the removal of Bitcoin pairs, fiat gateways through tokenization, crypto-exchanges for tokenized traditional assets etc...) a second bubble is likely. For now the token mania has passed but we're still in a very irrational market, where many projects are launch while there is no demand: EOS, LISK and the hundreds of other cash-grab blockchain projects which bring little to no innovation yet billions in speculative investments. This shows that crypto is still in its very infancy.
As for Bitcoin, if nothing changes the bear market is likely to continue for several years:
Without changes in the fundamentals, Bitcoin won't stop losing value. It can't do many things and it does these things poorly (Bitcoin several years earlier was more widely used as a currency than it is now). What's keeping Bitcoin from going down is its network adoption, which is why its value will decrease at a slow but steady rate unless things change drastically.
Year of the Bear -> Ice Age -> Moon ? (Long term)Blow off top in 2017, need to have capitulation yet and have even hodlers doubt themselves feel long, intense pain and want to die, then "slowly" (relatively) build back up to just go parabolic again to 100,000+. Upon reaching 20,000 again I wouldn't doubt a sell off to 15,000 but then shoot to the moon, maybe 500,000, then crash to 50,000, rinse and repeat.

BITCOIN | The Path To Capitulation1.
Starting with the big picture, and no indicators I drew the path based on simple visual balance and symmetry. It looks to me bitcoin is currently drawing a large equilibrium triangle. I think of this as fading echoes from a dramatic wave up then down. Almost like a seizmagraph or an audio wave after a sudden percussion.
These echoes are getting smaller and tighter, once they flatten out, something will then catalyze movement. It could well be news, bad or good. It could go either way, however I think it may go down sharply and put in the real bottom before authentic recovery can happen.
2.
Then I drew the grand fibonacci pulling from $200 to almost $2000 as that appeared to be the location of the first significant impulse after long sideways action. It also seemed balanced in that it represents very close to 10x increase.
3.
Noticing the two fractals (waves 1+2 and 3+4 both look much like the grand wave 1+2) I pulled a fib on the 1 wave ($1759.79 - $4984.49) Notice reactions to the higher levels of this, even recently.
4.
I then started counting the waves as I see them: I think believe bitcoin is now in the fifth wave down of the larger C correction wave.
I believe we can look for capitulation to the top of the 1 wave with a possible pierce down to the .786 - this is in the range of $4984.49 to $4408.47 it should be quite fast and dramatic, only lasting a short period and then the bottom will be in for the 2 wave on the largest scale as we begin the 3 wave.
I'm not sure I have the first 5 down count after the ATH correct, it's quite chaotic up there and I see several ways to count it, and I'm not an advanced enough Elliotician to know all the rules, but I don't think it matters much on the larger scale.
5. Even though I hand drew that line just eyeballing it, I noticed that I have capitulations happening on July 4. Independence day in USA.
Curious.
Note: I'm no pro. I'm very new to Elliot wave principals. I am a creative professional and artist with visual pattern skills and intuition.

CAPITULATION IS YET TO COMEBTC is currently fighting it's way up and forming a rising channel.
I'm personally expecting a pop up within the next few days.
History loves to repeat itself.
That's why I expect the upcoming upwardsmomentum to be the final leg up, before we have capitulation taking place.
Notice how during March the exact same channel has been formed after price boomed to the upside.
We have a similar declining trendline forming right now (blue line) and it's very likely that BTC will break through, causing a further push to the upside.
BUT!
I do not expect this to be the trendreversal everybody's anticipating.
Capitulation is yet to come.
In case you've read my previews analysis, you might have noticed that I'm pretty confident about market cycles and that they always repeat themselves.
Capitulation is needed, if we want a new (bull) cycle to begin.
We haven't witnessed that yet.
You might wanna take notice that there COULD be a reason, why Wall Street professionals rely on market cycles ;)
Anyways..
In terms of BTC price behavior, you should observe the blue, declining trendline.
Once we break through, I'm personally aiming for a long position until we reach 8450-8600 level.
This is where I'm going to take short positions.
Chart explains why.
Also notice (AGAIN!) the similarities between now and 2014:
It should be obvious to you what's happening right now.
This does not exclude that I'm wrong.
I could be.
As a trader, you want the probabilities to be in your favour.
Right now, the probabilities are pointing towards capitulation.
I'm going to change my strategy, if the probabilities point towards a new bull run, which is not the case right now.
Wish you guys happy trading, I'm going to keep you updated.
Regards
Shaheen

DON'T BE FOOLED AGAIN....To be straight forward honest with you, I did not expect BTC to reach 7k before the major leg down.
But there are two important things I'd like to talk about.
1. Notice how on the log scale we didn't even break through March's downtrend.
Remembers me of the time when BTC broke through December's resistance on the auto scale, everybody was bullish and nothing happened.
BTC actually went down again.
Why?
Because this major resistance hasn't been broken on the log scale.
Same thing might happen here.
2. We got yet another rising wedge forming.
BTC formed a similar rising wedge at the beginning of April - remember how bullish everybody was?
The afore mentioned rising wedge was underlined by a (hidden) bearish divergence.
Well...guess what.
BTC is forming yet another rising wedge, with a hidden bearish divergence on the 1H Chart AND apparently on the daily chart.
If the wedge is confirmed by a high volume breakdown, expect 5.800$ to happen and consider shorting.
In case BTC manages to break through 7.250$, we might see 7.500$.
Wish you a nice sunday.
