Gold Chart 4H view Super BullishGold Chart 4H view Super Bullish. Parallel channel breakout and retest have been done, so here we can see a good bullish move for a long term journey.
Chartanalysis

Novo Nordisk: New Long-term Entry Area!Novo Nordisk's stock has continued to rally since our last update. We've taken a deeper dive into our count and have identified a blue long-term entry area.
The primary scenario suggests that the price is currently working through a turquoise upward structure, potentially leading up to the high of the major wave into the red short target zone between €70.63 and €84.59.
We've further segmented the subordinate turquoise wave 3 into a magenta structure, with wave expected to soon establish its low in the aforementioned blue entry area before moving higher.
This entry zone offers opportunities for long entries. We plan a long-term purchase for our investment portfolio and have shared exact coordinates with our Subscribers.
In the red target zone, NOV is likely to pivot downward from the top of the green wave to begin the final descent stage within the broader correction: The green wave aims to reach into the green target zone between €29.63 and €15.65 to complete the beige wave II.
A sustainable upward trend is expected to start following this. Hence, the green zone also offers opportunities for long entries. Additionally, there’s a slight 34% chance that prices might skip the rise to the red zone and dive straight into the green zone.

Nvidia: Downward PressureSince the end of last week, Nvidia has been facing increasing downward pressure. Our primary scenario, however, calls for a recovery and suggests that the stock should complete the green wave closer to but still below the resistance at $212.16. The subsequent wave should then finalize the larger correction of the beige wave IV above the support at $145.50. Afterward, we expect robust gains into our red Target Zone between $227.38 and $260.60, where the major uptrend of the lime-green wave is likely to conclude. Nonetheless, there's a 33% chance that NVDA already completed wave alt. at $212.16. In this case, the next move would dip below the $145.50 support.

BTCUSD Breakdown from Key Structure | Multi-Level Bearish SetupBitcoin is currently trading below an important structure level on the 30-minute timeframe, indicating growing bearish pressure.
After multiple failed attempts to hold above the key zone, price broke down and entered a consolidation range, which often acts as a continuation phase in trending markets.
Market Observations:
• Clear bearish structure shift
• Breakdown from previous support zone
• Consolidation below resistance
• Multiple lower targets aligned on downside
• Momentum still favoring sellers
This analysis is based on market structure, level interaction, and momentum behavior – not on indicators or lagging signals.
If you trade using structure, levels & confirmation logic , you’ll understand why tools like Chart Clues Prime focus on clean data instead of noisy indicators.
Always manage risk and trade with confirmation. This is not financial advice.

XAUUSD - Breakout Continues, Bullish Momentum Remains StrongGold prices have attracted fresh buying interest for a second consecutive session, reaching a new all-time high and currently trading around $4,710.
The key driver behind gold’s strength is the ongoing global geopolitical and trade uncertainty. Hawkish statements regarding U.S. tariffs and foreign policy, along with the risk of escalating tensions among major economies, have significantly boosted safe-haven demand. In this environment, gold continues to reaffirm its role as a store of value, drawing strong attention from investors worldwide.
Beyond political factors, investment flows into precious metals are clearly increasing. Global gold ETF holdings have risen steadily over recent weeks, signaling long-term market confidence. Notably, strong buying demand from Asia—especially China—is viewed as a major pillar supporting gold’s sustained upward momentum.
🔎 Key Economic Events to Watch This Week
Wednesday: U.S. President Donald Trump speaks at the WEF; U.S. Pending Home Sales
Thursday: U.S. Q3 GDP (final reading), PCE Price Index, Weekly Jobless Claims
Friday: U.S. S&P Preliminary Manufacturing and Services PMI

XAUUSD – 15M Chart AnalysisXAUUSD – 15M Chart Analysis
Educational purpose only
Current Price
XAUUSD ≈ 4,729
Market Structure
Price is in a strong bullish trend, making higher highs and higher lows.
Short-term EMAs (7, 9, 21) are above EMA 50, confirming bullish momentum.
After the recent rally, price is consolidating just below resistance, which is a healthy pause.
Resistance Zone
Resistance: 4,735 – 4,745
Breakout Scenario:
A clear 15M close above 4,745 would confirm continuation.
After breakout, upside extension toward 4,760 – 4,780 becomes possible.
Support Zones
Support (Pullback Zone): 4,720 – 4,725
Support 2 (S2): 4,700 – 4,705
Breakdown Scenario:
If price fails to break resistance and closes below 4,720, a deeper pullback toward 4,700 may occur.
Bullish structure remains valid as long as price stays above S2.
Summary
Above resistance → bullish continuation.
Below support → corrective move.
Trend remains bullish while supports hold.
For educational purposes only.

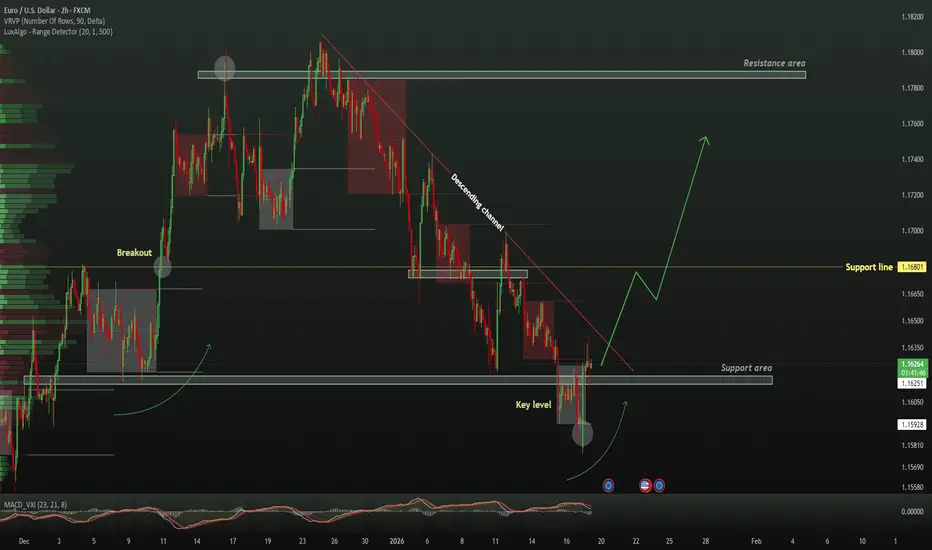
TheGrove | EURUSD Buy | Idea Trading AnalysisEURUSD is falling towards a support level which is a pullback support and could bounce from this level to our take profit.
We expect a decline in the channel after testing the current level which suggests that the price will continue to rise
Hello Traders, here is the full analysis.
I think we can soon see more fall from this range! GOOD LUCK! Great BUY opportunity EURUSD
I still did my best and this is the most likely count for me at the moment.
-------------------
Traders, if you liked this idea or if you have your own opinion about it, write in the comments. I will be glad 🤝
Amazon: Momentum ShiftIn the first weeks of the year, Amazon's stock continued its upward trajectory. However, this upward momentum came to a halt last Tuesday. Since then, the bears have taken charge and thus align more closely with our primary scenario, which calls for the current downtrend to persist, with the low of the beige wave IV forming just above the support at $160.50. Afterward, we anticipate an upward movement in the same-colored wave V, which should eventually lead to the peak of the larger blue wave (V). Our alternative scenario, however, suggests that the stock could directly break through the resistance at $259. In this case, we would consider the low of the beige wave alt.IV as already established (probability: 33%).

ETH: Pullback Sets Up New Buying OpportunitiesEthereum has also experienced another downward move in recent hours. For now, there remains a 40% probability that the recent rally could continue above resistance at $3,656 before a sell-off into the green Target Zone between $2,228 and $1,789 occurs. However, under our primary scenario, the price is expected to stay below $3,656, break through support at $2,620, and move directly into the Target Zone. From that point, we anticipate in both scenarios a substantial (though corrective) rally into the red Target Zone (coordinates: $5,805–$7,326).

XAUUSD (Gold) – 1H Chart AnalysisXAUUSD (Gold) – 1H Chart Analysis
Educational purpose only
📌 Current Price
XAUUSD ≈ 4,663
📈 Market Structure
Price made a strong bullish impulse and is now consolidating.
Structure shows a bullish bias above Support 1, but price is still below resistance.
EMAs (9 & 21) are above EMA 50, supporting the bullish structure as long as support holds.
A rising trendline is guiding price higher → key bullish target area.
🟢 Resistance Zone
Resistance: 4,675 – 4,685
🔼 Bullish Scenario
A strong 1H close above 4,685 confirms breakout.
Bullish target: Trendline zone around 4,710 – 4,730
Momentum continuation expected if price holds above broken resistance.
🔴 Support Levels
Support 1 (S1): 4,645 – 4,655
Support 2 (S2): 4,575 – 4,585
🔽 Bearish Scenario
If price breaks and closes below Support 1 (4,645):
Bullish structure weakens
Bearish target: Support 2 at 4,575 – 4,585
🔍 Simple Summary
Above resistance → bullish continuation toward trendline
Below Support 1 → bearish move toward Support 2
Market is at a decision zone, wait for clear breakout confirmation

BTCUSD – 15M Chart AnalysisBTCUSD – 15M Chart Analysis
Educational purpose only
Current Price
BTCUSD ≈ 93,160
Market Structure
After a sharp sell-off, price is forming a short-term recovery structure.
Price is trading below the higher-timeframe EMA 50, showing overall pressure.
Short-term EMAs are curling up, indicating minor bullish momentum, but still within a range.
Market is at a decision zone between short-term resistance and support.
Resistance Level
Short-term Resistance: 93,250 – 93,350
Bullish Scenario:
A clean 15M close above 93,350 confirms a breakout.
Bullish target: Downward trendline / EMA50 zone around 94,300 – 94,600.
Support Levels
Support 1: 92,900 – 93,000
Support 2 (Main Support): 92,200 – 92,350
Bearish Scenario:
If price breaks and closes below Support 1, bearish continuation may follow.
Bearish target: Support 2 at 92,200 – 92,350.
Simple Summary
Above resistance → move toward trendline resistance.
Below Support 1 → move toward main support.
Wait for breakout confirmation, as price is still range-bound.
For educational purposes only.

Shopify: Bearish EffortsShopify has recently continued its bearish efforts but only managed to establish a slightly lower low. In our primary scenario, we ascribe more downside potential to the regular turquoise wave B, which should, however, culminate above the support at $88.16. In the subsequent wave C, we anticipate rises above the resistance at $182.18, towards the high of the larger magenta wave (Z). Meanwhile, there's a 30% probability that SHOP may directly exceed the $182.18 level, confirming an already completed wave alt.B .

SILVER current Supporting Region, holds or not??#SILVER.. everybody concerns about silver price and here is current areas , region with expected move.
now market have current supporting region around 89.50 to 90.50
you know according to market volatility we should consider 80 to 120 pips for making a region or area either support or resistance.
so guys keep close that supporting region because next move will start above that..
NOTE: we will only change our buying mind set below 89.50 not before and there will be our cut n reverse area on confirmation.
good luck trade wisely

CrowdStrike undecidedCRWD seems rather undecided whether to follow through with ist corrective path or whether to make new highs. However, we still assign only a 36% probability that the high for wave alt. in green may already be in place; this alternative scenario would be confirmed by a drop below the support level at $402.66.
For now, though, our primary outlook allows for further upside, with the potential for green wave to complete above the resistance at $517.98—and possibly above the current all-time high of $566.90.
Regardless of which scenario unfolds, a move down to the green target zone (ranging from $114.02 to $33.73) appears likely—either sooner (in the alternative scenario) or later (in the primary scenario)—to complete the larger wave II correction.
Once this significant low is established, we expect the stock to move toward new record highs as part of a beige wave III to follow.

Gold Price Behavior H1Broken above a key resistance zone (where price struggled before),
Now using that zone as support,
Showing signs of a bullish continuation pattern.
📈 Key Levels on the Chart
🟥 1. Support Zone (just below current price)
This red dashed area around ~4,630–4,620 was previously resistance. Now that price is above it:
✔ It acts as a support level
✔ A pullback to this area could be a buying opportunity
This zone is reinforced by short-term EMAs (7, 9, 21) all stacking bullishly, meaning buyers are still in control.
🟦 2. Next Support (S2)
The lower red shaded box labeled S2 (~4,580 area) is a deeper support:
If price loses the first support zone,
Then this next region around ~4,580–4,590 becomes a strong support base,
Likely to attract buyers again.
This aligns roughly with the 50-period EMA, often seen as a medium-term trend support.
📊 Moving Averages
You’ve plotted:
EMA 7 (fast)
EMA 9
EMA 21
EMA 50
They are all sloping upward, which tells us:
➡ Trend is bullish on the hourly
➡ Shorter EMAs are above longer ones — confirming strength
📌 Price Behavior
Right now:
The candles are above support and above EMAs
The market looks in a consolidation phase after the breakout
This suggests smart money may be accumulating before another leg up
🟢 Bullish Scenario
If price continues to hold above the support zone:
Expect a push toward recent highs or beyond
Possible targets: 4,650+ and then higher depending on momentum
The green arrow on your chart reflects this idea.
🔴 Bearish Scenario
If price breaks below the support zone (~4,620):
Drop toward S2 (~4,580)
If that fails, momentum could shift short-term bearish
The red arrow on your chart shows this path.
🧠 What This Means (Summary)
Bullish bias:
✔ Price broke out and is now retesting support
✔ EMAs support upward momentum
✔ Buyers still in control
Watch for:
Support hold near ~4,620 → Bulls likely continue
Break below ~4,620 → Next level ~4,580 (S2)
📍 Simple Trading Signals
Long (Bullish) Setup
Entry: Bounce off support (~4,620)
Stop-loss: Below support (~4,610)
Target: Next highs (~4,650+)
Short (Bearish) Setup
Entry: Close below support (~4,620)
Stop-loss: Above recent consolidation highs
Target: Next support (~4,580 or lower)

ETHUSD – 4H Chart AnalysisETHUSD – 4H Chart Analysis
Ethereum is currently range-bound after a corrective move, trading between clearly defined support and resistance zones.
Key Levels
Current price: ~3112
Support zone: 3050 – 3070
Resistance zone: 3160 – 3180
Higher resistance (R2): 3280 – 3300
Chart Insight
Price is holding above the major support zone, showing buyers defending this area.
Recent candles show rejection near resistance, indicating supply pressure around 3160+.
EMAs are flattening, suggesting consolidation before the next move.
Breakout Setup (Educational)
Bullish scenario:
A strong close above 3180 may open the path toward 3250 – 3300.
Bearish scenario:
Failure to hold 3050 could expose downside toward 3000 – 2950.
Summary
Bias remains neutral inside the range.
Directional clarity expected on a confirmed breakout or breakdown.
Technical analysis only, not financial advice.

Caterpillar: New Upward MomentumOver the past two weeks, Caterpillar's stock has climbed steadily, recording gains of around 15%. We anticipate further increases into our red Short Target Zone between $687.01 and $727.83, where we identify the peak of the overarching blue wave (I). Once this top is reached, a more significant correction may begin. However, if CAT breached the support at $537.08 before reaching our Target Zone, it's likely that the magenta wave alt.(4) will forge a deeper low (probability: 31%).

Palantir: Air is getting thin NASDAQ:PLTR recently reached our designated red short Target Zone, triggering an active short trade. We have been managing risk proactively, reducing the position by 50% after hitting the initial take-profit level. As a result, our stop-loss is now set at the entry price. As the weekly chart indicates, the stock is primarily in a major corrective phase, identified as wave II in beige. This correction is expected to continue, first pausing in the upper green Target Zone ($117.54–$95.10) before potentially extending down to the lower green Target Zone between $72.58 and $40.66. Alternatively, there is at least a 33% chance that the stock could first post a new high for wave alt.I in beige, above resistance at $207.23.

Walmart: New Impulse!After a period of indecision, Walmart's stock has recently gained new upward momentum. It's once again heading towards our red Short Target Zone ($127.46 - $134.37), where the green wave is expected to conclude. In the primary scenario, we anticipate a subsequent break of the support at $97.90 and a decline into our green long Target Zone between $80.90 and $69.60. Alternatively, the high of the green wave alt. might have already been set. A direct sell-off below the mentioned support would then lead the stock into our green Long Target Zone earlier (probability: 34%).

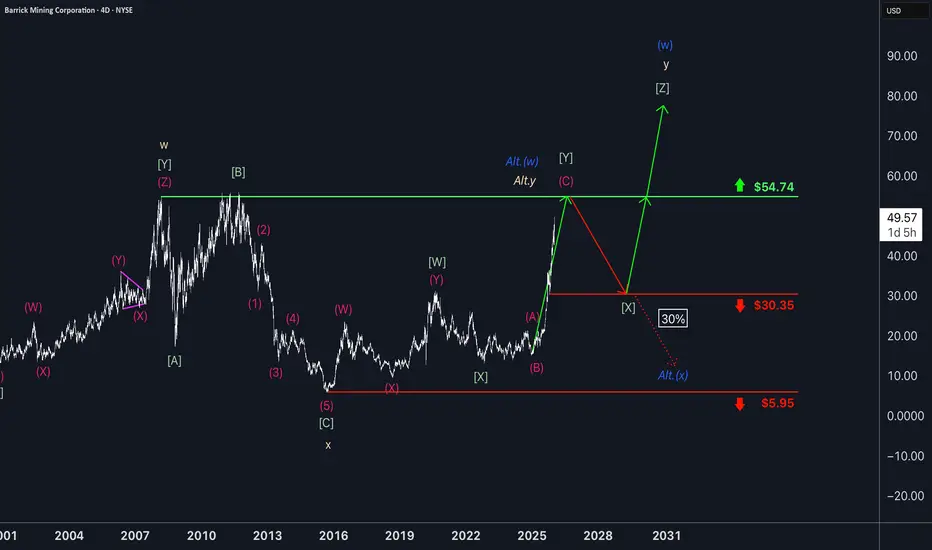
Barrick Gold slowly advancingWithin the ongoing three-wave pattern, the magenta wave (C) is expected to give the miner another boost, ultimately completing the green wave just below the resistance at $54.74. The following wave should then pull the stock back toward support at $30.35, from which wave is likely to start again. This move should once again lift Barrick higher, with the blue wave (w) projected to finish well above the $54.74 level. There is, however, a 30% chance that wave Alt.(w) could wrap up imminently. In that scenario, wave Alt.(x) would push price directly below $30.35, but would still bottom out before reaching the support at $5.95.
XAUUSD Bullish Structure – BUY Setup Toward 4530 & 4560Price has broken above the trendline and is holding above the support zone at 4,485–4,495, where former resistance has now turned into support. As long as price stays above this support area and respects the rising trendline, bullish momentum is likely to continue. The first target is 4530, and if strength sustains, price can extend toward the main target zone at 4,550–4,560. A clear break back below 4,485–4,495 support would invalidate the bullish setup.

XAUUSD – 30m Chart Analysis**XAUUSD – 30m Chart Analysis & Idea**
Gold remains in a **short-term bullish structure**, trading above key EMAs and holding an **ascending trendline**.
**Key Levels**
* **Current price:** ~**4584**
* **Support zone:** **4555 – 4565** (EMA cluster & previous consolidation)
* **Resistance zone:** **4595 – 4605**
**Price Action Insight**
* Price is consolidating after a strong impulsive move up.
* Higher lows are forming, showing buyers are still active.
* As long as price holds **above the support zone and trendline**, upside pressure remains intact.
**Idea (Educational)**
* Bullish continuation favored **above 4560**.
* A sustained break and hold **above 4600** may open the way toward **4620–4640**.
* Failure to hold support could lead to a pullback toward **4525–4500** area.
*Technical analysis only, not financial advice.*

BlackRock: Up and Down AgainBlackRock has recently formed the low of the turquoise wave X and subsequently moved into a sideways phase, from which it temporarily broke out impulsively upward. However, selling pressure soon returned. Overall, the stock remains in a consolidation phase. In the short term, we expect increased upward momentum to develop the high of the overarching wave (2) in magenta. We anticipate that this peak will remain below the resistance at $1219. Thereafter, more sustained selling pressure is expected to gradually push the stock below the support at $760.01, marking the low of beige wave IV. Should the low of the magenta wave alt.(X) have formed in November, the current movement could be attributed to wave alt.(Z). In this scenario, an increase above the resistance at $1219 should be considered, which would simultaneously allow the overarching green wave alt. to reach a new high (probability: 35%).
