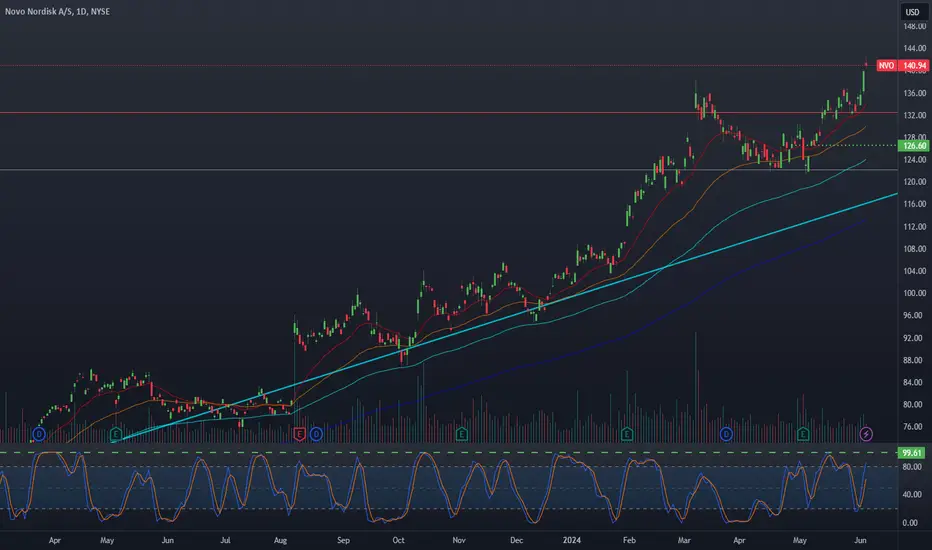
Novo Showing Bullish SignsHello everyone, happy Sunday. Today I am presenting my "cup and handle" bullish pattern on $NYSE:NVO. From a technical perspective, the stock has shown a typical cup pattern with resistance, and I expect a handle to soon form before a bullish continuation upwards. Currently in with 75 shares around
Key facts today
Next report date
—
Report period
—
EPS estimate
—
Revenue estimate
—
2.66EUR
11.22 BEUR
31.15 BEUR
3.14 B
About NOVO NORDISK B A/S
Sector
CEO
Lars Fruergaard Jørgensen
Headquarters
Bagsværd
Website
Employees (FY)
63.37 K
Founded
1931
ISIN
DK0062498333
FIGI
BBG000DYN996
Novo Nordisk A/S is a global healthcare company, which engages in the discovery, development, manufacturing and marketing of pharmaceutical products. It operates through the Diabetes and Obesity Care, and Rare Disease segments. The Diabetes and Obesity Care segment includes diabetes, obesity, cardiovascular, and emerging therapy areas. The Rare Disease segment refers to rare blood disorders, rare endocrine disorders, and hormone replacement therapy. The company was founded by Harald Pedersen and Thorvald Pedersen in 1923 is headquartered in Bagsværd, Denmark.

$NVO Become a New Watch List?!NYSE:NVO is a new watchlist since it keeps forming a very good bullish structure.
Let's see where it goes.

Novo Nordisk's Wegovy Secures China Approval, Poised for Major MDanish pharmaceutical giant Novo Nordisk gains significant access with the approval of its weight-loss drug Wegovy in China. This move grants Novo Nordisk entry into the world's second-largest economy, targeting a growing population facing obesity challenges.
Key Considerations:
Wegovy target

Update on NVO swingI charted my entry on the dotted green, I did go with calls for June 21st, I am debating closing them now before theta decay starts to really ramp up, but I still think we might hit 144-145$ in a few days the way this is going. The stochastic RSI still has room to run a few more days and the stock l
NVO: Super-Duper-To-GoFundamentals:
An insulin and diabetes drug care company based in Denmark. Booming fundamentals, booming funds, great cashflow, stable earnings and accelerating sales. Pays a little dividend.
Technicals:
Shallow pb
uHd
extreme indicator
34%-50% pb
a-b-c pb completion
horizonal support
kijun bounc

Novo Nordisk Stock Slipped 3.3% ThursdayNovo Nordisk ( NYSE:NVO ) stands as a beacon of innovation, continually pushing boundaries in the treatment of diabetes and obesity. However, despite its recent successes, the company finds itself navigating the delicate balance between bullish growth projections and meeting market expectations.
Th

BUY Novo NordiskHello everybody
I think NVO is long in long time It is your responsibility to check and tade with yourself This analysis has an educational aspect .
Dont go into details and short timeframe
Trade with your little money and Invest with your big money
Good Luck

NOVO NORDISK: 2 ways, statistically one is more probable We can keep climbing if the price will go back to the top before 14th may, otherwise...

Novo Nordisk A/S (NVO) as of 7th March 2024.Novo Nordisk A/S (NVO) has exhibited a robust upward trajectory over the preceding quarter, as indicated by the persistent development within the bullish Ichimoku Cloud. A closer inspection of the technical facets as of March 7th, 2024, suggests a consolidation phase nearing culmination, with potent

NOVO NORDISK on the 1D MA50 starts looking a buy again.Novo Nordisk (NVO) hit the 1D MA50 (blue trend-line) again for the first time since December 18 2023 and after a long time it gives buy signals again. The correction came after the March 07 rejected at the top of the (dotted) Channel Up, following overbought 1D RSI levels before that for 2 weeks.
T

See all ideas
An aggregate view of professional's ratings.
Trade directly on the supercharts through our supported, fully-verified and user-reviewed brokers.


Curated watchlists where NOV is featured.


Frequently Asked Questions
The current price of NOV is 117.32 EUR — it has decreased by 1.54% in the past 24 hours. Watch NOVO NORDISK A/S stock price performance more closely on the chart.
Depending on the exchange, the stock ticker may vary. For instance, on XETR exchange NOVO NORDISK A/S stocks are traded under the ticker NOV.
NOV stock has fallen by 2.48% compared to the previous week, the month change is a 14.43% fall, over the last year NOVO NORDISK A/S has showed a 63.35% increase.
We've gathered analysts' opinions on NOVO NORDISK A/S future price: according to them, NOV price has a max estimate of 160.66 EUR and a min estimate of 74.97 EUR. Watch NOV chart and read a more detailed NOVO NORDISK A/S stock forecast: see what analysts think of NOVO NORDISK A/S and suggest that you do with its stocks.
NOV stock is 2.90% volatile and has beta coefficient of 1.48. Track NOVO NORDISK A/S stock price on the chart and check out the list of the most volatile stocks — is NOVO NORDISK A/S there?
Today NOVO NORDISK A/S has the market capitalization of 519.87 B, it has increased by 0.38% over the last week.
Yes, you can track NOVO NORDISK A/S financials in yearly and quarterly reports right on TradingView.
NOVO NORDISK A/S is going to release the next earnings report on Aug 7, 2024. Keep track of upcoming events with our Earnings Calendar.
NOV earnings for the last quarter are 0.76 EUR per share, whereas the estimation was 0.70 EUR resulting in a 8.72% surprise. The estimated earnings for the next quarter are 0.67 EUR per share. See more details about NOVO NORDISK A/S earnings.
NOVO NORDISK A/S revenue for the last quarter amounts to 8.74 B EUR, despite the estimated figure of 8.48 B EUR. In the next quarter, revenue is expected to reach 9.19 B EUR.
NOV net income for the last quarter is 3.40 B EUR, while the quarter before that showed 2.95 B EUR of net income which accounts for 15.36% change. Track more NOVO NORDISK A/S financial stats to get the full picture.
NOVO NORDISK A/S dividend yield was 1.35% in 2023, and payout ratio reached 50.35%. The year before the numbers were 1.32% and 50.59% correspondingly. See high-dividend stocks and find more opportunities for your portfolio.
As of Jul 27, 2024, the company has 63.37 K employees. See our rating of the largest employees — is NOVO NORDISK A/S on this list?
EBITDA measures a company's operating performance, its growth signifies an improvement in the efficiency of a company. NOVO NORDISK A/S EBITDA is 16.12 B EUR, and current EBITDA margin is 47.96%. See more stats in NOVO NORDISK A/S financial statements.
Like other stocks, NOV shares are traded on stock exchanges, e.g. Nasdaq, Nyse, Euronext, and the easiest way to buy them is through an online stock broker. To do this, you need to open an account and follow a broker's procedures, then start trading. You can trade NOVO NORDISK A/S stock right from TradingView charts — choose your broker and connect to your account.
Investing in stocks requires a comprehensive research: you should carefully study all the available data, e.g. company's financials, related news, and its technical analysis. So NOVO NORDISK A/S technincal analysis shows the sell today, and its 1 week rating is neutral. Since market conditions are prone to changes, it's worth looking a bit further into the future — according to the 1 month rating NOVO NORDISK A/S stock shows the buy signal. See more of NOVO NORDISK A/S technicals for a more comprehensive analysis.
If you're still not sure, try looking for inspiration in our curated watchlists.
If you're still not sure, try looking for inspiration in our curated watchlists.