PLTR CAUTION!PLTR is at a key critical area, which has already given a warning shot to bulls.
We have a complete rising wedge structure with 3 waves up and a hook that has already cracked! Within it, we also have a head and shoulders at the top, which is bearish. (H&S not a top is usually a continuation pattern.) AS is always the case, if the overall market is not ready to head south, it will fail as a full-on reversal pattern.
I urge CAUTION!! to PLTR bulls.
For shorts, you need to see a crack, gap fill, plus follow through for a new lower low in a small time frame. You can't have a reversal without lower lows and lower highs.
Thank you ALL FOR getting me up to 5,000 followers!! ))
Click boost, follow, comment nicely for more authentic, no BS, raw analysis. Let's get to 6,000 followers. ))
Chartinganalysis

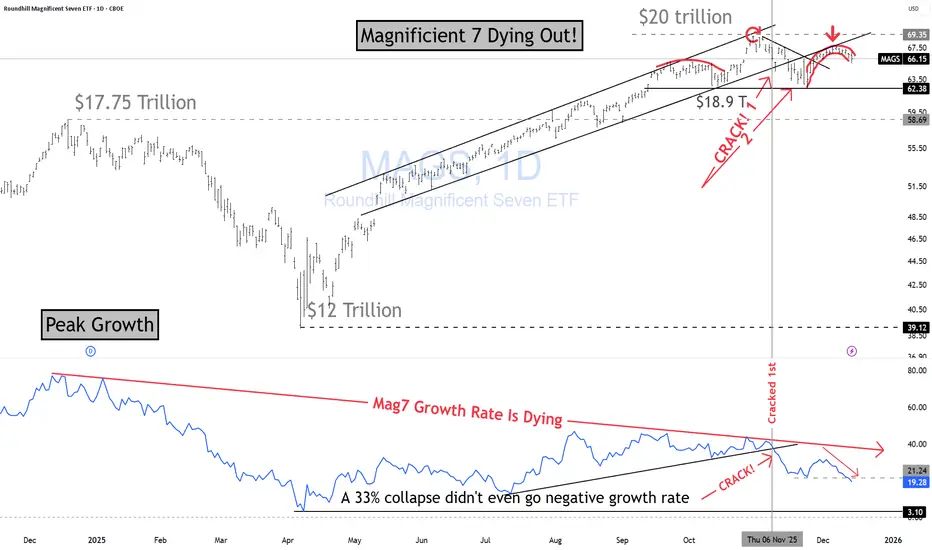
MAG7 Are Dying!Magnificent Seven Are Dying!
Here is why using my BKC method.
$20T in market cap. at $69.35
$18.9T Recent low
$17.7T Prior peak (Dec 24th)
$12T "Liberation Day" LOL! low (Apr 2025)
Growth Rate (Lower Panel)
• Growth rate peaked in Dec 2024 at ~85%.
• Since then, it has steadily deteriorated.
• Hit an all-time low of 3.1% around Liberation Day — even after a 33% drawdown, the rate never went negative! Imagine that! Where will price go when does go negative?
This is classic topping behavior: price making higher highs while growth momentum dies.
Price Structure (Upper Panel)
The Mag7 have been trading in a rising channel while the growth rate trends lower — a divergence setup.
Key structural points:
Head & Shoulders clearly formed at the top of the channel.
Red arrow circle marks the subtle but important failure: price couldn’t even touch the upper boundary of the channel → early weakness signal.
Crack #1: before the major breakdown.
Crack #2: Fri, Nov 7, 2025, confirmed again on Nov 13, 2025.
After that, price has been trading below the rising channel, confirming a structural shift.
Developing boomerang rejection: price returns to the channel underside and gets denied — classic failed-retest behavior.
Growth Rate Confirmation (Lower Panel)
The growth-rate panel confirms the sequence:
• The growth-rate crack showed up before the second price crack → momentum broke first, price followed.
This entire structure points to weakening upside momentum, failed retests, and a maturing top.
If you're still holding these names, ask yourself one thing:
What exactly are you waiting for?
• A 100% gain? That would require a $40T market cap.
• A 50% gain? That’s a $30T market cap.
Be honest with yourself: is that risk/reward realistic?
If you’re going to stay in this game, do it the right way.
Learn how to read a chart properly.
My goal is simple — to help you get better, think clearly, and avoid avoidable damage.
If you can’t see the massive head & shoulders, the major divergence, and the broken uptrend… I don’t know what to tell you.
All I can do is spark your curiosity and push you to do your own analysis.
THANK YOU for getting me to 5,000 followers! 🙏🔥
Let’s keep climbing.
If you enjoy the work:
👉 Drop a solid comment
Let’s push it to 6,000 and keep building a community grounded in truth, not hype.
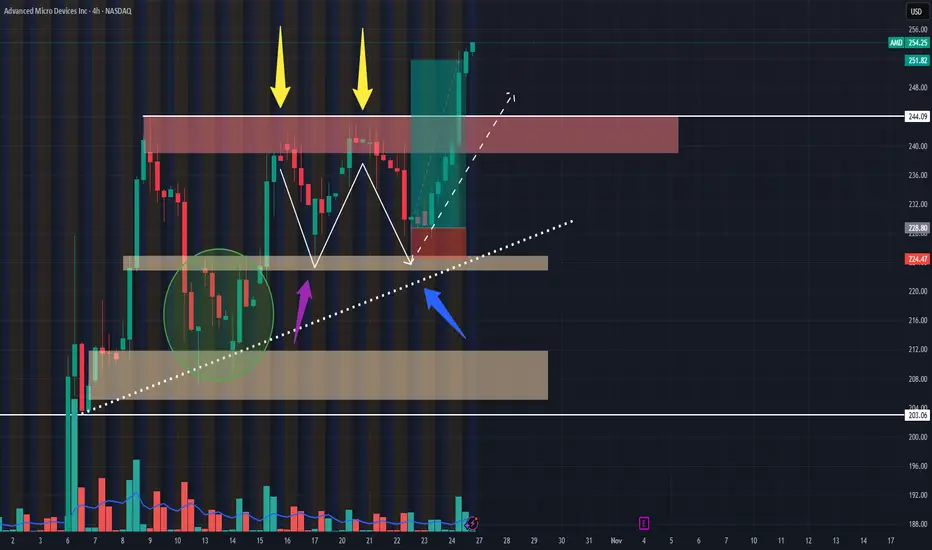
AMD Went Crazy!!! Post Trade Analysis 10/25/24Hello all,
This is my first time posting on here. So, please feel free to leave any questions, advice, or anything else in the comments!
I took this AMD swing trade on the 10/22/25 @ 2:12ish PM CST.
POSITION:
1 $300 Strike Call Exp Nov 7th 2025
Risk: $30 (price takes out low of hammer candle)
Initial PT: Previous highs (Red box) for $75 profit
Final PT: Actively managed since price moved past previous highs ($144 final profit)
WHY I TOOK THE TRADE
1. From the 7th-23rd AMD looked to be forming an ascending triangle pattern on the 1 day and 4HR timeframe.
2. AMD validated 2 support areas to me, which was an ascending support line (Blue arrow) and a demand zone from $222.92 to $225.11 (Purple arrow). In addition to this, price recently broke out from a W pattern (Green bubble) around 10/14 on the 1-4HR time frame (wish I saw it forming sooner lol), which confirmed to me that there was still momentum for the upside.
3. I saw that AMD was potentially forming another larger W pattern on the 1-4HR timeframes (Yellow arrows).
ENTRY Rules:
1. Measure Risk to Reward position, if less than 1.8 to 2.5 R/R, don't take the trade.
2. Wait for price to pull back to area of value (confirmed by multiple touch points.
3. Wait for a strong bullish candle to close 60% or above previous bearish candle (at the demand zone level), to confirm potential price reversal; then enter on the open of the very next candle.
4. Place SL where price invalidates analysis (below bullish hammer candle and demand zone), and PT at most recent highs (or actively manage if price pushes to the upside with momentum).
SUMMARY:
I am glad I took this trade, because it I am still relatively new to trading and I am improving on following my trade plan and TA more.
If anyone has any comments or feedback I would love to chat!
Thank you!
BTC/USD Price Action - Bullish Through Congestion... *Fib Retrace & Extension based off: Low point $66,784 (Nov 4th), High point $108,389 (Dec 17th), Pulled back to $91,271 (Dec 30th). I'll maintain this range until price breaks above or below*
Looks like BTC got bought up when it skimmed the top of what I have as a Demand Zone...
The Horizontal Volume Bars show BTC fought its way through peak volume shelves + POC (Vol Point of Control) indicated with the thick Yellow Line, while breaking through a downtrend resistance line forming from ATH, to last couple of days... We have a nice strong daily candle today (Jan 6th), and we want to see it close above the 100K mark. This IMO will prepare us to battle up through prior ATH, and onto the next Fib extension levels included on the far right of the chart.
Feeling Bullish, as the price action looks to be forming a Bullflag breakout on Weekly timeframe...
If I were trading, I'd look to lock profits on longs, just below prior ATH, unless it's a Bullish Engulfing candle-type day, where I'd let the trade run up, with a Trailing Stop Limit order to close out the trade...
Thoughts & Questions welcome.
Happy Hunting!

Cup & Handle Pattern TutorialA cup and handle pattern is a bullish continuation pattern that signals a potential upward price movement after a consolidation period. Here's a breakdown of its key components:
Cup: The pattern starts with a downward move in price, forming a rounded bottom (the "cup"). The price then rallies back up to the level where it began, creating a U-shape.
Handle: After the cup forms, the price pulls back downward in a smaller, rounded formation (the "handle"). This handle is typically a consolidation period before the price resumes its upward trend.
Win Rate
The cup and handle pattern is known for its high reliability and success rate. Research shows that it has a 95% success rate in bull markets and an average profit of around 54%. However, it's important to follow strict trading rules to achieve these results

Uptrend & Downtrend Bullish Falling Wedge Pattern TutorialA bullish falling wedge is a charting pattern that signals a potential reversal from a downtrend to an uptrend. Here's a breakdown of its key characteristics:
Shape: The pattern forms a wedge that slopes downward, with the upper trendline connecting the highs and the lower trendline connecting the lows. The key is that the highs and lows get closer together as the pattern develops.
Trend: It typically forms during a downtrend, indicating that selling pressure is decreasing.
Breakout: The pattern is bullish when the price breaks above the upper trendline. This breakout suggests that the downward trend is losing momentum, and an upward trend may follow.
Volume: During the falling wedge formation, volume tends to decrease, which supports the idea that selling pressure is diminishing.
Retest: After the breakout, it's common for the price to retest the upper trendline, and if it holds, it provides further confirmation of the bullish reversal.
Example
Imagine a stock that has been falling for several months. The price forms lower highs and lower lows, creating a narrowing wedge. Suddenly, the price breaks above the upper trendline with increased volume, signaling a potential reversal and the start of an upward trend.

Symmetrical Triangle Pattern what is it/ how to draw it? 2/8Symmetrical Triangle Pattern what is it/ how to draw it? 2/8 Bullish Charting Patterns
A symmetrical triangle is a chart pattern that forms when the price of an asset converges with two trendlines that are moving towards each other, creating a triangular shape. Here’s how it works:
Converging Trendlines: The upper trendline is formed by connecting the descending highs, and the lower trendline is formed by connecting the ascending lows. These trendlines converge at a point called the apex.
Volume Decrease: As the pattern develops, trading volume typically decreases, indicating a period of consolidation and indecision in the market.
Breakout: Eventually, the price breaks out from the triangle, which can occur in either direction – upwards or downwards. The direction of the breakout often dictates the future trend of the asset.
Symmetrical triangles are considered continuation patterns, meaning they usually signal that the prevailing trend (upward or downward) before the pattern will continue after the breakout. Traders often use the height of the triangle (the distance between the initial high and low points) to estimate the potential price target following the breakout.
Like l Follow l Share
Stay tuned for the other 6 BULLISH CHARTING PATTERNS

NZD/CHF: PAT + VPA 11/03/2024Good morning,
On this date, March 11, 2024, I will be conducting an analysis of the NZD/CHF currency pair.
Daily (1D): The daily timeframe has exhibited a bearish trend, initiating a downward movement from May 28, 2024, to August 5, 2024. During this period, the price encountered support at 0.494, subsequently rallying to 0.536. It is important to highlight that 0.536 represents the last swing low that was breached on the weekly chart. The price faced significant resistance at approximately 0.536 and subsequently tested the daily swing low at 0.519. Following this, the price entered a consolidation phase between 0.519 and 0.526, which persisted for 16 days before breaking below the daily swing low of 0.519.
The weekly and monthly moving averages (7EMA & 21EMA on the daily timeframe) indicate a sustained bearish trend. Presently, the support level is situated at 0.494. I anticipate that the price will trend towards 0.494 in the coming weeks.
I will be actively seeking trading opportunities targeting 0.494.
ThePipAssassin

DOW FAKE BUY INTO ENGULF SELLWe're looking for the market to continue upwards before taking a turn into a 3-5 candle sell before potentially ranging into a swing trade.
Cap Detectors:
- Kareem
- Amilia
- Janelle
- Rita
- Rose
- Tatiana
- SA

NOW IS THE TIME TO BUY $TSLA STOCK! WE ARE STILL EARLY! NASDAQ:TSLA is ripping!
ℹ️ We haven't even crossed the zero line on the MACD Weekly, their is so much room to run on this name!
Short term 🎯$235
EOY 🎯$300
Today is 1000% a short squeeze day BTW! 🍋
NOT FINANCIAL ADVICE 🖖

Reversal Rising Wedge pattern in COLPALCOLGATE PALM (INDIA) LTD
Key highlights: 💡⚡
📈 On 1 Day Time Frame Stock Showing Reversal of Rising Wedge Pattern.
📈 It can give movement upto the Reversal Final target of Below 2030-.
📈 There have chances of breakdown of Resistance level too.
📈 After breakdown of Resistance level this stock can gives strong downside rally upto below 1900-.
📈 Can Go short in this stock by placing a stop loss Above 2200+.

Just look at this beautiful chart.
I see massive bullish potential. A lot of profit potential. A lot of open interest on some of the calls. It is looking like a reversal on the weekly and daily chart. Beautiful setup.

Gold is still Bullish.... !!! Target 2100Gold is still bullish on the higher time frame. You will start to see a bullish run to 2100. As you can see on the chart, gold a still making a higher highs in the 4hr time frame.
Please learn about chart patterns to see how to identify them and how they can help you in trading.
Good Luck.

aud/cad looking like its going to take a Fallhere in my analysis I've noticed on the Daily time Frame that we have a Complete Head and Shoulders Formation With A break to the downside and price action has retested that area and is now starting to reject the same area
The R/R isn't the greatest due to the rule of taking the Trade utilizing the head and shoulder pattern as additional confirmation for this set up
Disclaimer: past profits don't guarantee a future result
trading is risky and can result in 100% loss of trading balance
information shared is for educational and demo purposes only!!

HYMC heading for a breakout? 7/12/2022HYMC seems to have changed its trend. You will see that we have entered with higher lows and higher highs. This could signal a breakout above 1.10 testing its next resistance level at 1.19. If the momentum continues then I would say that we could break out of the 200 DMA. However, there is A LOT of resistance at the 1.19 level.
The MACD just crossed over and I am getting signals on the 3, 13 EMA Cross. The volume also seems to be steadily increasing with today being one of the better days for volume.

RBLX the Next 30 DaysI am new to this, but I really enjoy it and would love any feedback. This is not financial advice.
This analysis is based on the Elliott Wave Theory. I think you will see one more major move up before watching it fall to the ground like a dead cat. This is based on the 5-3 theory and considering that this is a psychological play more than a fundamental play it would make sense to have one more major continuation before she falls through the floor.

AVAX SHORT SET UP IDEA. 08/05/2022 Using leading indicators to predict the next leg of the trend direction.
Using Elliot Wave, Fibonacci Extension, Structural Areas of the Trend Direction and HTF Daily 9EMA value on the 6H chart.

BTC Perpetual Futures 24hr video One - Learning the SystemI finally got a camera and mic installed on my computer and i can do the recording. I am going to my best to explain my thought process. This, for me is an exciting new approach as it forces me to be coherent to a broader spectrum of mindsets. Yes i know all of you negative and trolly types have no idea what is going on, think i am trying to be a Guru, or sell something etc. But as i have continued to state, I am an artist, i started doing these charts after studying the use of geometry in predictive projections of reality. Most notable the reflections of this are found in the masterworks of arts that last through time. Its never the matter its made of, it is always the geometry. So this is video one, i am streaming my consciousness, i think, because the pattern recognition area of my brain is busy mapping geometric expressions. i have not done that before but i expect my mind will build a more correlated pattern of inspired information along the way. So enjoy. I did Going to make more on this same chart so you can see the whole process. If anyone out there ever comes up with a code or algorithm that can do this automatically that would be cool.
As it stands now i appear to be the only person in the entire world doing this. That's kinda cool. Even cooler if you, reading this, are also seeing these patterns. Let me know. It is definitely specific mind that i hope to find out there. One who might enjoy organizing grains of sand into patterns before the next gust of wind.

The Polygon Point money verse mantraThis is the reflection of this massive point of consensus, building up in the marketplace. It's pretty cool and reflects some nice development of the digital organism. Through time, their values should strengthen when patterns form. Patterns are heuristics for Traders. I think when AI is fully introduced that difficulty will disappear. What will remain, as long as humans are involved, is manipulation. I feel like we are watching two giants fighting. The natural flow versus maipulaiton.


ETHUSD Chart PredictionHey folks, making my first public post today. Been watching ETHUSD for a while and decided to share my checklist for ETH's next big breakout. Hope you find some value here and I'm totally open to constructive criticism and feedback. Thanks, Stefan

Lukso Potential moves over the next 1-2 weeksLukso Potential moves over the next 1-2 weeks, will be breaking them down in my upcoming youtube video and what to do in each scenario!
scenario 1 is a straight forward trend within the drawn lines
scenario 2 we see a pull back into a teacup and handle (to the moon after)
scenario 3 we slide into a double bottom and see another large accumulation stage

New Trader: Charting patternsWhat do you see? I see a Rising wedge, and descending triangle on 4h. I also see a triple top and head and shoulder.
