Bitcoin Futures H4: Bullish Trendline Rebound Toward $103KBased on my analysis of Bitcoin futures on the 4-hour timeframe, the market remains in a clear bullish trend. Price has recently rebounded from the ascending trendline, reinforcing bullish momentum. As long as this structure holds, there is a high probability that Bitcoin could continue its upward move toward the $103,000 area in the coming days.
Chart Patterns

BTR Price Action Indicator –Trade on NIFTY 50 600 POINTS DONE🔥 BTR Price Action Indicator – First Ever Trade on NIFTY 50 (1H) | 600 POINTS DONE 🔥
For the first time, we applied the BTR Price Action Indicator on the NIFTY 50 Index (Hourly timeframe) — and the result was nothing short of PERFECT. 🎯
📉 BTR Generated Short Signal at 26,170
The market respected pure price action, and BTR guided the trade step-by-step with precision.
✅ Trade Breakdown (Premium Setup):
Entry: 26,170 (BTR Short Signal)
Target 1: +200 points ✔️
Target 2: +400 points ✔️
Target 3: +600 points ✔️
Final Exit: 25,570
📊 Total Gain: 600 POINTS in a single directional move
💎 No guesswork. No overtrading. Only clean price action.
🔥 BTR Price Action Indicator – First Ever Trade on NIFTY 50 (1H) | 600 POINTS DONE 🔥
For the first time, we applied the BTR Price Action Indicator on the NIFTY 50 Index (Hourly timeframe) — and the result was nothing short of PERFECT. 🎯
📉 BTR Generated Short Signal at 26,170
The market respected pure price action, and BTR guided the trade step-by-step with precision.
✅ Trade Breakdown (Premium Setup):
Entry: 26,170 (BTR Short Signal)
Target 1: +200 points ✔️
Target 2: +400 points ✔️
Target 3: +600 points ✔️
Final Exit: 25,570
📊 Total Gain: 600 POINTS in a single directional move
💎 No guesswork. No overtrading. Only clean price action.
⚠️ Educational purpose only. Trade with proper risk management.
BTR – Let Price Action Do the Talking. 📈 NSE:NIFTY

Gold will rise again after a correction!
On Tuesday (January 13th), gold fluctuated at a high level, currently trading around $4580. Gold prices rose nearly 2% on Monday, closing at $4597.21 per ounce, and briefly touching a peak of $4630.08 during the trading session. From the sudden development of the criminal investigation into Powell, to a weaker dollar and inflation expectations, and the continued escalation of global geopolitical tensions, these factors have collectively created a golden age for gold. In the turbulent global financial markets of early 2026, the price of gold surged like a runaway horse, breaking through the historical barrier of $4600 per ounce and setting a stunning new record. This surge in gold prices not only ignited investors' risk aversion but also revealed the deep market logic intertwined with geopolitical uncertainty and Federal Reserve policy volatility. Gold, as a traditional safe-haven asset, is in an unprecedented strong cycle, and the driving forces behind it are worth in-depth analysis.
The Trump administration's criminal investigation into Federal Reserve Chairman Powell became the core catalyst for this surge in gold prices. The U.S. Department of Justice threatened to file criminal charges against Powell for his congressional testimony regarding the $2.5 billion renovation project at the Federal Reserve's Washington headquarters. This news, like a bombshell, opened the door to market concerns about the independence of the Federal Reserve. In addition to the turmoil within the Federal Reserve, the continued escalation of global geopolitical risks also provided strong support for gold. The Federal Reserve's policy path is a key variable affecting gold prices. Although the Fed is expected to maintain interest rates unchanged at its January 27-28 meeting, the market still expects two more interest rate cuts later this year, which boosted demand for gold. During periods of high geopolitical risk, gold's historical role is to act as "crisis insurance," and its price is often positively correlated with risk events. The confluence of multiple geopolitical conflicts undoubtedly provided additional upward momentum for gold prices. Against this backdrop, investors have turned to gold as a safe haven because the erosion of the Federal Reserve's independence could weaken the credibility of the U.S. financial system and further amplify global economic uncertainty. Historical experience tells us that whenever the Federal Reserve's policies face political pressure, gold tends to benefit, and this time is no exception. This crisis directly stimulated a surge in safe-haven buying, pushing gold prices to new highs. The market is awaiting this week's CPI and PPI data. These factors, combined, reinforce expectations of a low-interest-rate environment, and gold performs particularly well during low-interest-rate cycles because the cost of holding it decreases. At the same time, the breakeven yield on inflation-protected bonds has risen to 2.289%, indicating that the market expects average annual inflation of approximately 2.3% over the next ten years, further supporting gold's position as an inflation hedge.
In summary, the fact that gold prices briefly broke through the $4600 mark is the result of a combination of multiple uncertainties, from the Powell criminal investigation to geopolitical tensions, and from Federal Reserve policy to inflation expectations. These factors together have built a solid foundation for the upward trend. Although short-term market volatility may increase, the bullish pattern for gold is unlikely to reverse in the short term. Looking ahead, as the Federal Reserve's decisions depend on data and the evolution of global risks, gold still has room for further gains. Investors should closely monitor this week's economic data and court rulings.
Gold is not only the king of safe havens but also a guardian of wealth in turbulent times. In this era full of uncertainties, strategically investing in gold may be a wise move.
For today's trading strategy, the overall bullish outlook remains unchanged, but a short-term short-selling approach is not contradictory. The main focus for the day is to enter the market around the first resistance level of 4630, waiting for a pullback to continue adding long positions. If there are no suitable short-selling opportunities, long positions can also be added during dips. Overall, the short-term trading strategy for gold today is mainly to buy on dips and sell on rallies. The key short-term resistance levels are 4630-4650, and the key short-term support levels are 4570-4550. Everyone should keep up with the pace.

Can We Sell To Get 300 Pips ,Then move with the main direction ?Here is My 15 Mins Gold Chart , and here is my opinion , we again Very Near 4629.00 With 4H Candle , first time this area forced the price to respect it and moved very good to downside , now the price trying to retest this area again , i hope we can sell from the same area and targeting 150 : 400 pips , and we all know the main direction is very bullish so we will sell as a retracement and will find another places to buy from it , so now i`m waiting the price to touch 3629.00 and hope the price will give us a good bearish price action to enter a sell trade . if we have a daily closure above this area this mean this idea will not be valid anymore .
Reasons To Enter :
1- Perfect First Touch For The Area .
2- Clear Bearish Price Action .
3- Bigger T.F Giving Good Bearish P.A .
4- Over Bought .
5- Perfect 30 Mins Closure .
6- Old Res

ICP is on the verge of a big breakout !!Price is coiling inside a massive multi month bullish descending wedge.
Breakout will probably be in days, not in weeks or months.
A floor has been put in at just below 3$ (around 2.91) and I guess this floor will not be broken for the time being.
M A S S I V E volume spike has occurred in november 2025, which should be a prelude of things to come.
ICP is a very ambitious project that is still under the radar and whose image has been affected by its launch that was highjacked by FTX and its Sam Bankman Fried.
ICP could be the number 1 decentralized AI project - the only fully onchain AI project of the digital asset space.
I guess I have still not enough ICP tokens.
NOTE: not financial advice, but I tell you what I am doing with my money.

3 year cup and handle in XINA50C&H over 3 years. Reasonable risk entry defined by an ascending triangle.
This can be traded using Singapore USD-denominated futures.
Not a recommendation, for learning purposes only.

#ICP Is Coiling Up for a Big Move— Classic HNS pattern
Yello Paradisers! Have you spotted what’s shaping up to be a textbook Head and Shoulders pattern on #ICP? If not, you might be missing one of the cleanest bullish setups we’ve seen forming in recent weeks. The structure is clear, and the signals are starting to align—this could be your early heads-up before the next big leg.
💎We’re currently watching a classic inverse Head and Shoulders pattern unfolding, with a notable RSI divergence between the left shoulder and the head. That divergence often signals momentum shifting before price action catches up, and in this case, it’s a sign that buyers may be stepping in just as the pattern is maturing.
💎The neckline is the key level here. If the price breaks through that neckline with conviction, it will confirm the pattern and open the door to a high-confidence breakout scenario. But until that happens, patience is essential. Confirmation is everything in this type of setup.
💎To the downside, major support sits around $2.660. This will act as the final line in the sand for the bullish scenario. If price holds above this level, the bullish structure remains valid. A breakdown below it, however, would invalidate the setup and likely lead to further downside pressure.
💎The first obstacle is around $4.800, just below the psychological round number, which is also the projected level of the HNS pattern. This level may provide temporary rejection or hesitation. The bigger take-profit zone is around $6.500, which marks a significant resistance zone and aligns perfectly with the 0.618 Fibonacci retracement from the Nov–Dec 2025 downswing. That confluence adds even more weight.
💎The market is setting the stage, but the trade isn't ready yet. What matters now is not being early but being right. Let the pattern complete, let the market confirm, and then strike with confidence.
That is why we are playing it safe right now. If you want to be consistently profitable, you need to be extremely patient and always wait only for the best, highest probability trading opportunities like Paradisers do.
MyCryptoParadise
iFeel the success🌴

Hyperliquid Price Confirms Failed Auction as $19.70Hyperliquid is showing clear bearish characteristics after confirming a failed auction at the higher resistance zone near the $27 region. Price briefly attempted to reclaim this high-time-frame resistance, but the move lacked acceptance and quickly resulted in a close back below the level.
This behavior is typical of a failed auction setup, where the market explores higher prices but fails to sustain demand, leading to rotation back into the prior value area.
Following the rejection, the Point of Control has now flipped into overhead resistance, reinforcing bearish pressure. At the same time, the value area low is acting as immediate local support, but it is holding only marginally. Weak defense at this support level increases the probability that price continues rotating lower toward deeper range liquidity.
Key Technical Observations:
- Failed reclaim at $27 confirms a bearish failed auction
- Price trading below the Point of Control keeps sellers in control
- Value area low support is fragile, with downside targets opening lower
- Moving averages are acting as dynamic resistance
As long as Hyperliquid remains capped below the Point of Control and key moving averages, the path of least resistance remains lower. A sustained breakdown from current support would open a rotational move toward $19.70, which represents the high-time-frame support and range-low target for the current structure.
Until resistance is reclaimed with acceptance, bearish continuation remains the higher-probability scenario.

AUDUSD: A Rare “Stop & Reverse” Trading OpportunityToday, we’re taking a look at the AUDUSD, and this is one of those charts that really makes technical traders smile—because we’ve got two patterns forming at the same time that actually complement each other, rather than conflict.
On one hand, we have a potential head and shoulders top, which points toward a bearish trading opportunity if price confirms the pattern. On the other hand, we also have a potential bullish Cypher pattern, which would offer a buying opportunity if it completes as expected.
At first glance, this might sound confusing. How can a market present both a bullish and bearish setup at the same time?
Why This Setup Is So Unique
The key detail here is location. The completion point of the Cypher pattern lines up almost perfectly with the level where I’d be looking to take profits on the head and shoulders trade. In other words: If the head and shoulders plays out, that downside target becomes the exact area where the bullish Cypher would be completing. This creates a rare and powerful situation where a trader can potentially use a “Stop & Reverse” approach: Trade the head and shoulders to the downside, take profits at the Cypher completion zone, then, flip the position and trade the move back to the upside
Rather than choosing between bullish or bearish bias, the market gives us a structured plan for both scenarios, all based on price action and pattern completion.
The Big Takeaway
This is a great example of why technical analysis isn’t about predicting the market—it’s about preparing for multiple outcomes. When patterns align like this instead of asking “Which direction will price go?”, we can focus on “What will I do when price gets here?”
If you have any questions, comments, or want to share your own opinion on the AUDUSD, feel free to leave them below.
And as always, I’d really appreciate it if you hit that like button before you go.
Akil

GOLD Will Go Down! Sell!
Here is our detailed technical review for GOLD.
Time Frame: 4h
Current Trend: Bearish
Sentiment: Overbought (based on 7-period RSI)
Forecast: Bearish
The market is testing a major horizontal structure 4,609.41.
Taking into consideration the structure & trend analysis, I believe that the market will reach 4,502.66 level soon.
P.S
The term oversold refers to a condition where an asset has traded lower in price and has the potential for a price bounce.
Overbought refers to market scenarios where the instrument is traded considerably higher than its fair value. Overvaluation is caused by market sentiments when there is positive news.
Like and subscribe and comment my ideas if you enjoy them!

Elise | BTCUSD · 30M – Higher-Low Formation from HTF DemandBITSTAMP:BTCUSD
Bitcoin absorbed sell pressure inside HTF demand and aggressively reclaimed structure. The impulsive leg from demand confirms institutional participation. Current consolidation near highs is a pause, not weakness. As long as price holds above trend support, continuation remains the higher-probability scenario.
Key Scenarios
✅ Bullish Case 🚀
If price holds above 91,700 – 91,500:
🎯 Target 1: 93,200
🎯 Target 2: 94,000
🎯 Target 3: 94,800 (trend expansion / measured move)
❌ Bearish Case 📉
If M30 closes below 91,300:
Bullish continuation fails
Expect pullback toward 90,500 → HTF demand
Long bias invalidated
Current Levels to Watch
Resistance 🔴: 93,200 → 94,000 → 94,800
Support 🟢: 91,700 → 91,300
⚠️ Disclaimer: This analysis is for educational purposes only. It is not financial advice.

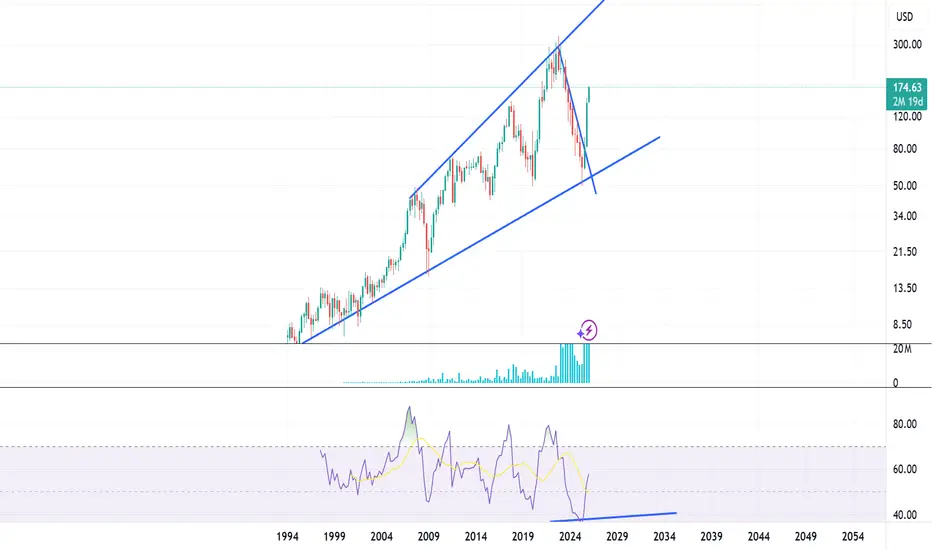
100% Left in the tank?Bought this in July of last year when the RSI was severely OS. Sold at 100% gains and p**sied out to the top, but thinking we might make it up to the top of the channel over the next 6 months. I'd wait for a small correction into the 150-160's, but this doesn't look like it wants to let up if you have fairly high risk appetite. 3 mo RSI still right where we want it to be.
Good luck.
GBPAUD Will Move Lower! Short!
Take a look at our analysis for GBPAUD.
Time Frame: 1h
Current Trend: Bearish
Sentiment: Overbought (based on 7-period RSI)
Forecast: Bearish
The market is approaching a key horizontal level 2.011.
Considering the today's price action, probabilities will be high to see a movement to 2.006.
P.S
We determine oversold/overbought condition with RSI indicator.
When it drops below 30 - the market is considered to be oversold.
When it bounces above 70 - the market is considered to be overbought.
Like and subscribe and comment my ideas if you enjoy them!

$MSFT, still fully short, we are now in trending trading range pNASDAQ:MSFT , still fully short, we are now in trending trading range phase. Next phase ,after this pink box breaks, is always a trending move (just like what happened after the first box broke in November).
In dollar terms this is my largest position, in risk terms the same as any other.

GOLDGOLD IS CALLING FOR CORRECTION IN THE FACE OF GEOPOLITCAL TENSION.MARKET WILL ALWAYS FOLLOW IMPULSE AND CORRECTION PATTERN
what is GOLD XAUUSD ??
Gold (Au) is a chemical element and dense, malleable transition metal prized for its lustrous yellow hue, exceptional conductivity, and resistance to corrosion.
History as Store of Value
Gold has served as a store of value for over 6,000 years, from ancient Egyptian tombs (c. 4000 BCE) symbolizing immortality to Lydian coins (600 BCE) enabling standardized trade across empires like Rome (aureus) and Byzantium (solidus, stable 700+ years). The 19th-century gold standard anchored global currencies until 20th-century abandonments, yet gold retains purchasing power
Tier 1 Status Clarification
Gold classifies as a Tier 1 asset under Basel III banking rules , with 0% risk weighting for physical bullion, equivalent to cash for capital reserves, enhancing bank balance sheets amid fiat volatility. This elevates it from prior Tier 3 status, affirming its role as "money again."
#GOLD #XAUUSD

BULLISH SCENARIO - BTCHello traders,
the BTC price has formed a rectangle pattern.
Let’s look for a bullish scenario:
If the market breaks and closes above the resistance level (92,406 – 91,678),
we can expect a bullish move.
🎯 TARGET: 97,580.00

Pullback and Consolidation: A Must-Read for Retail Investors
Those who have read my articles should know that we mentioned resistance below 4600 during the Asian session, and the market movement was consistent with our prediction. You can check the historical recommendations to verify their accuracy.
Gold is currently maintaining a high-level consolidation, with a risk of pullback on the 4-hour and hourly charts. After yesterday's surge, I mentioned at the opening today that there was a short-term risk of pullback, which is a normal correction. I have consistently stated that the market structure is that after a one-sided move, it enters a range-bound consolidation. Therefore, after each significant one-sided rise, everyone should be prepared for a short-term pullback and consolidation. However, this short-term adjustment and consolidation is not a structural top; on the contrary, it lays the foundation for a better rise in the future! Note that $4550 was the previous high, while yesterday's low was around $4565. As long as the gold price remains above this range, the short-term upward trend will not be broken. Watch for short-term resistance at $4595-$4605; expect a short-term pullback to consolidate.
I focus solely on short-term trading and clear market analysis. In short-term trading, there is no market that rises or falls forever, only the right entry point at any given moment. Find the rhythm and follow the trend. This is the essence of trading. Now, let's discuss the long-term trend of gold:
The gold market in 2026 is at a crucial juncture in the middle of a long bull market. Three core forces continue to solidify the foundation for the rise, determining that the bull market will not easily end.
Firstly, the Fed's interest rate cut cycle and the fading of the dollar's credibility create a double benefit. Secondly, central bank gold purchases provide rigid support. Thirdly, asset allocation demand is booming across the board. In addition, the geopolitical black swan event at the beginning of 2026—the US military action against Venezuela, the ongoing Russia-Ukraine conflict, and the tense situation in the Middle East—will normalize geopolitical risks, allowing gold's safe-haven attributes to continue to materialize. Short-term safe-haven funds will push up gold prices, and in the medium to long term, countries will realize the importance of "risk assets without counterparties," further strengthening gold's reserve status.

Monero Breaks All-Time Highs As Bullish Structure Points HigherMonero (XMRUSD) is now aggressively breaking into new all-time highs, in line with expectations. On the monthly chart, price action continues to suggest significant room for further upside. Monero may be unfolding a five-wave bullish impulse, or alternatively, breaking out from a larger bullish triangle formation. In both scenarios, the technical picture supports much higher levels.
On the weekly timeframe, we are still tracking a projected extended wave (5) of wave 3. Fibonacci cluster targets continue to point toward the 1000 area before a higher-degree wave 4 correction is expected to unfold. At the moment, price appears to be rising within subwave 3 of an ongoing five-wave bullish impulse for wave (5). This suggests that additional gains are likely in the near term.
That said, traders should remain aware of a potential subwave 4 pullback, which would be a normal part of the structure, before a renewed bullish continuation in subwave 5 of wave (5) of 3.

ADAUSD pivotal 3,693 levelThe ADAUSD pair continues to display a bearish outlook, in line with the prevailing downward trend. Recent price action suggests a corrective pullback, potentially setting up for another move lower if resistance holds.
Key Level: 4,336
This zone, previously a consolidation area, now acts as a significant resistance level.
A failed test and rejection at 4,336 would likely resume the bearish momentum.
Downside targets include:
3,700 – Initial support
3,450 – Intermediate support
3,270 – Longer-term support level
Bullish Scenario (breakout above 4,520):
A confirmed breakout and daily close above 4,520 would invalidate the bearish setup.
In that case, potential upside resistance levels are:
4,520 – First resistance
4,736 – Further upside target
Conclusion
ADAUSD remains under bearish pressure, with the 4,520 level acting as a key inflection point. As long as the price remains below this level, the bias favours further downside. Traders should watch for price confirmation around that level to assess the next move.
This communication is for informational purposes only and should not be viewed as any form of recommendation as to a particular course of action or as investment advice. It is not intended as an offer or solicitation for the purchase or sale of any financial instrument or as an official confirmation of any transaction. Opinions, estimates and assumptions expressed herein are made as of the date of this communication and are subject to change without notice. This communication has been prepared based upon information, including market prices, data and other information, believed to be reliable; however, Trade Nation does not warrant its completeness or accuracy. All market prices and market data contained in or attached to this communication are indicative and subject to change without notice.

ETHUSD resistance retestThe ETHUSD pair continues to display a bearish outlook, in line with the prevailing downward trend. Recent price action suggests a corrective pullback, potentially setting up for another move lower if resistance holds.
Key Level: 3,250
This zone, previously a consolidation area, now acts as a significant resistance level.
A failed test and rejection at 3,250 would likely resume the bearish momentum.
Downside targets include:
2,750 – Initial support
2,630 – Intermediate support
2,484 – Longer-term support level
Bullish Scenario (breakout above 3,250):
A confirmed breakout and daily close above 3,250 would invalidate the bearish setup.
In that case, potential upside resistance levels are:
3,350 – First resistance
3,460 – Further upside target
Conclusion
ETHUSD remains under bearish pressure, with the 3,250 level acting as a key inflection point. As long as price remains below this level, the bias favours further downside. Traders should watch for price confirmation around that level to assess the next move.
This communication is for informational purposes only and should not be viewed as any form of recommendation as to a particular course of action or as investment advice. It is not intended as an offer or solicitation for the purchase or sale of any financial instrument or as an official confirmation of any transaction. Opinions, estimates and assumptions expressed herein are made as of the date of this communication and are subject to change without notice. This communication has been prepared based upon information, including market prices, data and other information, believed to be reliable; however, Trade Nation does not warrant its completeness or accuracy. All market prices and market data contained in or attached to this communication are indicative and subject to change without notice.

Binance Coin (BNB): Ideal Risk&Rewards Trading Setup | BullishFirst sign of reversal has been confirmed with buyers taking over the EMAs. Price is now pushing toward local resistance, which could lead to a clean breakout and open a good upside move from here. Nothing complicated, just psychology-based zones. All we need now is a clean breakout to confirm the move.
Swallow Academy

GBP/USD — H8 | Jan 13, 2026 | Elliott Wave Outlook 🔎 GBP/USD — H8 | Jan 13, 2026 | Elliott Wave Outlook — Wave 1 completed, market entering consolidation before Wave 3
• On the H8 timeframe, GBPUSD has completed a 5-wave impulse in yellow, topping at 1.35678, which also marks Wave 1/A in green of a higher-degree cycle.
• Wave (4) yellow unfolded as a white Triangle, followed by a strong breakout in Wave (5) yellow into the high.
• After completing 1/A green, GBPUSD has entered Wave 2/B green, developing as a yellow A–B–C corrective structure.
• Wave A yellow has already completed, and the market is currently moving within Wave B yellow.
• Once Wave B yellow finishes, GBPUSD is expected to form Wave C yellow to complete the entire corrective phase, before triggering Wave 3/C green — the strongest and most impulsive phase of the cycle.
📌 Primary scenario (Bullish – medium term):
• Wait for Wave C yellow to complete, then look for buy opportunities aligned with Wave 3 green.
⛔️ Invalidation level:
• A break below 1.30102 invalidates the bullish structure → wave count must be reassessed.
🧭 Trade philosophy:
Markets do not reverse after a strong trend — they consolidate to travel further.

Ascending?On the daily we have an ascending triangle forming. Eyes on the 94K level. We need bullish activity from there HHs and HLs. Watch out for breaches and fakeouts below the yellow trendline.
