AUDJPY potential shorts due weaker than expected China eco data.Industrial output grew by 5.7% year-on-year in July, down from 6.8% in June, marking the slowest growth since November 2024. This fell short of the 5.9% forecast by analysts in a Reuters poll and 5.82% by Wind.
Retail sales, a key gauge of consumption, rose by 3.7% year-on-year in July, down from 4.8% in June and below the expected 4.6% (Reuters) and 4.87% (Wind). This was the slowest growth since December 2024.
The reason for this trade idea is that Australia ranks as China’s seventh-largest trading partner overall, based on data from the Australian Department of Foreign Affairs and Trade and Chinese trade reports. Australia is China’s fifth-largest source of imports (primarily commodities like iron ore, coal, and natural gas) and tenth-largest export destination. Any news emerging from China has the potential to impact the Australian dollar.
China

Tuesday’s triple risk: Tariffs, RBA rate cut, and U.S. inflationTraders face a busy Tuesday with developments on U.S. China trade talks, a RBA policy decision, and the latest U.S. inflation data.
U.S. China tariff deadline – Tuesday
The current truce between the U.S. and China is set to expire on 12 August, with U.S. Commerce Secretary Lutnick indicating it will likely be extended by 90 days. China may also face an additional 25% tariff on Russian oil imports, like measures already applied to India.
RBA announcement – Tuesday
The Reserve Bank of Australia is widely expected to cut rates, with a Reuters poll showing all 40 surveyed economists anticipating a 25bp reduction to 3.60%. The broader market is pricing a 98% probability of that outcome and a 2% chance of a larger 50bp cut.
U.S. CPI – Tuesday
Headline U.S. CPI for July is expected to rise 0.2% month-on-month taking the annual rate to 2.8% from 2.7%. Wells Fargo notes that the figures may show further signs of higher tariffs feeding into consumer prices.
JD Options Ahead of EarningsIf you haven`t bought JD before the recent rally:
Now analyzing the options chain and the chart patterns of JD prior to the earnings report this week,
I would consider purchasing the 32.50usd strike price Calls with
an expiration date of 2026-1-16,
for a premium of approximately $3.10.
If these options prove to be profitable prior to the earnings release, I would sell at least half of them.
Disclosure: I am part of Trade Nation's Influencer program and receive a monthly fee for using their TradingView charts in my analysis.

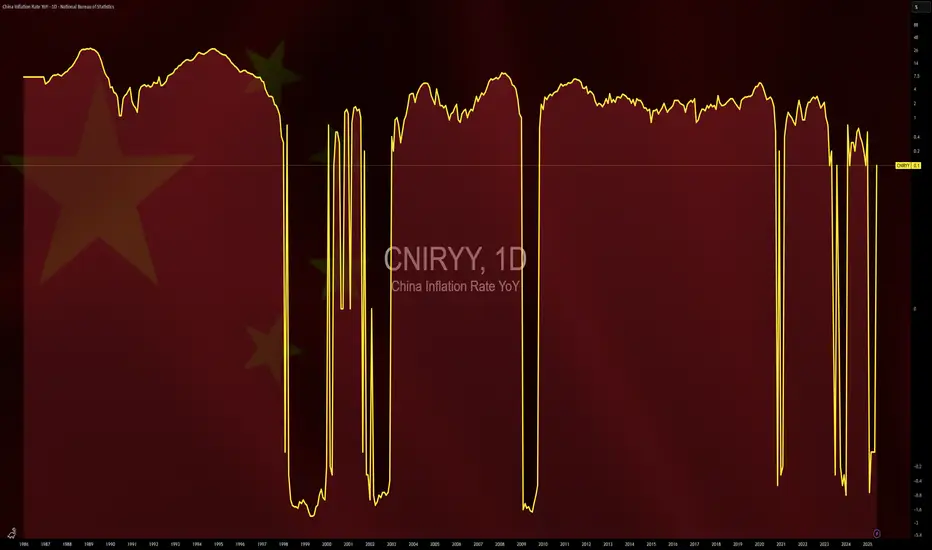
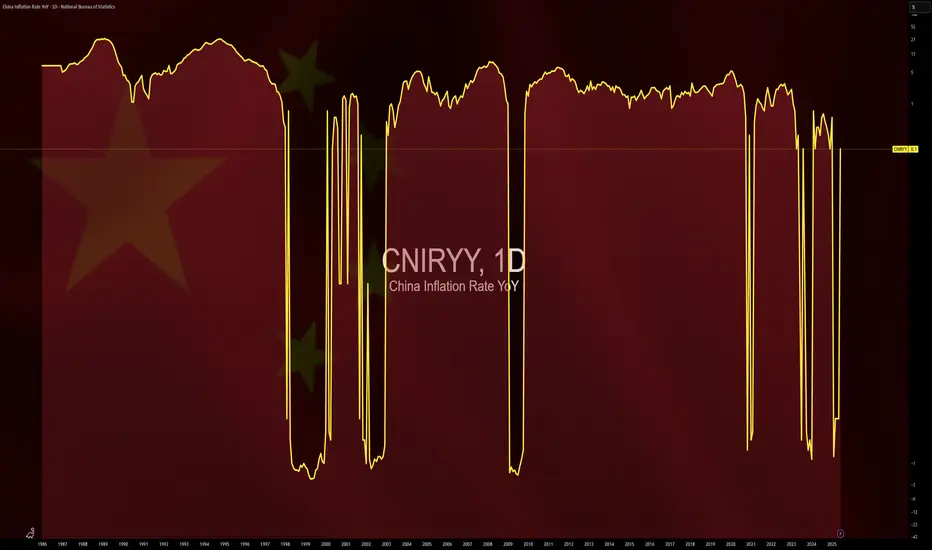
$CNIRYY -China CPI Data Beats Forecasts (July/2025)ECONOMICS:CNIRYY
July/2025
source: National Bureau of Statistics of China
- China’s consumer prices were flat yoy in July 2025,
surpassing expectations for a 0.1% decline and following a 0.1% rise in June.
Non-food prices picked up, supported by Beijing’s consumer goods subsidies. Meanwhile, producer prices fell 3.6%, extending declines for the 34th month and holding at the steepest drop since July 2023.
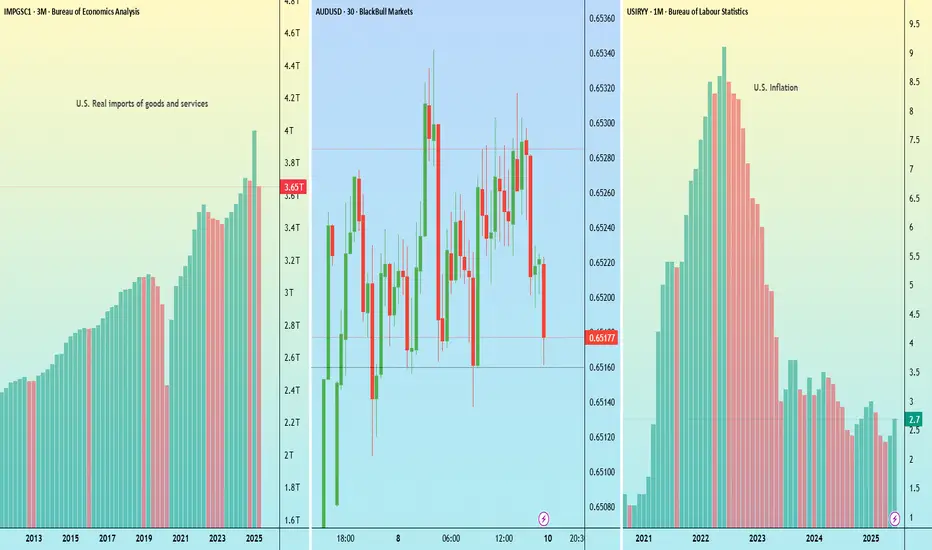
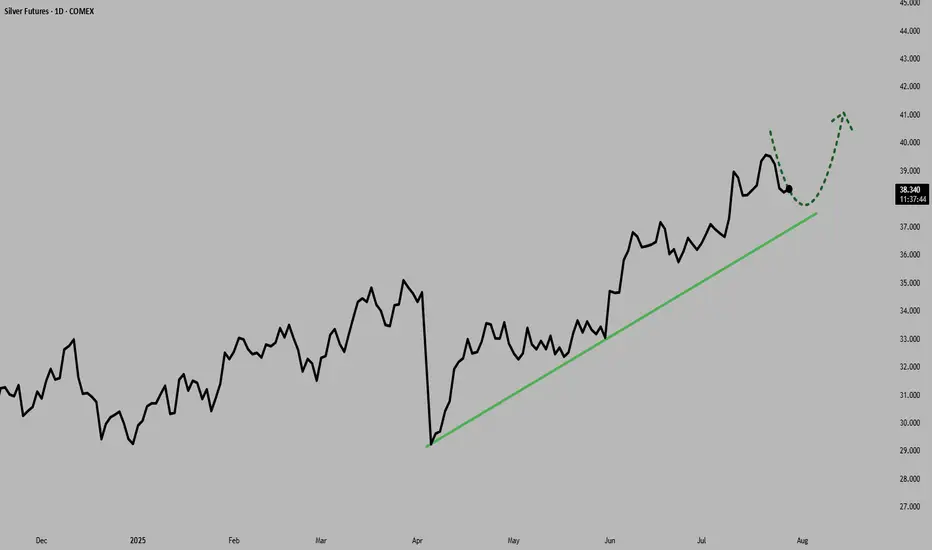
Silver Near $40: Deficits and Demand Fuel the RallySilver prices surged to multi-year highs in July 2025, driven by an extraordinary convergence of bullish factors, pushing prices above $39 per ounce, levels last seen in 2011.
Silver’s rally, supported by robust industrial demand and safe-haven inflows, aligns with traditional patterns as the U.S. dollar has weakened over 2.3% over the recent period.
Macroeconomic Drivers and the U.S. Dollar
Silver's rally is unfolding around shifting macro conditions. The Federal Reserve has kept interest rates at a restrictive 4.25-4.50% throughout 2025 due to persistently high inflation (2.7% YoY). However, expectations for more rate cuts are growing, with the CME FedWatch tool showing a 59.8% probability of a cut at the September meeting as of July 28.
Adding to the complexity, U.S. trade policies have triggered significant market volatility and raised concerns over a potential supply shock. The U.S. administration has imposed steep 30% tariffs on imports from Mexico, set to resume on August 1. This has heightened fears, as Mexico is the world’s largest silver producer and supplies over half of U.S. silver imports.
But macro drivers aren’t the full story. The real force behind silver’s rally lies in the physical market itself. A structural supply deficit, escalating industrial demand, and growing investor appetite from Asia and North America, are proving to be far more pivotal than shifting rates or a softer dollar.
Physical Market Dislocation and Industrial Demand
The year 2025 marks the fifth consecutive year of a structural deficit in the global silver market, and the imbalance between supply and demand shows no sign of easing.
With minimal new mining capacity expected to come online and lengthy lead times for project development, supply constraints are structural rather than temporary.
Since 2021, the cumulative shortfall has reached nearly 800 million ounces (25,000 tons), steadily drawing down available inventories and tightening the market.
Industrial demand remains the central pillar of silver’s bull market. Forecasts for 2025 project record consumption of roughly 700 million ounces, driven by rapid adoption in green technologies and digital infrastructure. The electrical and electronics sector, which includes solar photovoltaics (PV), consumer electronics, automotive electronics, power grids, and 5G networks, has increased its silver usage by 51% since 2016.
Solar PV alone consumed approximately 197.6 million ounces in 2024, a record largely driven by China’s 45% expansion in solar capacity. With global EV production expected to approach 20 million units in 2025, automotive silver demand alone could exceed 90 million ounces.
Together, persistent deficits, accelerating industrial consumption, and capital flowing into physically backed investment vehicles are creating a market where available silver is increasingly scarce, amplifying upside pressure on prices regardless of short-term macroeconomic shifts.
COMEX silver inventories peaked at 504.72 million ounces on May 11 but have since eased back to levels last seen on April 24, indicating a recovery in demand following the large accumulation in US inventories post-tariff shock.
Positioning and Ratios Favour Gains
With net inflows of 95 million ounces in the first half of 2025, silver ETP investment has already surpassed the total for all of last year. By June 30, global silver ETP holdings reached 1.13 billion ounces, just 7% below their highest level since the peak of 1.21 billion ounces in February 2021
Futures positioning has also surged , with long positions up 163% over six months. These factors have helped propel silver prices over 35% higher year-to-date, building on a 21% gain in 2024.
The iShares SLV ETF netted inflows of $1,467.5 million over the past 3 months.
Physical silver investment demand remains robust, with significant buying from Asian markets. India, the world’s leading silver importer, saw record purchases of physical bullion and silver-backed ETFs during the first six months of 2025.
The gold-to-silver ratio, currently in the late 80s, remains historically elevated, suggesting silver remains significantly undervalued compared to gold. This indicates substantial upside potential for silver, especially given persistent market deficits, rising industrial and investment demand, and gold rising at the same time.
Hypothetical Trade Set-up
The silver market’s bullish fundamentals appear increasingly robust. Investors may consider accumulating silver positions, viewing short-term consolidations as attractive buying opportunities amid the compelling long-term outlook.
Options open interest for the September contract shows a bullish bias with a put/call ratio of 0.82 and high call interest at the far out-of-the-money call strike of $45 per ounce.
To express a bullish view on silver, investors can deploy a long position in CME Silver futures expiring in September. A hypothetical trade setup for this view is described below.
● Entry: $38.00 per ounce
● Target 1: $40.00 per ounce
● Target 2 (extension): $42.00 per ounce (if Fed easing in September coincides with physical tightness)
● Stop Loss: $36.70 per ounce
● Profit at Target 1: $10,000
● Profit at Target 2: $20,000
● Loss at Stop: $6,500
● Reward-to-risk ratio: 1.54 (Target 1) and 3.08 (Target 2)
Alternatively, investors can exercise the same view using CME Micro Silver futures, which offer smaller notional positions and more flexibility. Each Micro contract is priced in USD per ounce and represents 1,000 ounces of silver, compared to 5,000 ounces for the standard contract.
MARKET DATA
CME Real-time Market Data helps identify trading set-ups and express market views better. If you have futures in your trading portfolio, you can check out on CME Group data plans available that suit your trading needs tradingview.com/cme .
DISCLAIMER
This case study is for educational purposes only and does not constitute investment recommendations or advice. Nor are they used to promote any specific products, or services.
Trading or investment ideas cited here are for illustration only, as an integral part of a case study to demonstrate the fundamental concepts in risk management or trading under the market scenarios being discussed. Please read the FULL DISCLAIMER the link to which is provided in our profile description.
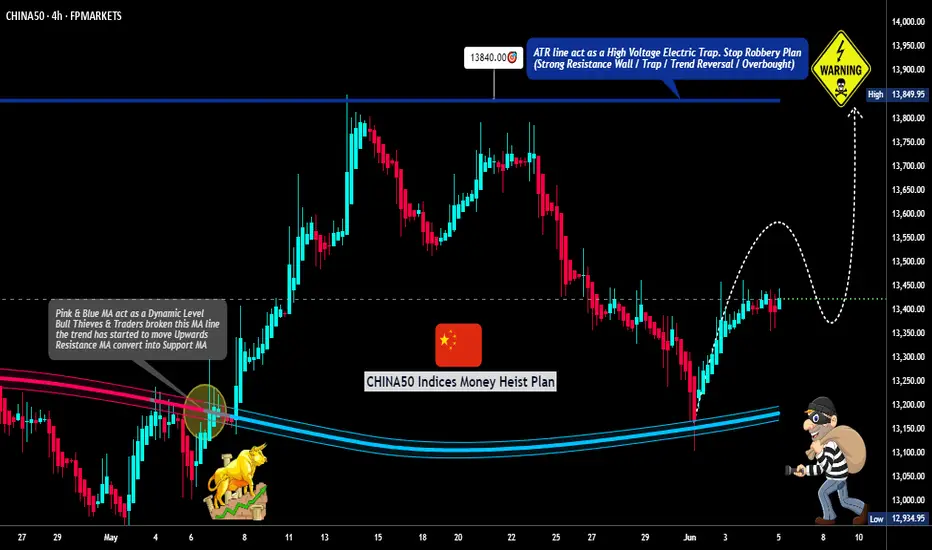
China50 Target Locked | Long Setup via Thief Strategy🏴☠️ CHINA50 Market Robbery Blueprint 🔥 | Thief Trading Style (Swing/Day Plan)
🌍 Hey Money Makers, Chart Hackers, and Global Robbers! 💰🤑💸
Welcome to the new Heist Plan by your favorite thief in the game — this time targeting the CHINA50 Index CFD like a smooth criminal on the charts. 🎯📊
This is not your average technical analysis — it's a strategic robbery based on Thief Trading Style™, blending deep technical + fundamental analysis, market psychology, and raw trader instincts.
💼 THE SETUP — PREPARE FOR THE ROBBERY 🎯
We're looking at a bullish operation, setting up to break into the high-value vaults near a high-risk, high-reward resistance zone — beware, it's a high-voltage trap area where pro sellers and bearish robbers set their ambush. ⚡🔌
This plan includes a layered DCA-style entry, aiming for max profit with controlled risk. Chart alarms on, mindset ready. 🧠📈🔔
🟢 ENTRY: "The Robbery Begins"
📍 Zone-1 Buy: Near 0.63700 after MA pullback
📍 Zone-2 Buy: Near 0.62800 deeper pullback
🛠️ Entry Style: Limit Orders + DCA Layering
🎯 Wait for MA crossover confirmations and price reaction zones — don’t chase, trap the market.
🔻 STOP LOSS: "Plan the Escape Route"
⛔ SL for Pullback-1: 13540 (4H swing low)
⛔ SL for Pullback-2: 13350
📌 SL placement depends on your position sizing & risk management. Control the loss; live to rob another day. 🎭💼
🎯 TARGET ZONE: “Cash Out Point”
💸 First TP: 14100
🏁 Let the profit ride if momentum allows. Use a trailing SL once it moves in your favor to lock in gains.
👀 Scalpers Note:
Only play the long side. If your capital is heavy, take early moves. If you’re light, swing it with the gang. Stay on the bullish train and avoid shorting traps. Use tight trailing SL.
🔎 THE STORY BEHIND THE HEIST – WHY BULLISH?
CHINA50 shows bullish momentum driven by:
💹 Technical bounce off major support
🌏 Macroeconomic & geopolitical sentiment
📰 Volume + sentiment shift (risk-on)
📈 Cross-market index confirmation
🧠 Smart traders are preparing, not reacting. Stay ahead of the herd.
👉 For deeper insight, refer to:
✅ Macro Reports
✅ COT Data
✅ Intermarket Correlations
✅ CHINA-specific index outlooks
⚠️ RISK WARNING – TRADING EVENTS & VOLATILITY
🗓️ News releases can flip sentiment fast — we advise:
❌ Avoid new positions during high-impact events
🔁 Use trailing SLs to protect profit
🔔 Always manage position sizing and alerts wisely
❤️ SUPPORT THE CREW | BOOST THE PLAN
Love this analysis? Smash that Boost Button to power the team.
Join the Thief Squad and trade like legends — Steal Smart, Trade Sharp. 💥💪💰
Every day in the market is a new heist opportunity — if you have a plan. Stay tuned for more wild robbery blueprints.
📌 This is not financial advice. Trade at your own risk. Adjust based on your personal strategy and capital. Market conditions evolve fast — stay updated, stay alert.

China's Economic Storm: A Global Wake-Up CallChina, the world’s second-largest economy, is facing a perfect storm of demographic collapse, a housing market crash, and a strategic sell-off of US treasuries. These interconnected crises threaten not only China’s stability but also global markets, impacting forex traders, investors, and businesses worldwide. This article unpacks the unfolding challenges and their far-reaching implications, as discussed in our latest Edge Forex podcast.
A Demographic Time Bomb
China’s population is aging faster than any major economy in history, driven by a fertility rate of just 1.1–1.2 children per woman—well below the 2.1 needed to sustain a population. The legacy of the one-child policy has left a shrinking workforce and a projected 400 million people over 65 by 2050, comprising one-third of the population. This demographic cliff strains pensions and healthcare systems while youth unemployment, reported at 20% in 2023, fuels social discontent. Government subsidies to boost birth rates have failed, as high living costs and a drying job market deter young couples from starting families.
The result? A shrinking labor force, slowing GDP growth, and brewing social unrest. By 2080, China’s population could halve, leaving empty cities and businesses without workers. This isn’t just a numbers game—it’s a crisis that could derail China’s economic engine for decades.
Housing Market Collapse: A Crumbling Pillar
Once the backbone of China’s economic miracle, the housing sector is now a liability. New home prices have plummeted 23–25%, with monthly declines of 6–7%. Accounting for 25–30% of GDP, this sector’s collapse is catastrophic. The liquidation of Evergrande in 2024, with $310 billion in debt, exposed the over-leveraged nature of China’s property market. Goldman Sachs estimates $13 trillion (93 trillion RMB) in excess inventory—millions of empty condominiums in ghost towns, with malls and highways leading nowhere.
Housing represents 60–70% of Chinese household wealth, so falling prices are crushing consumer confidence and spending. Local governments, reliant on land sales, face budget crises, and an 8 trillion RMB stimulus has fallen short. This slow-motion crash, reminiscent of Japan’s 1989 property bubble but worsened by demographic decline, threatens financial stability and global economic growth.
US Treasury Sell-Off: A High-Stakes Gamble
In 2024, China slashed its US mortgage-backed securities holdings by 20%, part of a broader sell-off of US treasuries. This isn’t a choice but a necessity, driven by declining export revenues and insufficient funds to meet domestic and international obligations. The sell-off, fueled by a trade war and a sharp drop in US exports post-tariffs, forces China to liquidate treasuries to access US dollars. However, this move risks raising US interest rates, disrupting global housing markets, and escalating geopolitical tensions.
Charts show China’s treasury holdings peaking around 2005 before a sharp decline, while other economies like the Eurozone and UK increase their purchases. This shift could flood bond markets, pushing up yields and affecting forex pairs like USD/CNY. While short-term relief for China, this sell-off is a long-term gamble that could isolate it financially and signal deeper economic distress.
Global Implications for Markets and Forex
China’s export slump, treasury sell-offs, and housing crisis paint a picture of a nation losing its economic grip. For forex traders, the weakening Chinese Yuan against the US Dollar (USD/CNY) is a key focus, as economic stagnation and treasury sales pressure the currency. Higher US interest rates from these sell-offs could strengthen the USD, impacting global currency pairs and emerging markets. Investors in Chinese equities or real estate face risks from declining growth prospects, while businesses reliant on Chinese demand—think commodities or luxury goods—may see revenues shrink.
At Edge Forex, we see this as a red flag for long-term investors. Diversifying into assets less tied to China, such as Eurozone or UK markets absorbing treasury sales, could mitigate risks. The global ripple effects are undeniable: China’s slowdown could depress demand, disrupt bond markets, and create volatility across forex and equity markets.
What’s Next for Traders and Investors?
Monitor USD/CNY: Expect volatility as China’s economic woes weaken the Yuan.
Track Global Rates: Treasury sell-offs could push up US yields, impacting housing and forex markets.
Diversify Portfolios: Reduce exposure to Chinese assets and explore26% of Chinese household wealth, so falling prices erode consumer confidence.

CNY/USD Trend since 06 2007. Channel. Reversal zone.Logarithm. Time frame 1 week. At the moment, the currency is stronger than the dollar.
The main trend is a descending channel. The price is in it now.
Secondary trend — breakout of the descending trend line. Price growth to the median of the channel, and in case of its breakthrough, to the resistance. If not, then a pullback to the lower zone of the channel.
Local trend — The nearest events and news background, which can affect (not necessarily) locally (movements to the median of the channel, i.e., the middle, if it is positive) on the yuan rate. This, in less than 1 month, namely from October 22 to 24, 2024 will be held 7.16 XVI BRICS summit (short for Brazil, Russia, India, China, South Africa) in Russia in Kazan.
Line graph for visualization.

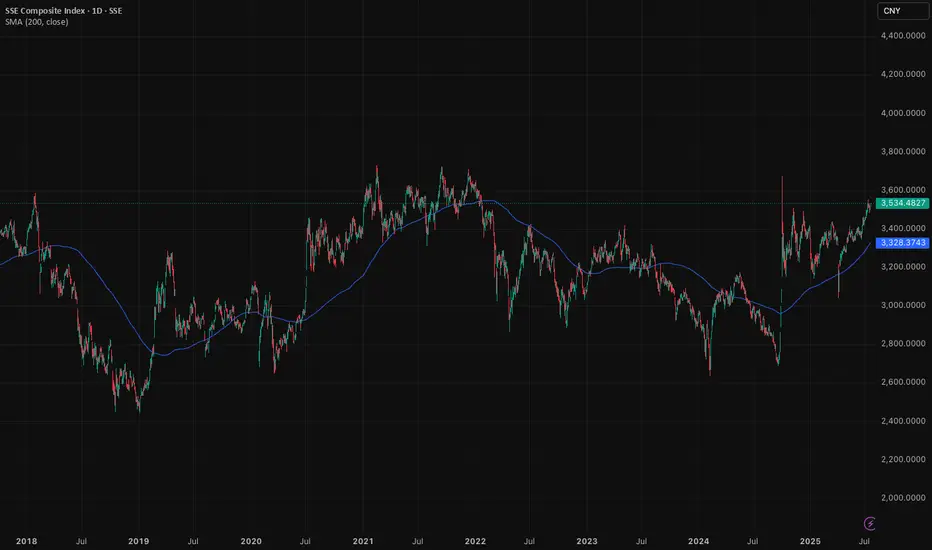
Shanghai Composite: Double bottom signals potential upsideChinese stocks are not for the faint-hearted. It's a market with a lot of volatility, swings, and roundabouts. Despite this, we've been keeping a close eye on the Shanghai Composite Index over the past few weeks and like the pattern we are seeing emerge.
As of the time of writing, the Shanghai Composite Index trades in the 3,500 range. A clear double bottom emerged in September and January last year, as indicated in the chart. We think this is a bullish pattern. When markets test the lows twice and rebound, conviction grows. The worst, it seems, is maybe behind us.
New trades should take important note and understand that Shanghai-listed stocks differ greatly from the H-shares trading in Hong Kong. The Shanghai Composite primarily includes A-shares, domestic Chinese companies driven by local sentiment and liquidity. H-shares, though still Chinese firms, list offshore in Hong Kong and often reflect global investor attitudes rather than local momentum.
Understanding your instrument is crucial. While Shanghai A-shares capture China's domestic economic pulse, H-shares in Hong Kong frequently mirror global risk appetite and geopolitical narratives. Our bullish case lies specifically with the Shanghai market. It is a bet on China's internal economic recovery, supportive policy measures, and improving investor sentiment.
China’s economic stabilisation is underway. Stimulus measures from Beijing are gaining traction. Property market stabilisation efforts (which are medium term in nature) and easing monetary policy signal confidence. Domestic investors, increasingly optimistic, are positioned to drive a sustained rally.
The Shanghai Composite Index could see upside towards the 4,000 and then 4,500-level in the coming years, if the rally continues. Our conviction rests on improving domestic fundamentals, policy tailwinds, and powerful market sentiment unique to mainland China's equity landscape.
Caution is important, given the volatility nature of the index.
The forecasts provided herein are intended for informational purposes only and should not be construed as guarantees of future performance. This is an example only to enhance a consumer's understanding of the strategy being described above and is not to be taken as Blueberry Markets providing personal advice.
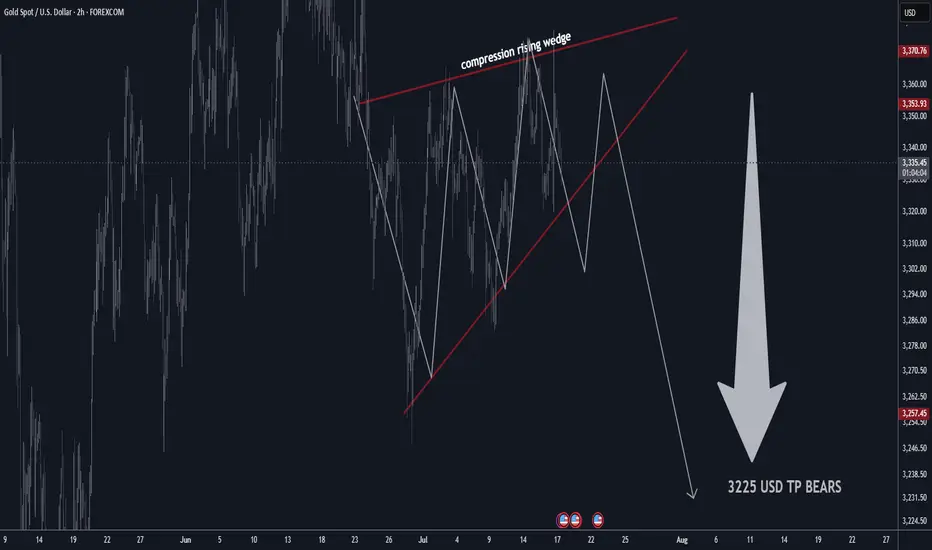
GOLD H2 Rising Wedge Expecting SellOFF TP BEARS 3225 USD📊 Gold Technical Outlook Update – H4 & 2H Chart
📰 Latest Summary Headlines
• Gold stalls near highs as technical compression signals possible breakdown
• Bearish rising wedge on 2-hour chart hints at sharp move lower
• Market volatility stays elevated amid global economic risks
• Short-term sellers targeting $3,225 if wedge pattern breaks
________________________________________
🏆 Market Overview
• Gold remains in a choppy range, struggling to clear key resistance.
• 2H Chart: Bearish rising wedge pattern identified, showing compression—expecting a potential breakdown soon.
• Overhead resistances: $3,410 / $3,460 USD will likely cap further upside.
• Major supports: $3,160 / $3,240 USD.
• If support fails, next key bear target is $3,225 USD.
• Range trading remains favored for now.
• Volatility likely to persist with no major bullish headlines on the horizon.
________________________________________
⭐️ Recommended Trade Strategy
• Bearish Setup (2H): Short sell gold at market on wedge breakdown.
o Stop loss: Above recent highs (set according to your risk tolerance and latest 2H swing high).
o Take profit: Target $3,225 USD.
• Continue to focus on selling near resistance, buying near support.
• Momentum: Watch for sharp moves as wedge resolves—be nimble!
• Always manage risk and adjust stop as price develops.
________________________________________
💡 Gold Market Highlights
• Safe-haven demand still strong due to tariffs, geopolitical tension, and U.S. fiscal concerns.
• Central banks & investors remain net buyers, but jewelry demand slides at high prices.
• Price action is dominated by institutional flows, with banks forecasting potential for gold above $4,000 next year—but short-term correction likely if wedge breaks.
• Current price: ~$3,358 per ounce. Compression suggests a larger move coming soon.
________________________________________
Summary:
Gold is at a crossroads, with a bearish wedge pattern building on the 2-hour chart. A breakdown could see a quick move to $3,225. Short sellers should act on confirmation, while bulls will look to reload at key support. Stay tactical!
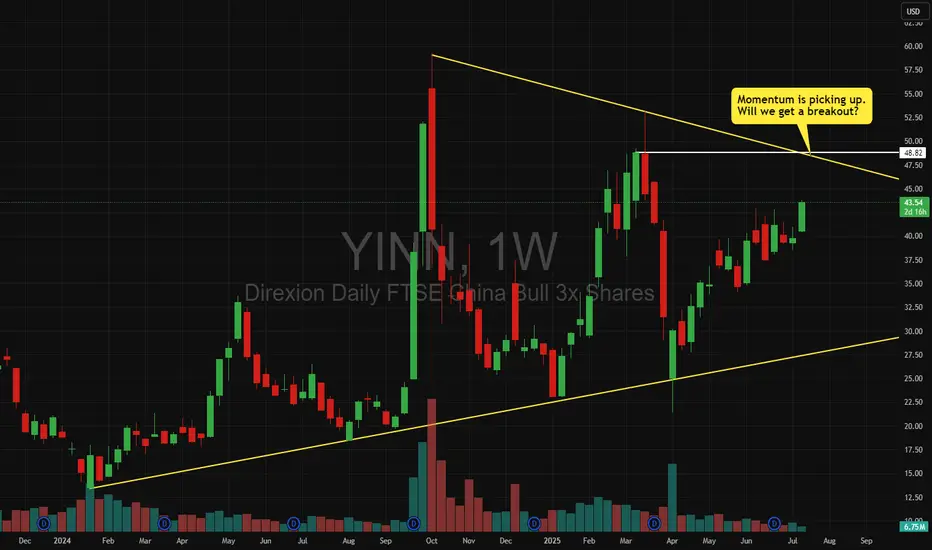
YINN - We could get a bullish breakout of the triangleMomentum seems to be picking up.
Will we a break out of the triangle?
Let's watch the $48 level.
Will China's strong growth and ongoing stimulus lift the HK50?
Despite US-China trade tensions and weak domestic demand, China’s GDP growth has surpassed its 5% target for the first half of the year. According to the National Bureau of Statistics, Q2 GDP grew 5.2% YoY, with authorities noting that stimulus measures aimed at boosting consumption had some effect. Reflecting this momentum, Morgan Stanley raised its 2024 China growth forecast from 4.2% to 4.5%, while Deutsche Bank revised its outlook to 4.7%, a 0.2 percentage point increase.
HK50 maintained its steady uptrend, marking a new 4-month high. Both EMAs widen the gap, indicating the potential continuation of bullish momentum. If HK50 breaches above the recent high at 24600, the index could gain upward momentum toward the next resistance at 24900. Conversely, if HK50 breaks below the support at 24100, the index may retreat to 23730.

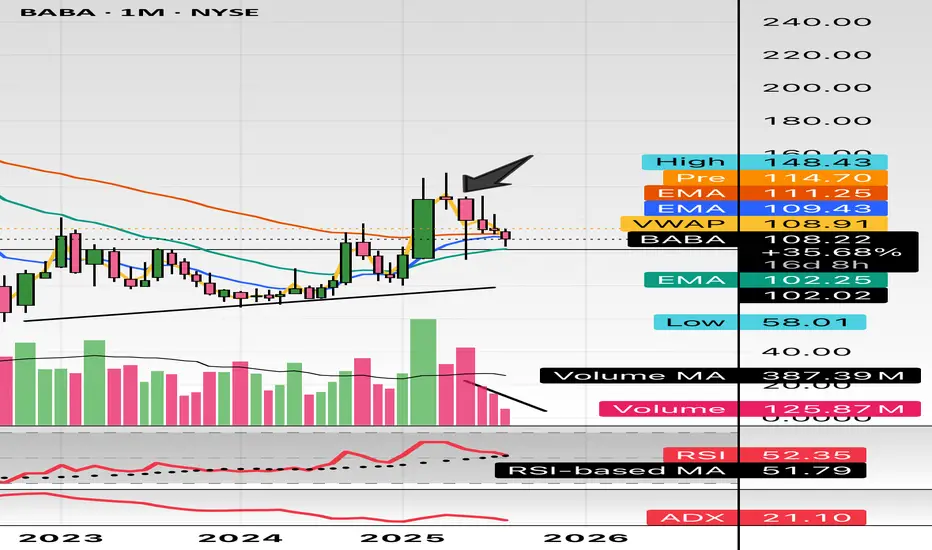
$BABA don’t miss this milky bottle. Called this out at $105 in minds. This Monthly declining volume, support at $100, and uptrend pattern. China will boom into the end of Q3 and early 2026. Target is $180 and $200.
WSL.
$CNGDPYY -China GDP Growth Slows Less Than Expected (Q2/2025)ECONOMICS:CNGDPYY
Q2/2025
source: National Bureau of Statistics of China
- China’s economy expanded 5.2% yoy in Q2 2025, easing from 5.4% in the prior two quarters and marking the softest pace since Q3 2024.
Still, the latest reading narrowly beat estimates of 5.1%, supported in part by Beijing’s policy measures amid a fragile trade truce.
Growth momentum in H2 is projected to weaken further, due to headwinds from trade tensions, deflation risks, and a prolonged property slump.

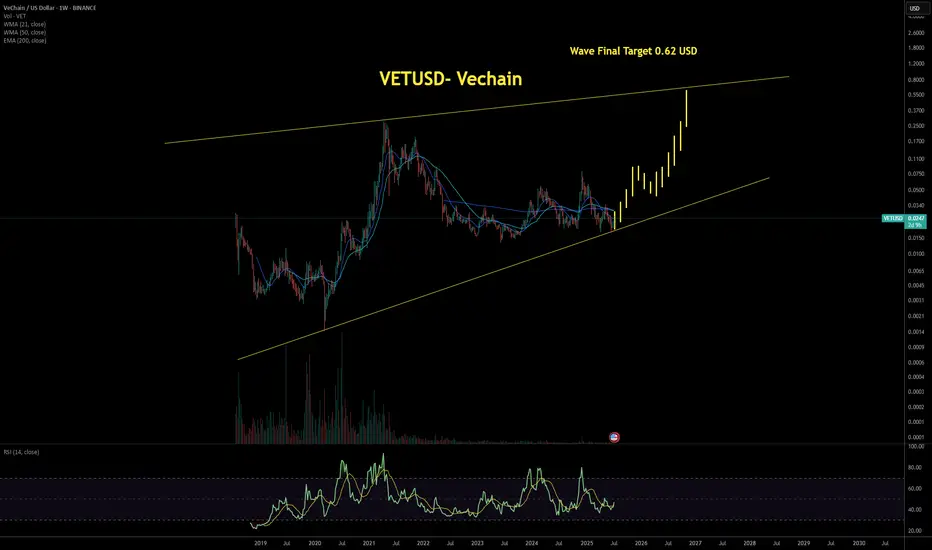
VETUSD – VeChain’s Wave Finale: Road to $0.62VeChain (VETUSD) is showing bullish intent with momentum accelerating out of a defined trend channel. I would like to highlight the technical analysis suggesting a potential wave culmination at the $0.62 mark—a sharp leap from its current price of $0.0247. Backed by strong volume and RSI movement, the setup hints at investor optimism and possible breakout continuation.
- Wave Projection: Interpret the technical channel and present a wave count culminating in the $0.62 target.
- Price Action: Emphasize the recent surge (+13.18%) as a catalyst for bullish sentiment.
- Volume & RSI: Use indicators shown in the chart to validate potential continuation.
- Risk Disclosure: Note that speculative wave targets should be assessed with broader market confirmation.
“Do you see VET following through to the projected wave target, or do you anticipate a mid-wave correction? Drop your analysis and let’s discuss.
$CNIRYY -China's Inflation Data (June/2025)ECONOMICS:CNIRYY
June/2025
source: National Bureau of Statistics of China
- China’s consumer prices rose by 0.1% yoy in June 2025,
reversing a 0.1% drop in the previous three months and surpassing market forecasts of a flat reading.
It marked the first annual increase in consumer inflation since January, driven by e-commerce shopping events, increased subsidies for consumer goods from Beijing, and easing trade risks with the U.S.
Core inflation, which excludes volatile food and fuel prices, rose 0.7% yoy, marking the highest reading in 14 months and following a 0.6% gain in May.
On a monthly basis, the CPI fell 0.1%, after May's 0.2% drop, pointing to the fourth monthly decline this year.
China's PPI slides, Australian dollar steadyThe Australian dollar is almost unchanged on Wednesday. In the European session, AUD/USD is trading at 0.6532, up 0.03% on the day.
China's producer price index surprised on the downside in June, with a steep 3.6% y/y decline. TThe soft PPI report was driven by weak domestic demand and the continuing uncertainty over US tariffs. The lack of consumer demand was reflected in the weak CPI reading of 0.1% y /y, the first gain in four months. Monthly, CPI declined by 0.1%, following a 0.2% drop in May. There was a silver lining as core CPI rose 0.7% y/y, the fastest pace in 14 months.
The uncertainty over US President Trump's tariff policy continues to perplex the financial markets. Trump had promised a new round of tariffs against a host of countries on July 9 but he has delayed that deadline until August 1.
China, the world's second-largest economy after the US, has taken a hit from US tariffs, as China's exports to the US are down 9.7% this year, However, China has mitigated much of the damage as China's exports to the rest of the world are up 6%. There is a trade truce in effect between the two countries but the bruising trade war will continue to dampen US-China trade.
With no tier-1 events out of the US today, the FOMC minutes of the June meeting will be on center stage. The Fed held rates at that meeting and Fed Chair Powell, who has taken a lot of heat from Donald Trump to cut rates, defended his wait-and-see-attitude, citing the uncertainty that Trump's tariffs are having on US growth and inflation forecasts.his was below the May decline of 3.3% and the consensus of -3.2%. China has posted producer deflation for 33 successive months and the June figure marked the steepest slide since July 2023. Monthly, PPI declined by 0.4%, unchanged over the past three months.

China50 to find sellers at current market price?CHN50 - 24h expiry
Selling posted close to the previous high of 13800.
13868 has been pivotal.
Bespoke resistance is located at 13800.
Early optimism is likely to lead to gains although extended attempts higher are expected to fail.
We look for a temporary move higher.
We look to Sell at 13795 (stop at 13890)
Our profit targets will be 13515 and 13435
Resistance: 13821 / 13905 / 14000
Support: 13764 / 13676 / 13638
Risk Disclaimer
The trade ideas beyond this page are for informational purposes only and do not constitute investment advice or a solicitation to trade. This information is provided by Signal Centre, a third-party unaffiliated with OANDA, and is intended for general circulation only. OANDA does not guarantee the accuracy of this information and assumes no responsibilities for the information provided by the third party. The information does not take into account the specific investment objectives, financial situation, or particular needs of any particular person. You should take into account your specific investment objectives, financial situation, and particular needs before making a commitment to trade, including seeking advice from an independent financial adviser regarding the suitability of the investment, under a separate engagement, as you deem fit.
You accept that you assume all risks in independently viewing the contents and selecting a chosen strategy.
Where the research is distributed in Singapore to a person who is not an Accredited Investor, Expert Investor or an Institutional Investor, Oanda Asia Pacific Pte Ltd (“OAP“) accepts legal responsibility for the contents of the report to such persons only to the extent required by law. Singapore customers should contact OAP at 6579 8289 for matters arising from, or in connection with, the information/research distributed.

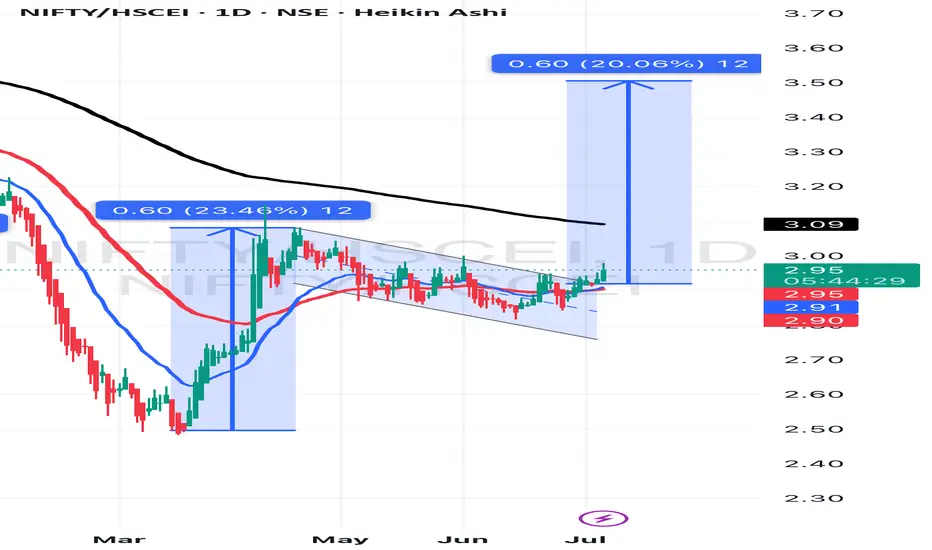
India vs ChinaYear to date, NIFTY has underperformed China - but not recently. Nifty outperformed HSCEI by nearly 20% pts between mid-Mar to mid-Apr and the over the last 2 months, gave back nearly half of these gains! What happened next?
The pullback appears to be a "flag" pattern - typically a bullish continuation - if this breakout holds (stays above 2.9 for NIFTY/HSCEI), Then the measuring implication is a whopping 3.5 - an outperformance of 18-20% pts.
Long Nifty/ HSCEI, currently ay 2.95; stops at 2.85
China50 to find sellers at current swing high?CHN50 - 24h expiry
Selling posted close to the previous high of 13800.
13868 has been pivotal.
Bespoke resistance is located at 13800.
Early optimism is likely to lead to gains although extended attempts higher are expected to fail.
We look for a temporary move higher.
We look to Sell at 13795 (stop at 13875)
Our profit targets will be 13555 and 13505
Resistance: 13699 / 13760 / 13800
Support: 13600 / 13510 / 13431
Risk Disclaimer
The trade ideas beyond this page are for informational purposes only and do not constitute investment advice or a solicitation to trade. This information is provided by Signal Centre, a third-party unaffiliated with OANDA, and is intended for general circulation only. OANDA does not guarantee the accuracy of this information and assumes no responsibilities for the information provided by the third party. The information does not take into account the specific investment objectives, financial situation, or particular needs of any particular person. You should take into account your specific investment objectives, financial situation, and particular needs before making a commitment to trade, including seeking advice from an independent financial adviser regarding the suitability of the investment, under a separate engagement, as you deem fit.
You accept that you assume all risks in independently viewing the contents and selecting a chosen strategy.
Where the research is distributed in Singapore to a person who is not an Accredited Investor, Expert Investor or an Institutional Investor, Oanda Asia Pacific Pte Ltd (“OAP“) accepts legal responsibility for the contents of the report to such persons only to the extent required by law. Singapore customers should contact OAP at 6579 8289 for matters arising from, or in connection with, the information/research distributed.

GOLD 4H: structure broken - phase reversal beginsTwo key directional signals were recorded on the gold chart: first, a breakdown of the ascending channel, followed by a confident downward exit from the triangle with a clear fixation under the $3297 boundary. Both figures worked independently, but consistently - and strengthened the impulse towards selling.
The price has already gone beyond the lower boundary of the triangle ($3297), confirming the bearish scenario. Candlesticks closing under the level and local consolidation from below is a characteristic formation before the momentum continues.
Technical parameters:
- Channel breakout: completed
- Triangle breakout: $3297 level
- Retest from below: expected as confirmation
- EMAs reversed downwards, structure broken
- Volumes strengthened at the moment of breakout
Tactical plan:
- Sell after retest of $3297
- Targets on the move: $3248 and $3201
- Stop: above $3305 (above the area of false outs).
The current structure indicates the end of the accumulation phase and the beginning of the downward momentum. As long as the price holds below $3297 - shorts are the priority.

Economic Red Alert: China Dumps $8.2T in US BondsThe Great Unwinding: How a World of Excess Supply and Fading Demand Is Fueling a Crisis of Confidence
The global financial system, long accustomed to the steady hum of predictable economic cycles, is now being jolted by a dissonant chord. It is the sound of a fundamental paradigm shift, a tectonic realignment where the twin forces of overwhelming supply and evaporating demand are grinding against each other, creating fissures in the very bedrock of the world economy. This is not a distant, theoretical threat; its tremors are being felt in real-time. The most recent and dramatic of these tremors was a stark, headline-grabbing move from Beijing: China’s abrupt sale of $8.2 trillion in U.S. Treasuries, a move that coincided with and exacerbated a precipitous decline in the U.S. dollar. While the sale itself is a single data point, it is far more than a routine portfolio adjustment. It is a symptom of a deeper malaise and a powerful accelerant for a crisis of confidence that is spreading through the arteries of global finance. The era of easy growth and limitless demand is over. We have entered the Great Unwinding, a period where the cracks from years of excess are beginning to show, and the consequences will be felt broadly, from sovereign balance sheets to household budgets.
To understand the gravity of the current moment, one must first diagnose the core imbalance plaguing the global economy. It is a classic, almost textbook, economic problem scaled to an unprecedented global level: a glut of supply crashing against a wall of weakening demand. This imbalance was born from the chaotic response to the COVID-19 pandemic. In 2020 and 2021, as governments unleashed trillions in fiscal stimulus and central banks flooded the system with liquidity, a massive demand signal was sent through the global supply chain. Consumers, flush with cash and stuck at home, ordered goods at a voracious pace. Companies, believing this trend was the new normal, ramped up production, chartered their own ships, and built up massive inventories of everything from semiconductors and furniture to automobiles and apparel. The prevailing logic was that demand was insatiable and the primary challenge was overcoming supply-side bottlenecks.
Now, the bullwhip has cracked back with a vengeance. The stimulus has faded, and the landscape has been radically altered by the most aggressive coordinated monetary tightening in modern history. Central banks, led by the U.S. Federal Reserve, hiked interest rates at a blistering pace to combat the very inflation their earlier policies had helped fuel. The effect has been a chilling of economic activity across the board. Demand, once thought to be boundless, has fallen off a cliff. Households, their pandemic-era savings depleted and their purchasing power eroded by stubborn inflation, are now contending with cripplingly high interest rates. The cost of financing a home, a car, or even a credit card balance has soared, forcing a dramatic retrenchment in consumer spending. Businesses, facing the same high borrowing costs, are shelving expansion plans, cutting capital expenditures, and desperately trying to offload the mountains of inventory they accumulated just a year or two prior.
This has created a world of profound excess. Warehouses are overflowing. Shipping rates have collapsed from their pandemic peaks. Companies that were once scrambling for microchips are now announcing production cuts due to a glut. This oversupply is deflationary in nature, putting immense downward pressure on corporate profit margins. Businesses are caught in a vise: their costs remain elevated due to sticky wage inflation and higher energy prices, while their ability to pass on these costs is vanishing as consumer demand evaporates. This is the breeding ground for the "cracks" that are now becoming visible. The first casualties are the so-called "zombie companies"—firms that were only able to survive in a zero-interest-rate environment by constantly refinancing their debt. With borrowing costs now prohibitively high, they are facing a wave of defaults. The commercial real estate sector, already hollowed out by the work-from-home trend, is buckling under the weight of maturing loans that cannot be refinanced on favorable terms. Regional banks, laden with low-yielding, long-duration bonds and exposed to failing commercial property loans, are showing signs of systemic stress. The cracks are not isolated; they are interconnected, threatening a chain reaction of deleveraging and asset fire sales.
It is against this precarious backdrop of a weakening U.S. economy and a global supply glut that China’s sale of U.S. Treasuries must be interpreted. The move is not occurring in a vacuum. It is a calculated action within a deeply fragile geopolitical and economic context, and it carries multiple, overlapping meanings. On one level, it is a clear continuation of China’s long-term strategic objective of de-dollarization. For years, Beijing has been wary of its deep financial entanglement with its primary geopolitical rival. The freezing of Russia’s foreign currency reserves following the invasion of Ukraine served as a stark wake-up call, demonstrating how the dollar-centric financial system could be weaponized. By gradually reducing its holdings of U.S. debt, China seeks to insulate itself from potential U.S. sanctions and chip away at the dollar's status as the world's undisputed reserve currency. This $8.2 trillion sale is another deliberate step on that long march.
However, there are more immediate and tactical motivations at play. China is grappling with its own severe economic crisis. The nation is battling deflation, a collapsing property sector, and record-high youth unemployment. In this environment, its primary objective is to stabilize its own currency, the Yuan, which has been under intense downward pressure. A key strategy for achieving this is to intervene in currency markets. Paradoxically, this intervention often requires selling U.S. Treasuries. The process involves the People's Bank of China selling its Treasury holdings to obtain U.S. dollars, and then selling those dollars in the open market to buy up Yuan, thereby supporting its value. So, while the headline reads as an attack on U.S. assets, it is also a sign of China's own domestic weakness—a desperate measure to defend its own financial stability by using its vast reserves.
Regardless of the primary motivation—be it strategic de-dollarization or tactical currency management—the timing and impact of the sale are profoundly significant. It comes at a moment of peak vulnerability for the U.S. dollar and the Treasury market. The dollar has been extending massive losses not because of China’s actions alone, but because the underlying fundamentals of the U.S. economy are deteriorating. Markets are increasingly pricing in a pivot from the Federal Reserve, anticipating that the "cracks" in the economy will force it to end its tightening cycle and begin cutting interest rates sooner rather than later. This expectation of lower future yields makes the dollar less attractive to foreign investors, causing it to weaken against other major currencies.
China’s sale acts as a powerful accelerant to this trend. The U.S. Treasury market is supposed to be the deepest, most liquid, and safest financial market in the world. It is the bedrock upon which the entire global financial system is built. When a major creditor like China becomes a conspicuous seller, it sends a powerful signal. It introduces a new source of supply into a market that is already struggling to absorb the massive amount of debt being issued by the U.S. government to fund its budget deficits. This creates a dangerous feedback loop. More supply of Treasuries puts downward pressure on their prices, which in turn pushes up their yields. Higher Treasury yields translate directly into higher borrowing costs for the entire U.S. economy, further squeezing households and businesses, deepening the economic slowdown, and increasing the pressure on the Fed to cut rates, which in turn further weakens the dollar. China’s action, therefore, pours fuel on the fire, eroding confidence in the very asset that is meant to be the ultimate safe haven.
The contagion from this dynamic—a weakening U.S. economy, a falling dollar, and an unstable Treasury market—will not be contained within American borders. The cracks will spread globally, creating a volatile and unpredictable environment for all nations. For emerging markets, the situation is a double-edged sword. A weaker dollar is traditionally a tailwind for these economies, as it reduces the burden of their dollar-denominated debts. However, this benefit is likely to be completely overshadowed by the collapse in global demand. As the U.S. and other major economies slow down, their demand for raw materials, manufactured goods, and services from the developing world will plummet, devastating the export-driven models of many emerging nations. They will find themselves caught between lower debt servicing costs and a collapse in their primary source of income.
For other developed economies like Europe and Japan, the consequences are more straightforwardly negative. A rapidly falling dollar means a rapidly rising Euro and Yen. This makes their exports more expensive and less competitive on the global market, acting as a significant drag on their own already fragile economies. The European Central Bank and the Bank of Japan will find themselves in an impossible position. If they cut interest rates to weaken their currencies and support their exporters, they risk re-igniting inflation. If they hold rates firm, they risk allowing their currencies to appreciate to levels that could push their economies into a deep recession. This currency turmoil, originating from the weakness in the U.S., effectively exports America’s economic problems to the rest of the world.
Furthermore, the instability in the U.S. Treasury market has profound implications for every financial institution on the planet. Central banks, commercial banks, pension funds, and insurance companies all hold U.S. Treasuries as their primary reserve asset. The assumption has always been that this asset is risk-free and its value is stable. The recent volatility and the high-profile selling by a major state actor challenge this core assumption. This forces a global repricing of risk. If the "risk-free" asset is no longer truly risk-free, then the premium required to hold any other, riskier asset—from corporate bonds to equities—must increase. This leads to a tightening of financial conditions globally, starving the world economy of credit and investment at the precise moment it is most needed.
In conclusion, the abrupt sale of $8.2 trillion in U.S. Treasuries by China is far more than a fleeting headline. It is a critical data point that illuminates the precarious state of the global economy. It is a manifestation of the Great Unwinding, a painful transition away from an era of limitless, debt-fueled demand and toward a new reality defined by excess supply, faltering consumption, and escalating geopolitical friction. The underlying cause of this instability is the deep imbalance created by years of policy missteps, which have left the world with a glut of goods and a mountain of debt. The weakening U.S. economy and the resulting slide in the dollar are the natural consequences of this imbalance. China’s actions serve as both a symptom of this weakness and a catalyst for a deeper crisis of confidence in the U.S.-centric financial system. The cracks are no longer hypothetical; they are appearing in the banking sector, in corporate credit markets, and now in the bedrock of the system itself—the U.S. Treasury market. The tremors from this shift will be felt broadly, ushering in a period of heightened volatility, economic pain, and a fundamental reordering of the global financial landscape.

"CHINA50 Money Heist: Will You Join the Gang or Get Robbed?"🚨 CHINA50 HEIST ALERT: Bullish Loot & Trap Escape Plan! 🚨
🌟 Hi! Hola! Ola! Bonjour! Hallo! Marhaba! 🌟
Dear Money Makers & Market Robbers, 🤑💰💸✈️
Based on 🔥Thief Trading Style🔥 (technical + fundamental analysis), we’re plotting the ultimate heist on the CHINA50 Index Cash market! Our master plan focuses on a long entry—targeting the high-risk Red Zone (overbought, consolidation, potential reversal). Beware: Bears are lurking, and traps are set! 🏆💸 Book profits fast, stay wealthy, and trade safe! 💪🎉
🔓 ENTRY: The Vault Is Open – Swipe the Bullish Loot!
Buy Limit Orders: Place within 15-30min (recent swing low/high).
Alert Recommended! Don’t miss the heist.
🛑 STOP LOSS: Escape Route
Set near the latest swing low or below 4H MA (~13150.00).
Adjust based on risk, lot size, and multiple orders.
🎯 TARGET: 13840.00 (or Run Before It Hits!)
Scalpers: Only long-side plays! Use trailing SL to lock profits.
Swing Traders: Execute the robbery plan patiently.
📡 MARKET INTEL: Why CHINA50 is a Bullish Target
Fundamental Drivers: Macro trends, COT data, geopolitics, sentiment.
Intermarket & Index-Specific Factors in play.
👉 For full analysis, check the linkss below! 🔗🔗
⚠️ TRADING ALERTS: News & Position Safety
Avoid new trades during high-impact news.
Trailing SL is a MUST to protect profits.
💥 BOOST THE HEIST! Hit Like & Follow!
Support the plan → More profits → Easier robberies! 💰🚀
Stay tuned for the next heist! 🤑🐱👤🤩