CL and XLE divergence - 11/25/2022Why is there a divergence between CL and XLE?
XLE usually leads first. So does that mean CL going to catch back up after SPR depletes? Bullish on CL?
Cl!

crude oil : doble bottom pattern, going to 86.00oil if dont break low,has poweful buy now ,so we advice buy it now but put SL in low,,,if low break downtrend can start
note: trade oil need minimum 5 year practice on demo , it is very complex and trendy market
good luck

Crude Oil is BearishNYMEX:CL1!
Crude Oil futures marked on the 4h chart
After being neutral the past week due to ranging behavior, CL has just possibly shown its hand on where it is headed to in the short term.
Confluences
Overall bearish order flow since the summer.
Liquidity grab at the double top (marked with the X line).
Market Structure Shift (MSS) by breaking the short term low at ~87.60.
Retraced into 4h imbalance and rejected it, thus showing it is respecting a premium price and now seeking a discount.
In premium of September 26 - October 9 dealing range as shown by the fibonacci.
Looks like bread-and-butter sell model in the making.
Current signs show oil is intending to go lower. I am anticipating at least 81.30 as a target level because there is a liquidity void resting below it.

CL Daily up TrendThe CL daily time frame broke the short term
down trend line and has entered into the buy
zone. The market has an up Fibonacci with an
extension price point 104.39 about +1,909 ticks
above the market. As long as the market stays
in the buy zone above the short term down trend
line. It will be a good idea to turn to the one
hour time frame and to look for low prices in the
buy zone.

Financial Wave. CLAs long as the price of CL is above $84, the possibility of growth to $91 remains, this is a preferable scenario in this case.
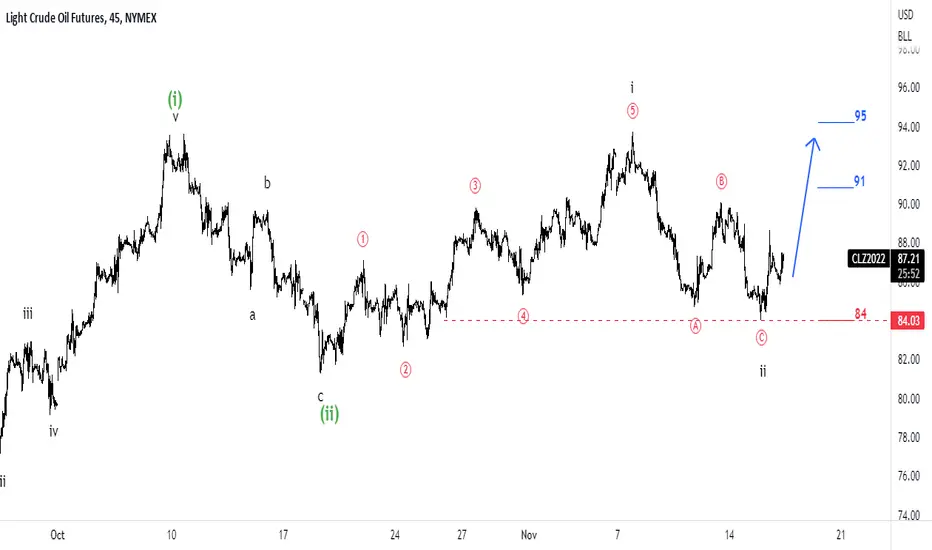
Elliott Wave View: Oil (CL) Has Started New Leg HigherShort term Elliott Wave view in Oil suggests the rally from 9.26.2022 low is unfolding as a 5 waves diagonal. Up from 9.26.2022 low, wave (1) ended at 93.64 and pullback in wave (2) ended at 82.11. The rally then resumes and Oil has broken above wave (1) peak suggesting the next leg higher has started. It also shows a bullish sequence from 9.26.2022 low, favoring further upside.
Wave (3) higher ended at 93.74 with internal subdivision as 5 waves impulse Elliott Wave structure. Up from wave (2), wave 1 ended at 90.36 and pullback in wave 2 ended at 87.60. Wave 3 higher ended at 92.87, and pullback in wave 4 ended at 90.40. Final leg higher wave 5 ended at 93.74 and this also completed wave (3) in higher degree. Wave (4) pullback is now in progress to correct cycle from 10.18.2022 low before the rally resumes. Near term, as far as 10.18.2022 pivot at 82.11 stays intact, expect dips to find support in 3, 7, or 11 swing for more upside. Potential target higher is 100% – 161.8% Fibonacci extension from 9.26.2022 low which comes at 99.7 – 110.5.

Because of the break of area x and the decline of the macdi indiBecause of the break of area x and the decline of the macdi indicator, it is possible for the price to reach area 1 and then it can continue its way towards area 2

Fed may destroy Oil Demand - Stay CautiousAs soon as the US Fed shifted into rate increases - traders should have suddenly elevated their protection tactics.
The Fed's objective is to beat inflation and remove the easy money mentality. In order to do that, they may have to break consumers, industry, global economics, and the general demand cycle for cars, homes, credit/debt, and more.
What happens when the Fed raises rates to a point where the global economy comes to a crashing halt? Consumers react by pausing or stalling travel/spending plans - creating demand destruction for Oil, Lumber, and other commodities.
In my opinion, it is just a matter of time before Crude Oil collapses downward, headed into a typical seasonal cycle (winter). I believe we may be entering a period of very dangerous demand destruction as the US Fed may have pushed rates too high (again).
Stock up. Things could get really WONKY.
Follow my research.

Crude OIL Weekly Volatility Forecast 31/10 - 04/11 2022 Crude OIL Weekly Volatility Forecast 31/10 - 04/11 2022
Currently the volatility for this week is around 6.5% , up from expected 5.47% last week.
According to ATR calculation, currently the volatility is located around 80th percentile.
Under this circumstances the expected movement of the candle is :
BEAR : 5% from the opening point of the weekly candle
BULL : 4.75% from the opening point of the weekly candle
At the same time, currently there is 15.6% that the movement within this weekly candle is going to
break and close either above or below the next channel:
TOP: 93
BOT: 83.5
Lastly, taking into account the previous weekly high and low there is a :
70% chance that we are going to touch the previous week high
30% chance that we are going to touch the previous week low

ATTENTION ! Free insightATTENTION! We have a solid opportunity to buy silver, accumulate it, and make millions.

oil quick analyses my analyses indicate that the market in bullish phase for now but the market will keep pushing in the main trendline wich is bearish so In short, the market is in a bullish corrective phase, but I do not recommend buying because it will be the opposite of the main trend wich is bearish well wait untill we have sign to sell wait for upgrade

DAY TRADE Market ConditionDay Trade Market Condition, Jesse Livemore "There is only one side to stock market; and it is not the bull side or the bear side, but the right side" :
NQ, ES, CL, BTC (a day trader on NQ, markets I pay attention with);
Market Condition show on a table of each chart
Rally, long position offers higher success
SHOPzone, price fluctuate randomly between Supply/Demand levels (traders get burden mostly, day trading)
Drop, short position offers higher success
BULL, up trend for the week
Cumulating , keep eyes on left column (the first top 3 above)
BULL, down trend for the week
Top down approach for day trade, quoted from Jesse Livemore, "I must buy on a rising scale. I don't buy long stocks on a scale down I buy on a scale up."

Is Crude going to fall below $69 over before the end of 2022?You tell me? My analysis is that Asia/Europe will contract demand as high Natural Gas and other economic constraints pull purse strings throughout the Christmas Holidays/Winter.
If this happens, we may see a demand destruction cycle take place in Oil that could be 40~50% of the demand destruction that took place when COVID hit.
The new strains of COVID are already making news and any pump in infections throughout Asia/EU/Africa may send 65% of the world into LOCKDOWNS again.
Don't get too bullish as it appears Crude is attempting to settle below $69 ppb.
FYI.
Follow my research.

Looking for Long Idea on CL The CL daily time frame is near a low price
hitting the long term up trend line. If support
holds. It is expected the market will push bullish
above the short term down trend line entering
into the buy zone. Once or if the market breaks
and closes above the short term down trend line
and enters into the buy zone. I twill be a good idea
to apply up Fibonacci to find the next bullish
Fibonacci price target then turn to the one hour
time frame to look for low prices in the buy
zone. Until then. It is better to be out of the
market wishing to be in than to be in the
market wishing to be out.

Long opportunity for CL Long opportunity for CL
Entry : 77.85
SL : 76.12
TP1 : 86.58
TP2 : 89.75
TP3 : 93.86
If You Like My Idea Support me With Like :)

CL or UCO Oil Idea Oil going up. this is only the beginning. prepare yourselves. SPR drains stop after the November mid term elections. not a lot left in it anyways. production cuts, combined with a global energy crunch from a Green transition coming too early before viable technology. Great reset agenda. confluence of bullish ideas. DXY not cooling off until 118. Oil was only down so far to price in the recession. so many factors. 12-18 months of bull market coming for all commodities, still imo. not financial advice

cl1! long nowThis market is witnessing an unusual movement and the possibility of a rise is very high
My advice is to buy

LIGHT CRUDE OIL FUTURES longNYMEX:CL1!
This market is witnessing an unusual movement and the possibility of a rise is very high
My advice is to buy

LIGHT CRUDE OIL FUTURES longThis market is witnessing an unusual movement and the possibility of a rise is very high
My advice is to buy

WTI Crude / CL - An Intervention: Saving Blind BullsWhen crude was trading at $120 a few months ago, all you would hear on Twitter from people like Javier Blas from Bloomberg and other propaganda pundits is about how the fundamentals of oil are so bullish, because OPEC production is maxed out, the Russian Federation's invasion of Ukraine, domestic demand because summer, the government donating the strategic reserves to Chinese Communist Party firms on the cheap , etc, etc.
There was all that chatter about Europe putting a price cap on Russian oil, and that causing the price to surge overnight to $350 in some kind of dystopian nightmare.
At the time, everyone wanted to get long. Everyone would only get long. I remember one day in July oil returned to $91 on like a 10% daily drop and one Twitter pundit thanked the market makers for their "delta squeezing put options" before expiry and that he was happy that he got to buy calls that cheap because it was never going to happen again.
This is the way bull runs are. They tend to end when the narrative flips entirely to "who would ever short this?!"
And that ending is easier for bulls when something gaps down and breaks the momentum than it is with the price pattern being employed by the WTI MMs where everything all the way up and all the way down is trading in an efficient pattern that seeks-and-destroys both ways on the shorter timeframe.
In terms of specific price action, as I pointed out in my early August call that oil was on its way to far lower double digit numbers:
WTI Crude Oil - Running and Gunning
That the August price action with a quiet sweep of the July ~$86 lows, followed by a bounce, followed by a quadruple bottom, was simply too naive to think would be support.
Now, we're at $81, and it once again sounds like a dip to buy. And while we're probably going to see a run back to $86~, this market is no longer in a dip to buy position.
A lot of things make sense when you look at the monthly:
All of this price action we just experienced in early 2021 was, ultimately, a clean up of the unfinished business from the 2008 bubble pop, which was never addressed during the 2010-2014 ranging.
And really, after oil hit... -$38 during Coronavirus Disease 2019 hysteria, you really have to call that the bottom.
If you can't call -$38 the bottom, what would a bottom ever be?
Now, for those who guffaw at the prospect of oil going back to $50, this is totally fair enough. As always, it sounds impossible, until it unfolds. Humans are only able to believe in what they see. Having even a modicum of faith is a real stretch for almost everyone.
But I would like to point out that there is a precedental fractal left behind in the run up to the 2008 bubble pop, which you can see on the left hand side of the monthly chart above.
Oil more or less traded in a miniature of this exact same 2022 pattern. When it broke its pivots before finally rocketing to $140, it amounted to a total 35% $28 downturn, which was an enormous number in those trading ranges.
Everything is highly inflated and much more volatile and interesting today.
The weekly chart shows just how dangerous the situation is for bulls.
The reality is, the only inefficiency during this current market structure is in this $81 range, which we are sitting in. It's not showing a lot of interest in bouncing, and it would have to get back into the $100s to really count as a reversal.
So if $80 isn't the target to make a bottom at, what is?
Well, looking at the daily we can see more clearly that there's something of a plan B in the $69 range that can count as maintaining market structure if a reversal occurs within it.
And there's also a chance to maintain the trendline at $66.
But in reality, there's a fat double bottom to blow away formed from the September and December 2021 lows.
And based on the weekly, there are inefficiencies left behind that were never readdressed at the unfortunate numbers around $50, and specifically right under the psychological $50 level.
In my opinion, before oil turns around and rips North to levels that will make living in this world nearly impossible for everyone who isn't a billionaire, the MMs will seek and destroy these levels. And they may stop being so polite about it.
It may start to come faster and faster.
At some point in the near term future, dumps may come with a quick and significant gap down, and this time, they won't fill.
Pundits, analysts, and all sorts of charlatans will all be stunned and bewildered by how it could happen under the macro conditions. And then they will all say "oh, of course, look at these data points. It was only natural that $120 was an inflated number."
The answer, they will say, is undoubtedly "something something mainland China 'Zero-COVID' economic demand," not understanding the real state of disaster being wrought in that country as Wuhan Pneumonia goes on a tear and the Chinese Communist Party is starting to be unable to cover it up for much longer.
But $125~ was not a top for WTI crude, and neither was $140. A much more painful number like $180 or $200 is coming, and it's not going to take years to get there.
I believe that natural gas, likewise, has a lot of downside left to go:
Natural Gas / NG - What, Truly, Is a Bull?
A lot of things are probably going to bounce for a bit longer and then start to very aggressively dump. You should be prepared for this.
Stop listening to talking heads, propaganda, and charlatans, and be rational. None of them want to help you survive financially and none of them want you to be rich. Most of them don't even trade. Trading is hard. Everyone who has ever traded with live funds knows how hard it is to get in at the right time, in the right direction, and hold through all the chaos and pain until something bears fruit.
Fronting and flexing on the Internet to a flock of 50 Cent Party bots and collecting a 6 figure salary from Bloomberg or a 6 figure donation from YouTube's profit sharing program, on the other hand, is just so, so easy.
Talk is cheap, and yet, mastery is not.
Rationality is, ultimately, linked to your level of morality and your values.

WTI Is Heading To Multi Year Low (Supported by OPEC report)It's no surprise that the oil market is as volatile as ever, following the ongoing trade war saga between the US and China. Yesterday, OPEC has released their report on future outlook of the market demand for the rest of 2019, which is BEARISH. They are helpless as demands are dropping, and the US shale supplier keep on continuing to pressure the price with flooding of supplies. On the other hand, the election of US is on the year 2020, which means that Trump would want to keep the prices low to keep his key voters happy, primarily the oil consumer. As long as the price of WTI is above 30$, the shale oil provider are still in the profitable range. We have seen the 22$ price during early 2016, Trump won the election and the price rally until peak multi year high of 78$. Which means, the current wave is expected to complete at the range of 20-30$, thus making way for the epic rally to 116$ !
Link to the OPEC report
www.reuters.com


Crude Oil Long İdea I expect a short-term recovery in oil. I hope it will be a profitable trade. Good luck.
