The Power of One Setup: Variety Kills ConsistencyMost traders chase new strategies, indicators, and secret signals. Progress rarely comes from adding more. It comes from mastering one thing deeply.
The fastest path to consistency is one setup traded a thousand times, until execution becomes automatic.
Every setup has a rhythm. Market conditions, timing, management. When you rotate through styles, you reset the learning curve repeatedly.
Specialization compresses uncertainty. You see the same context, the same triggers, the same mistakes, which tightens execution and accelerates feedback.
Switching setups leads to inconsistent entries, inconsistent risk, and mixed data. You cannot tell what actually works because the sample is polluted.
Professionals remove variables. They keep the market changing while the method stays constant.
Turn the setup into a rulebook.
• Market conditions: trend, range, volatility threshold, session.
• Structure: levels, pattern shape, invalidation logic.
• Entry: trigger candle, confirmation, timing window.
• Risk: stop location, size per trade, max daily loss.
• Management: partials, move to break even, trail or fixed target.
Mastery does not come from more information. It comes from repetition and refinement.
You do not need more strategies. You need fewer distractions.
Contains image

The Control Trap“I just need to manage this better.”
That thought sounds logical.
But often it’s emotional.
Follow along. I hope this helps.
BUT FIRST
NOTE – This is a post on mindset and emotion. It’s not a trade idea or system designed to make you money.
My intention is to help you preserve your capital, focus and composure - so you can trade your own system with calm and confidence.
HERE’S WHAT HAPPENS
The market moves.
You feel tension rise.
Something inside wants to do something.
Tighten stops. Add size. Cut early.
Anything that restores a sense of control.
But here’s the paradox
The more you try to control the market,
the less control you feel inside.
Because control isn’t what your nervous system needs.
It’s safety.
When uncertainty hits, your body doesn’t ask for clarity - it asks for protection.
And if you’ve ever felt powerless before,
that sensation gets triggered fast.
WHY IT MATTERS
Over-managing trades isn’t just about perfectionism.
It’s about calming an inner alarm.
Every click becomes an attempt to soothe discomfort.
But in doing so, you feed the very cycle you’re trying to escape.
THE SHIFT
You don’t need to control the market.
You need to regulate your state.
Before you adjust the trade, check in with yourself.
What are you really trying to control right now - the outcome, or your emotion?
The answer will tell you where your real work is.

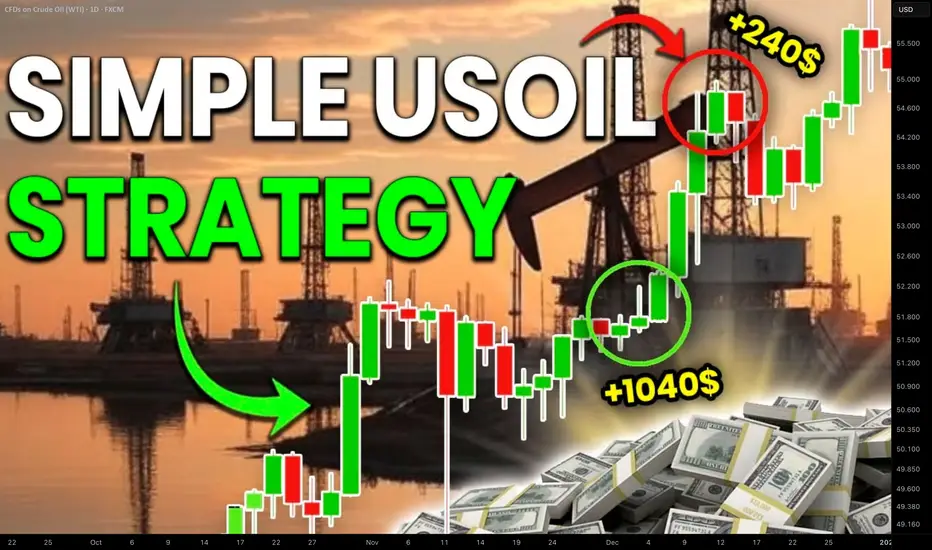
How to Trade Crude Oil with Smart Money Concepts SMC Explained
Smart Money Concepts is one of the most reliable techniques for trading WTI Crude Oil.
In this article, I will teach you a profitable SMC strategy for analysing and trading USOIL futures and CFD.
This simple strategy is based on an important event every SMC trader should know - a break of structure BoS.
In a bullish trend, the best break of structure will be based on a violation and a candle close above a current higher high.
It will signify a highly probable bullish continuation and provides a great opportunity to buy
Though you can spot a bullish break of structure on any time frame, the most reliable one is a daily.
After a formation of a new high, I suggest waiting for a short term intraday correctional movement.
With a high probability, the market will retest a recently broken structure and smart money will manipulate the market, pushing the price below that, making buyers close their positions.
Once the market starts retracing, analyze an hourly time frame. The price will need to establish an i ntraday minor bearish trend.
In this bearish trend, 2 trend lines should connect lower highs and lower lows composing an expanding, parallel or contracting channel - a bullish flag pattern.
Your best signal will be a breakout of a resistance line of the flag and a violation of the level of the last lower high - a bullish change of character of a liquidity grab.
It will confirm a completion of a correction.
Buy the market on a retest of the level of the last higher low, it will be your best entry.
Set your stop loss at least below a trend line and aim at the next strong daily resistance.
That will be a perfect model for trading break of structure on WTI Crude Oil.
We spotted such a setup in my trading academy on one of the live streams with my students.
WTI Crude Oil was trading in an uptrend on a daily time frame.
A bullish violation of the last Higher High and a candle close above that confirmed a Break of Structure BoS.
The price started a correctional movement then, and we spotted a bullish flag pattern on an hourly time frame.
The market completed a correction after grabbing a liquidity below a broken structure.
A bullish movement started then, and the price violated a resistance line of the flag and the level of the last lower high.
These 2 breakouts confirmed a completion of a correction and a resumption of a bullish trend.
We opened a buy position immediately on a retest of a broken level of the last lower high.
Stop loss was below a trend line, take profit was based on the closest key daily resistance.
And the price went straight to the target.
Break of Structure BoS will be useful for analysis, forecasting and trading WTI Crude Oil.
Combining that with top-down analysis and lower time frames confirmations will provide accurate signals and profitable trading setups.
Integrate a price model that I shared in your strategy, and good luck to you trading USOIL!
❤️Please, support my work with like, thank you!❤️
I am part of Trade Nation's Influencer program and receive a monthly fee for using their TradingView charts in my analysis.
Agencies’ Impact on Finance in the World Market1. Role of Financial Agencies in the Global Market
Financial agencies are entities that oversee, regulate, or evaluate economic and financial activities at both national and international levels. Their main functions include:
Maintaining financial stability by monitoring market trends and risks.
Providing credibility and transparency through accurate data, ratings, and analyses.
Ensuring fair practices in banking, trade, and investment.
Supporting economic growth by setting monetary policies or funding development projects.
These agencies can be categorized into several types:
Regulatory Agencies – such as the U.S. Securities and Exchange Commission (SEC) or the Reserve Bank of India (RBI), which supervise markets and institutions.
Credit Rating Agencies – such as Moody’s, Standard & Poor’s (S&P), and Fitch Ratings, which assess the creditworthiness of governments and corporations.
International Financial Institutions (IFIs) – like the International Monetary Fund (IMF) and World Bank, which provide financial aid, policy advice, and stability mechanisms.
Development Agencies – such as the United Nations Development Programme (UNDP) or regional development banks, which focus on sustainable growth.
Central Banks and Monetary Authorities – which control monetary policy, interest rates, and currency stability.
Each plays a different yet interconnected role in the global financial landscape.
2. Regulatory Agencies and Market Stability
Regulatory agencies are fundamental in protecting investors, ensuring transparency, and preventing fraud. For instance, the U.S. SEC enforces rules for publicly traded companies, ensuring accurate disclosure of financial information. Similarly, the Financial Conduct Authority (FCA) in the UK and the Securities and Exchange Board of India (SEBI) in India protect market integrity.
These bodies set frameworks for fair competition, curb insider trading, and reduce systemic risks. In the aftermath of financial crises—such as the 2008 global financial meltdown—regulatory agencies strengthened their role. They imposed tighter capital requirements, stress testing for banks, and improved risk management systems.
By monitoring financial behavior, these agencies boost investor confidence, which is essential for capital inflows and economic stability. Without them, financial systems could easily collapse under the weight of speculation, corruption, and misinformation.
3. Credit Rating Agencies: The Market’s Trust Barometers
Credit rating agencies (CRAs) assess the ability of borrowers—countries, corporations, or institutions—to meet their debt obligations. Ratings like AAA, BBB, or junk status determine how investors perceive risk and decide where to allocate funds.
For example, a downgrade in a country’s credit rating can lead to:
Higher borrowing costs (interest rates).
Capital flight by foreign investors.
A decline in the nation’s currency value.
Conversely, an upgrade signals strong economic performance and attracts investment.
However, CRAs have also been criticized for their role in financial crises. During the 2008 crisis, agencies were accused of assigning overly optimistic ratings to mortgage-backed securities, leading to massive market collapses. Since then, regulatory reforms have been introduced to improve their accountability and transparency.
Despite criticism, credit rating agencies remain indispensable to the global market, as their evaluations guide international investors in making informed decisions.
4. International Financial Institutions (IMF and World Bank)
Two of the most influential agencies in global finance are the International Monetary Fund (IMF) and the World Bank.
The IMF provides short-term financial assistance and policy advice to countries facing balance-of-payments crises. It also monitors exchange rate policies and promotes international monetary cooperation.
The World Bank, on the other hand, focuses on long-term economic development, poverty reduction, and infrastructure projects.
Their programs influence fiscal policies, exchange rate mechanisms, and debt management strategies of many developing countries. For example, during financial distress, the IMF may impose structural adjustment programs, requiring nations to implement austerity measures and economic reforms.
While these policies often stabilize economies in the short term, critics argue that they sometimes lead to social inequality and reduced welfare spending. Nevertheless, IMF and World Bank interventions remain central to maintaining global economic balance, especially in times of crisis.
5. Central Banks and Monetary Authorities
Central banks like the Federal Reserve (U.S.), European Central Bank (ECB), and Reserve Bank of India (RBI) are crucial in shaping financial conditions. Through monetary policy tools such as interest rates, open market operations, and reserve requirements, they regulate liquidity and inflation.
For example:
Lowering interest rates encourages borrowing and investment, stimulating economic growth.
Increasing rates helps control inflation and stabilize the currency.
Their decisions ripple through global markets—affecting everything from stock prices and exchange rates to international trade and commodity prices. The U.S. Federal Reserve’s interest rate hikes often lead to capital outflows from emerging markets, demonstrating the interconnectedness of global finance.
Moreover, central banks act as lenders of last resort, providing liquidity to commercial banks during financial turmoil. Their coordination through global forums such as the Bank for International Settlements (BIS) ensures synchronized policy actions, preventing worldwide recessions.
6. Development and Environmental Agencies
Agencies such as the Asian Development Bank (ADB), African Development Bank (AfDB), and UNDP support inclusive growth by financing infrastructure, energy, and environmental projects. These institutions channel funds into sectors that private investors may overlook but are vital for long-term stability.
In the modern financial ecosystem, sustainability has become a major focus. Agencies now promote green finance, encouraging investments in renewable energy, clean technology, and low-carbon development. Through ESG (Environmental, Social, and Governance) criteria, they influence corporate behavior and attract socially responsible investors.
This transformation highlights how agencies are reshaping finance toward a more ethical and sustainable direction, integrating economic growth with environmental and social well-being.
7. Impact on Global Capital Flows
Agencies influence how money moves across borders. Credit ratings affect the flow of portfolio investments, while IMF policies determine access to international aid. Regulatory frameworks reduce risks in cross-border lending, and development banks attract private partnerships.
By setting global standards—such as Basel III norms for banking regulation—these agencies create a predictable environment for investors. Consistent regulations and transparency enhance capital mobility, while poor governance or unfavorable ratings can restrict access to funding.
Therefore, agencies act as gatekeepers of the global capital system, determining which nations and corporations are trustworthy borrowers and where capital can flow safely.
8. Challenges and Criticisms
Despite their significance, agencies face ongoing challenges:
Bias and political influence – Some institutions are accused of favoring developed nations or certain economic ideologies.
Transparency issues – Rating methodologies and policy decisions are sometimes opaque.
Moral hazard – Overdependence on agencies can reduce accountability among borrowers and investors.
Global inequality – IMF austerity programs and strict conditionalities often burden poorer nations.
To address these issues, reforms are being implemented to increase fairness, improve representation of developing economies, and enhance public trust in global financial governance.
9. The Future of Agencies in the World Market
The global financial system is rapidly evolving with digital currencies, fintech innovations, and decentralized finance (DeFi). Agencies must adapt to these shifts. Future financial regulation will likely include oversight of cryptocurrencies, AI-driven trading, and climate risk disclosures.
Moreover, as geopolitical tensions rise, agencies must remain neutral, ensuring global stability rather than becoming tools of economic dominance. Collaboration between international institutions will be vital to maintaining balance in an increasingly interconnected financial environment.
Conclusion
Agencies are the pillars of the world financial market. They provide the frameworks, credibility, and stability that allow global finance to function efficiently. From regulating banks to rating sovereign debts, from funding development projects to managing crises, their influence extends across every financial sector.
While not free from criticism, their collective role ensures that the global economy remains transparent, accountable, and resilient. In an era of rapid technological and geopolitical change, their mission will continue to evolve—but their impact on the global financial landscape remains irreplaceable.
The Role of the Metals Market in Global Trade1. Historical Background and Evolution of the Metals Market
Metals have played a pivotal role in the evolution of human societies. Ancient civilizations like Egypt, Mesopotamia, and the Indus Valley used copper, bronze, and gold for tools, ornaments, and trade. The discovery of iron marked the beginning of the Iron Age, revolutionizing warfare, agriculture, and construction. As maritime trade expanded during the Renaissance, gold and silver became the foundation of global commerce, with countries competing for control over mineral-rich territories.
The Industrial Revolution in the 18th and 19th centuries marked a turning point. The demand for coal, iron, and later steel surged as nations built railways, ships, and factories. This era established metals as a driving force behind industrial power. In the 20th century, aluminum, copper, and nickel became essential for the automotive, electrical, and aerospace industries. Today, the digital revolution and green transition have added new dimensions to the metals trade, with lithium, cobalt, and rare earth elements at the forefront.
2. Classification of Metals in Global Trade
Metals can broadly be classified into precious metals, base metals, and ferrous metals:
Precious metals such as gold, silver, and platinum are valued for their rarity, monetary use, and investment appeal. They often act as safe-haven assets during economic uncertainty.
Base metals like copper, aluminum, zinc, and nickel are essential industrial inputs used in construction, manufacturing, and electronics.
Ferrous metals, primarily iron and steel, form the backbone of global infrastructure, machinery, and transportation.
Each category plays a distinct role in trade flows and economic development, influencing everything from industrial output to currency stability.
3. Key Players in the Global Metals Market
The global metals trade is dominated by a few major producers and consumers:
China is the largest consumer and producer of most base metals, particularly steel and aluminum. Its rapid industrialization has made it a major influencer of global metal prices.
Australia, Brazil, and Chile are leading exporters of iron ore, copper, and other minerals, contributing significantly to global supply.
The United States, Russia, and Canada play key roles in producing precious metals and industrial metals like nickel and palladium.
Africa, particularly countries like South Africa and the Democratic Republic of Congo (DRC), is rich in gold, platinum, and cobalt resources.
These nations’ trade relationships often reflect their comparative advantages in metal production and processing, forming the foundation for global supply chains.
4. Metals as Strategic and Economic Assets
Metals are not just industrial materials—they are strategic assets that influence national security and economic resilience. Nations stockpile metals like copper, nickel, and rare earth elements to secure industrial supply chains and mitigate geopolitical risks. For example:
Rare earth metals are crucial for producing high-tech devices, defense equipment, and renewable energy systems. China’s dominance in this sector gives it significant geopolitical leverage.
Oil-to-metal transitions, driven by green energy goals, have increased the demand for metals like lithium and cobalt used in electric vehicle (EV) batteries and renewable technologies.
Consequently, control over metal reserves has become a modern form of strategic power, shaping trade alliances and economic policies.
5. Pricing and Market Dynamics
Metal prices are determined by supply-demand fundamentals, economic cycles, and speculative activities. Major commodities exchanges like the London Metal Exchange (LME), Chicago Mercantile Exchange (CME), and Shanghai Futures Exchange (SHFE) facilitate global pricing and hedging.
Factors influencing metal prices include:
Economic growth: Rising industrial activity boosts metal demand and prices.
Technological innovation: New manufacturing technologies alter consumption patterns (e.g., lightweight aluminum replacing steel).
Geopolitical tensions: Trade restrictions or sanctions can disrupt supply chains.
Environmental policies: Carbon regulations and sustainability goals affect mining and production costs.
Investment flows: Metals also serve as speculative assets, influenced by currency strength, inflation, and interest rates.
Thus, metal prices often act as economic indicators, reflecting global industrial health and investor sentiment.
6. The Role of Metals in Industrialization and Infrastructure Development
Metals are indispensable to industrialization. Steel underpins infrastructure — bridges, railways, and skyscrapers — while copper powers electrical networks and communication systems. Aluminum enables lightweight transportation and aerospace manufacturing, and nickel and cobalt are key in renewable energy storage.
Developing economies rely heavily on metal imports to build infrastructure and manufacturing capacity. For instance, India’s expanding urbanization and infrastructure development drive strong demand for iron and aluminum. Conversely, developed economies export technology and capital to resource-rich nations in exchange for raw materials, fostering interdependence in global trade.
7. Environmental and Sustainability Challenges
Mining and metal production are energy-intensive processes that contribute significantly to carbon emissions and ecological degradation. The global push toward sustainability has forced the metals industry to adopt cleaner technologies and recycling practices.
Recycling metals reduces energy consumption by up to 95% compared to primary production.
Circular economy models are being promoted to minimize waste and maximize resource efficiency.
ESG (Environmental, Social, and Governance) frameworks now influence investment in mining and metal companies, driving greener operations.
Additionally, the transition to renewable energy and electric vehicles has paradoxically increased demand for certain metals like lithium and copper, creating new sustainability dilemmas related to mining practices.
8. Trade Policies and Market Regulation
Governments play a crucial role in shaping metal trade through tariffs, export restrictions, and subsidies. For example:
The U.S.–China trade tensions have led to tariffs on aluminum and steel.
Indonesia has imposed export bans on nickel ore to encourage domestic processing.
The European Union’s Carbon Border Adjustment Mechanism (CBAM) aims to penalize imports of carbon-intensive metals, pushing producers toward cleaner production.
These policies influence global trade patterns, encouraging nations to diversify sources and invest in local refining capacities.
9. The Future of the Global Metals Market
The metals market is undergoing a structural transformation. The shift toward green technologies, digitalization, and geopolitical realignments will reshape global demand and supply chains.
Key trends include:
Rising demand for battery metals (lithium, cobalt, nickel) due to electric vehicle growth.
Technological advances in mining, such as automation and AI, enhancing efficiency.
Increased recycling and circular economy initiatives.
Geopolitical competition over strategic metals, especially between the U.S., China, and the EU.
Digital metal trading platforms improving transparency and liquidity.
These developments indicate that the future metals market will be more sustainable, technologically advanced, and geopolitically complex.
10. Conclusion
The metals market remains a cornerstone of global trade, connecting economies through resource flows and industrial demand. Metals shape not only the physical world—through construction, manufacturing, and technology—but also the geopolitical and economic landscape. As nations strive for cleaner growth, technological advancement, and strategic security, metals will continue to hold immense importance. From traditional iron and copper to modern lithium and rare earths, metals are the silent engines driving the global economy forward. Their trade will increasingly define the balance between growth, sustainability, and geopolitical influence in the 21st century.

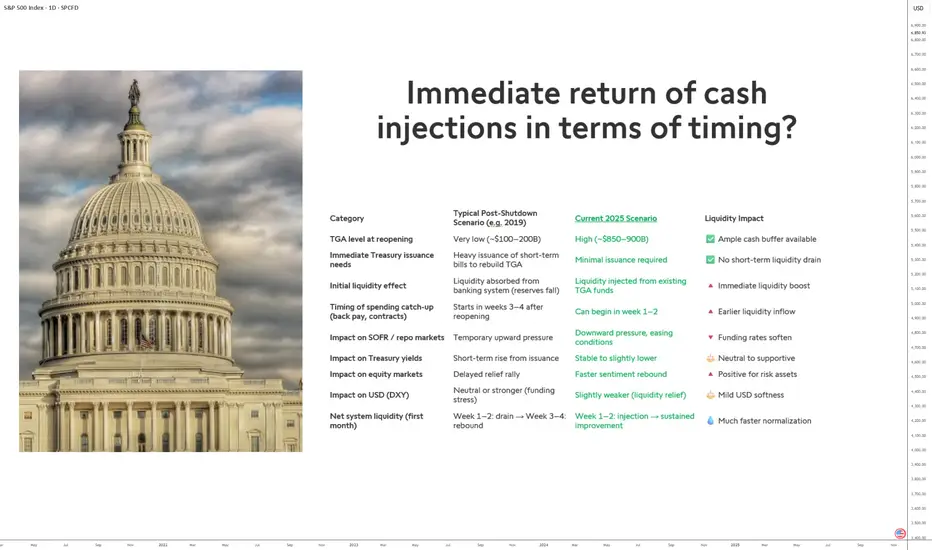
End of the 2025 Shutdown: Immediate Impact on LiquidityThe reopening of the U.S. government at the end of the 2025 shutdown is expected to trigger a swift return of liquidity to financial markets. This recurring phenomenon will have a distinct magnitude this time due to the specific conditions of the U.S. Treasury General Account (TGA) and the current federal funding structure.
1) A fiscal context unlike previous shutdowns
In past episodes, notably in 2019, the U.S. Treasury exited the shutdown with very low cash balances—typically between $100 and $200 billion. To rebuild this buffer, it had to issue large amounts of short-term Treasury bills, which drained liquidity from the banking system as investors used reserves to buy the securities.
In 2025, the situation is reversed. The Treasury holds a high cash balance—estimated between $850 and $900 billion—because the federal government’s account at the Fed (the TGA) was replenished at the end of September. This provides ample room to finance near-term public spending without issuing new debt. The result is an absence of pressure on money markets and stable bank reserves.
2) Liquidity injections from day one
With abundant cash reserves, the Treasury can promptly resume pending payments—federal salaries, public contracts, and suspended programs. These payments act as direct liquidity injections into the financial system, starting within the first weeks following the end of the shutdown.
In previous reopenings, this process began only after three to four weeks. In 2025, it could start as early as week one or two, significantly shortening the normalization timeline for market liquidity.
3) Moderate but positive market effects
This faster liquidity return should lead to:
• unchanged or slightly lower bond yields, given steady demand and the absence of additional issuance;
• a slightly weaker dollar, reflecting easier financing conditions.
Overall, this points to a quicker and more orderly normalization of the monetary system compared to 2019, potentially supporting risk assets in the short term.
DISCLAIMER:
This content is intended for individuals who are familiar with financial markets and instruments and is for information purposes only. The presented idea (including market commentary, market data and observations) is not a work product of any research department of Swissquote or its affiliates. This material is intended to highlight market action and does not constitute investment, legal or tax advice. If you are a retail investor or lack experience in trading complex financial products, it is advisable to seek professional advice from licensed advisor before making any financial decisions.
This content is not intended to manipulate the market or encourage any specific financial behavior.
Swissquote makes no representation or warranty as to the quality, completeness, accuracy, comprehensiveness or non-infringement of such content. The views expressed are those of the consultant and are provided for educational purposes only. Any information provided relating to a product or market should not be construed as recommending an investment strategy or transaction. Past performance is not a guarantee of future results.
Swissquote and its employees and representatives shall in no event be held liable for any damages or losses arising directly or indirectly from decisions made on the basis of this content.
The use of any third-party brands or trademarks is for information only and does not imply endorsement by Swissquote, or that the trademark owner has authorised Swissquote to promote its products or services.
Swissquote is the marketing brand for the activities of Swissquote Bank Ltd (Switzerland) regulated by FINMA, Swissquote Capital Markets Limited regulated by CySEC (Cyprus), Swissquote Bank Europe SA (Luxembourg) regulated by the CSSF, Swissquote Ltd (UK) regulated by the FCA, Swissquote Financial Services (Malta) Ltd regulated by the Malta Financial Services Authority, Swissquote MEA Ltd. (UAE) regulated by the Dubai Financial Services Authority, Swissquote Pte Ltd (Singapore) regulated by the Monetary Authority of Singapore, Swissquote Asia Limited (Hong Kong) licensed by the Hong Kong Securities and Futures Commission (SFC) and Swissquote South Africa (Pty) Ltd supervised by the FSCA.
Products and services of Swissquote are only intended for those permitted to receive them under local law.
All investments carry a degree of risk. The risk of loss in trading or holding financial instruments can be substantial. The value of financial instruments, including but not limited to stocks, bonds, cryptocurrencies, and other assets, can fluctuate both upwards and downwards. There is a significant risk of financial loss when buying, selling, holding, staking, or investing in these instruments. SQBE makes no recommendations regarding any specific investment, transaction, or the use of any particular investment strategy.
CFDs are complex instruments and come with a high risk of losing money rapidly due to leverage. The vast majority of retail client accounts suffer capital losses when trading in CFDs. You should consider whether you understand how CFDs work and whether you can afford to take the high risk of losing your money.
Digital Assets are unregulated in most countries and consumer protection rules may not apply. As highly volatile speculative investments, Digital Assets are not suitable for investors without a high-risk tolerance. Make sure you understand each Digital Asset before you trade.
Cryptocurrencies are not considered legal tender in some jurisdictions and are subject to regulatory uncertainties.
The use of Internet-based systems can involve high risks, including, but not limited to, fraud, cyber-attacks, network and communication failures, as well as identity theft and phishing attacks related to crypto-assets.
Pharma Stocks in the World Market1. Overview of the Global Pharmaceutical Industry
The global pharmaceutical market is vast and dynamic, valued at over $1.5 trillion as of the mid-2020s. It encompasses traditional drug manufacturers, biotechnology firms, and healthcare innovators. The industry’s growth is driven by several long-term trends such as population aging, chronic disease prevalence, technological innovation, and rising healthcare spending in both developed and emerging economies.
Pharmaceutical companies can broadly be divided into two categories:
Innovator or Research-Based Companies: These firms invest heavily in research and development (R&D) to create new drugs. Examples include Pfizer, Merck, Johnson & Johnson, Roche, Novartis, AstraZeneca, and Eli Lilly.
Generic Drug Manufacturers: These companies produce lower-cost versions of branded drugs after patents expire. Examples include Teva Pharmaceutical, Sun Pharma, Dr. Reddy’s Laboratories, and Cipla.
Both segments are essential to global healthcare, but their business models and profit margins differ significantly.
2. Factors Driving the Growth of Pharma Stocks
a. Aging Population and Chronic Diseases:
As populations age, particularly in developed nations, the prevalence of chronic diseases such as diabetes, cancer, and cardiovascular disorders rises sharply. This creates a steady and long-term demand for pharmaceuticals, making the sector relatively resilient to economic downturns.
b. Technological Advancements:
Innovations in biotechnology, genomics, and artificial intelligence have transformed drug discovery and personalized medicine. New treatments such as gene therapies, immunotherapies, and mRNA vaccines have expanded the scope of healthcare and boosted investor confidence in the sector.
c. Rising Global Healthcare Expenditure:
Governments and private sectors worldwide are increasing their spending on healthcare infrastructure and medication access. Emerging markets such as India, China, and Brazil are witnessing rapid pharmaceutical market expansion due to improving income levels and healthcare awareness.
d. Regulatory Support and Fast-Track Approvals:
Regulatory bodies like the U.S. Food and Drug Administration (FDA) and the European Medicines Agency (EMA) have adopted fast-track processes for breakthrough drugs and pandemic-related treatments. These initiatives accelerate innovation and market entry for critical therapies.
e. Pandemic Influence:
The COVID-19 pandemic profoundly impacted global pharma stocks, showcasing the industry’s vital role. Companies like Pfizer, Moderna, and AstraZeneca gained global prominence for developing vaccines, resulting in unprecedented revenue growth and investor interest.
3. Key Players in the Global Pharma Market
Several multinational corporations dominate the pharmaceutical sector:
Pfizer Inc. (U.S.) – Known for its vaccine leadership and a diversified portfolio across cardiovascular, oncology, and rare diseases.
Johnson & Johnson (U.S.) – A healthcare conglomerate engaged in pharmaceuticals, medical devices, and consumer health products.
Roche Holding (Switzerland) – A leader in oncology and diagnostics, with a focus on precision medicine.
Novartis (Switzerland) – Known for its strong research orientation and biologics pipeline.
AstraZeneca (U.K.) – A major player in oncology and respiratory drugs with a rapidly expanding vaccine business.
Eli Lilly (U.S.) – Recently recognized for its breakthroughs in diabetes and obesity treatments.
Sanofi (France) – A key European player in vaccines and specialty care.
Gilead Sciences (U.S.) – Specializes in antiviral drugs for HIV, hepatitis, and COVID-19.
Bristol Myers Squibb (U.S.) – Known for its innovative cancer immunotherapy products.
GlaxoSmithKline (U.K.) – Focused on vaccines, respiratory, and infectious disease segments.
These companies collectively account for a large share of global pharma revenues and are heavily represented in major stock indices like the S&P 500 Healthcare Index and the MSCI World Health Care Index.
4. Market Trends and Developments
a. Biotechnology and mRNA Revolution:
The success of mRNA vaccines during the COVID-19 pandemic opened new possibilities for treatments against cancers, genetic disorders, and autoimmune diseases. Biotech firms such as Moderna and BioNTech are now among the most-watched stocks globally.
b. Mergers and Acquisitions (M&A):
Consolidation is a key strategy in the pharma sector. Large companies frequently acquire smaller biotech firms to strengthen their drug pipelines and reduce research risks. Examples include Pfizer’s acquisition of Seagen and Amgen’s acquisition of Horizon Therapeutics.
c. Digital Health and AI Integration:
Artificial intelligence is revolutionizing drug discovery, clinical trials, and patient monitoring. Companies integrating AI in R&D—such as Roche and Novartis—are expected to gain a competitive edge.
d. Focus on Rare Diseases:
Pharma firms are increasingly investing in treatments for rare or “orphan” diseases, which often enjoy premium pricing and extended patent protections.
e. Sustainability and ESG Practices:
Investors are emphasizing environmental, social, and governance (ESG) standards. Pharmaceutical firms are being evaluated not only for profits but also for ethical practices, drug pricing transparency, and environmental impact.
5. Risks and Challenges
Despite strong growth potential, pharma stocks face several challenges:
a. Regulatory Hurdles:
Drug development is a long, complex, and costly process. Regulatory delays or denials can significantly impact a company’s valuation and investor sentiment.
b. Patent Expiry and Generic Competition:
When blockbuster drugs lose patent protection, generic manufacturers flood the market with cheaper alternatives, eroding profits.
c. Pricing Pressure:
Governments and insurers worldwide are tightening controls over drug pricing to ensure affordability, especially in the U.S. and Europe.
d. Research and Development Costs:
Developing a single new drug can cost over $2 billion and take more than a decade. Failure in clinical trials can lead to heavy financial losses.
e. Political and Ethical Issues:
Pharma companies often face public scrutiny over drug accessibility, pricing controversies, and intellectual property disputes.
6. Regional Insights
United States:
The U.S. leads the world pharmaceutical market, accounting for nearly 40% of global sales. It has a robust ecosystem of biotech startups, large-cap pharma firms, and supportive venture capital funding. The NASDAQ Biotechnology Index (NBI) and S&P Pharmaceuticals Select Industry Index track many of these leading firms.
Europe:
Switzerland, Germany, the U.K., and France are home to some of the world’s most respected pharmaceutical giants. European firms emphasize innovation in biotechnology, vaccines, and specialty care.
Asia-Pacific:
Countries like India and China have emerged as major manufacturing hubs. India is the world’s largest supplier of generic medicines, while China has rapidly advanced in biologics and contract manufacturing.
Emerging Markets:
Latin America, Africa, and Southeast Asia are witnessing growing demand for affordable healthcare solutions, creating new markets for both branded and generic drugs.
7. Investment Outlook for Pharma Stocks
Pharma stocks are often viewed as defensive investments, meaning they perform relatively well during economic downturns because healthcare demand remains stable. The sector also offers long-term growth potential due to innovation and demographic trends.
Investors typically evaluate pharma companies based on:
R&D pipeline strength
Regulatory approvals and patents
Revenue diversification
Cash flow stability
Dividend history
Exchange-traded funds (ETFs) such as the iShares U.S. Pharmaceuticals ETF (IHE) or SPDR S&P Biotech ETF (XBI) provide diversified exposure to the sector.
8. Future Prospects
The next decade promises significant transformation in the pharmaceutical landscape. Personalized medicine, AI-driven research, digital therapeutics, and global vaccine innovation will reshape how treatments are developed and delivered. Furthermore, the integration of genomics and data analytics will allow for more targeted therapies, reducing side effects and improving patient outcomes.
Pharma companies that can combine innovation, scalability, and ethical responsibility are likely to outperform. Meanwhile, investors seeking stability and long-term value will continue to view pharma stocks as an essential part of diversified portfolios.
Conclusion
Pharma stocks represent a cornerstone of the global market, balancing innovation-driven growth with defensive stability. The industry’s influence extends far beyond financial returns—it underpins human health, economic resilience, and technological progress. Despite regulatory, ethical, and pricing challenges, the sector’s future remains bright, driven by scientific advancements, aging populations, and the ongoing pursuit of better health for all. As global healthcare evolves, pharmaceutical companies will continue to play a central role in shaping the world economy and investment landscape.

Derivatives Trading in Emerging Markets1. Understanding Derivatives
A derivative is a financial instrument whose value is derived from the price of an underlying asset. The underlying can be stocks, bonds, commodities, interest rates, exchange rates, or market indices. The most common types of derivatives include forwards, futures, options, and swaps.
Forwards are customized contracts traded over the counter (OTC), where two parties agree to buy or sell an asset at a future date at a predetermined price.
Futures are standardized contracts traded on exchanges, reducing counterparty risk through clearing houses.
Options give the holder the right, but not the obligation, to buy or sell an asset at a specified price within a certain period.
Swaps involve the exchange of cash flows or financial instruments between two parties, often to manage exposure to interest rates or currencies.
Derivatives are used for hedging, speculation, and arbitrage, making them vital tools for both risk management and profit generation.
2. Growth of Derivatives in Emerging Markets
Emerging markets such as India, China, Brazil, South Africa, and Indonesia have witnessed rapid growth in derivatives trading over the past two decades. Initially, their financial systems were dominated by cash or spot markets. However, the volatility in exchange rates, commodity prices, and interest rates created demand for instruments that could mitigate these risks.
India’s derivatives market, for example, began in 2000 with index futures on the NSE (National Stock Exchange). Today, it is one of the largest derivatives markets globally in terms of contract volumes.
China launched commodity futures exchanges in the 1990s and gradually introduced financial derivatives, although its government maintains strict control to prevent speculation-driven instability.
Brazil’s BM&FBOVESPA (now B3) is another major hub, offering derivatives on interest rates, currencies, and commodities.
This expansion reflects both the globalization of finance and the increasing sophistication of local investors and institutions.
3. Role and Importance in Emerging Markets
a. Risk Management
Derivatives are crucial for hedging against uncertainties in currency rates, interest rates, and commodity prices. For instance, exporters in India use currency futures to protect themselves from exchange rate fluctuations, while farmers in Brazil hedge their crop prices through commodity futures.
By allowing investors and companies to transfer risk to those willing to bear it, derivatives enhance financial stability.
b. Price Discovery
Futures and options markets help in determining the expected future price of an asset based on market sentiment. For example, futures prices of crude oil or gold on Indian exchanges provide valuable information to producers, traders, and policymakers about expected market conditions.
c. Market Liquidity and Efficiency
Derivatives attract speculators who add liquidity to the market. This increased participation tightens bid-ask spreads and improves overall price efficiency. Furthermore, arbitrage between spot and derivatives markets ensures prices remain aligned, reducing distortions.
d. Financial Deepening
A vibrant derivatives market signals financial maturity. It encourages institutional participation, supports innovation, and contributes to the development of related sectors such as clearing and settlement systems, credit rating agencies, and risk management firms.
4. Challenges Faced by Emerging Markets
While the benefits are clear, emerging markets face several structural and operational challenges in developing robust derivatives markets.
a. Regulatory and Legal Framework
In many countries, the regulatory environment is still evolving. Over-regulation can stifle innovation, while weak supervision can lead to excessive speculation and financial crises. For instance, in some Asian markets, derivatives trading was temporarily banned after being linked to market volatility.
Emerging markets need transparent, consistent, and globally aligned regulations to build investor confidence and attract international participation.
b. Limited Market Depth and Participation
Retail participation in derivatives is often low due to limited awareness and the perception of high risk. Institutional investors, such as pension funds and insurance companies, may face restrictions on using derivatives. As a result, markets may be dominated by a few large players, reducing competition and liquidity.
c. Counterparty and Credit Risk
In OTC derivatives markets, the risk that one party may default on its obligation remains significant. The lack of centralized clearing mechanisms in some markets exacerbates this problem. Developing central counterparty (CCP) systems and improving risk management practices are vital.
d. Infrastructure and Technology
Efficient trading, clearing, and settlement require advanced infrastructure. Some emerging markets still face technological constraints, slow transaction processing, or inadequate risk monitoring systems, limiting the scalability of derivatives trading.
e. Market Manipulation and Speculation
Because derivatives offer high leverage, they can be used for speculative purposes, sometimes leading to market manipulation or bubbles. Regulatory oversight and investor education are essential to prevent misuse.
f. Low Financial Literacy
Many investors in emerging markets lack a full understanding of derivatives. Without proper knowledge, they may engage in speculative trading or misuse derivatives, leading to losses and erosion of trust in the system.
5. Case Studies
India
India’s derivatives market is among the most developed in the emerging world. The NSE and BSE offer a wide range of products, including equity futures and options, currency derivatives, and commodity contracts. The Securities and Exchange Board of India (SEBI) plays a crucial role in regulating the market, ensuring transparency and risk management. India’s introduction of interest rate futures and index options has enhanced hedging opportunities for institutional and retail investors alike.
China
China’s derivatives market has grown rapidly but remains tightly controlled by regulators to avoid excessive speculation. The Shanghai Futures Exchange and Dalian Commodity Exchange are major platforms. China’s government uses derivatives strategically to stabilize commodity and currency markets, reflecting a cautious but steady approach to liberalization.
Brazil
Brazil’s derivatives market, integrated through B3 Exchange, is known for innovation in interest rate and currency products. It supports both domestic and international investors and serves as a model of how derivatives can aid monetary policy and risk management in volatile economies.
6. Future Prospects
The future of derivatives trading in emerging markets is promising, driven by technological innovation, financial integration, and policy reforms.
Digital transformation and algorithmic trading will enhance liquidity and efficiency.
Blockchain and smart contracts could make derivatives trading more transparent and secure.
Cross-border trading and integration with global exchanges will deepen market access.
ESG-linked derivatives may emerge, allowing investors to hedge environmental and sustainability risks.
However, to realize this potential, emerging markets must invest in education, infrastructure, and governance. Collaboration with global institutions such as the International Monetary Fund (IMF) and the World Bank can also provide technical assistance and policy guidance.
7. Conclusion
Derivatives trading has evolved from a sophisticated financial tool to a vital pillar of modern emerging economies. It helps manage risks, enhances liquidity, and strengthens the resilience of financial systems. However, the path to maturity is complex—emerging markets must balance innovation with regulation, speculation with stability, and access with responsibility.
As these economies continue to integrate into the global financial system, the expansion of derivatives markets will play a key role in supporting sustainable growth, attracting foreign investment, and providing the foundation for a more resilient global economy. With prudent regulation, improved market infrastructure, and growing investor sophistication, the future of derivatives trading in emerging markets is both dynamic and promising.
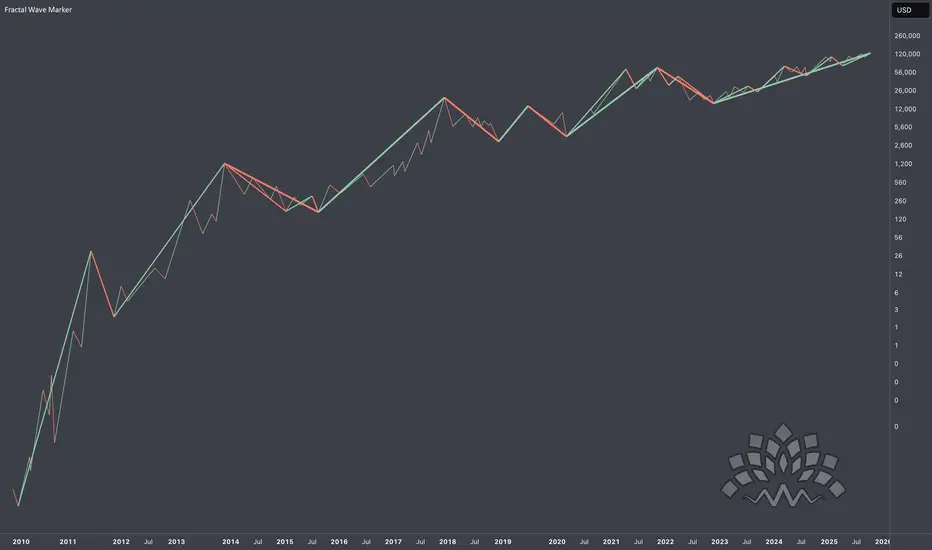
Fractal Dimension VisualizedThere are plenty of times where fractals are mentioned across TA, from indicators like FRAMA, Williams Fractals, concepts like Elliott waves - all the way to my own way of breaking cycles through Fibonacci Channels. Pretty much most of them are about self-similar behavior of the market which is often invisible to unweponized eye.
In this piece I’m going to the core - fractal dimension . Don’t fixate on numbers! Instead, visualize the scaling process: how structures fills space as you zoom in and out.
Regular Dimensions
The most fundamental question is: How many copies (N) do we get with each magnification (R).
Line (1D): A line has only one length. If I magnify length by a factor R, the number of smaller copies that fit is N=R. (Double the length → 2 copies; in general N = R^1.)
Square (2D): Magnify side length by R: the big square splits into a grid of R x R old squares, so N=R^2.
Cube (3D): Magnify edge length by R: the big cube contains R x R x R small cubes, so N=R^3.
So in D dimensions, when you scale length by R, the count of self-similar copies is N = R^D
Hence, we can extract dimension: D = log N / log R
This is the similarity dimension formula when the object breaks into N exact copies, each scaled by 1/R in length.
Application to Fractals
Sierpinski Triangle
We actually start with a solid 2D equilateral triangle. Then we remove the central upside-down triangle to leave three smaller solid triangles. Now we repeat that step inside every remaining triangle, forever. As this process continues, any patch of solid area that survives will eventually be removed, so the total area shrinks toward zero while the number of pieces explodes. The limit is the Sierpiński triangle: not “just lines,” but a fractal set with no area and a non-integer dimension between 1 and 2
At each step you get N=3 copies, each scaled by 1/2 (so R=2).
D = log 3 / log 2 = 1.5850
How to work out D in practice
Identify the scaling length: by what factor R must you magnify so the large figure looks like a collage of smaller identical copies?
Count those copies N.
Plug into D = log N / log R.
This is highly important for perceiving scaling laws not just for self-similar shapes but also other patterns.
OPEC and Global Market Stability1. The Role and Objectives of OPEC
OPEC’s primary objective is to achieve stable oil prices in international markets while ensuring a fair return on investment for producing nations and a steady supply for consuming countries. To maintain balance, OPEC regulates oil production among its member nations, aligning supply with demand.
Market stability is central to OPEC’s philosophy. Volatility in oil prices—whether due to oversupply, underproduction, or external shocks—can harm both producers and consumers. For producers, low prices reduce revenue and strain national budgets; for consumers, excessively high prices trigger inflation and economic slowdowns. Thus, OPEC’s interventions are designed to prevent extreme price swings and promote predictability in global markets.
2. Mechanisms for Market Stability
OPEC uses a combination of strategies to achieve stability in the oil market:
a. Production Quotas:
The most significant tool is the allocation of production targets among member states. During times of excess supply, OPEC cuts output to prevent price declines; when demand rises or prices surge too high, it increases production. This mechanism acts as a balancing lever in the market.
b. Monitoring and Market Analysis:
OPEC maintains a highly sophisticated system of data collection and analysis. Through the OPEC Secretariat in Vienna, the organization constantly monitors global economic trends, oil inventories, demand projections, and supply disruptions. This allows OPEC to make informed decisions that align with global economic realities.
c. Cooperation with Non-OPEC Producers:
In recent years, OPEC has expanded its influence by forming alliances with non-member oil-producing countries, such as Russia, Mexico, and Kazakhstan. This collaboration, known as OPEC+, was formalized in 2016. The OPEC+ framework enhances OPEC’s control over the global oil supply, making it easier to stabilize prices in times of volatility.
3. OPEC’s Historical Impact on Market Stability
Since its inception, OPEC’s policies have shaped the evolution of global oil markets.
a. The 1970s Oil Crises:
During the early 1970s, OPEC gained significant power by using oil as a political and economic tool. The 1973 oil embargo, in response to Western support for Israel during the Yom Kippur War, caused prices to quadruple. Although disruptive, it demonstrated OPEC’s ability to influence global energy markets and highlighted the importance of energy security for consuming nations.
b. The 1980s Oil Glut:
In the early 1980s, technological advancements and overproduction led to a sharp fall in prices. OPEC responded by reducing output quotas, attempting to balance the market. However, disagreements among members limited effectiveness, underscoring the challenge of enforcing collective discipline.
c. The 2000s Oil Boom:
Rapid industrialization in China and India fueled a massive surge in global demand, leading to record-high oil prices. OPEC managed this period by gradually increasing production while maintaining relative market stability.
d. The 2020 COVID-19 Shock:
Perhaps the most dramatic test of OPEC’s stabilizing role occurred during the COVID-19 pandemic. In April 2020, global oil demand collapsed as travel and industrial activity halted. Prices even turned negative for a brief period. OPEC+, led by Saudi Arabia and Russia, implemented historic production cuts of nearly 10 million barrels per day to restore equilibrium. Within months, markets began recovering, showcasing OPEC’s ability to stabilize a crisis-driven market.
4. Challenges to OPEC’s Market Stability Mission
Despite its influence, OPEC faces multiple challenges in maintaining stability in today’s rapidly changing energy environment.
a. Internal Disagreements:
OPEC’s strength depends on collective compliance. Differences in economic needs, production capacities, and political agendas among member states often cause disputes. For instance, nations like Saudi Arabia prefer conservative production strategies, while others like Iran or Nigeria may push for higher output to meet domestic financial obligations.
b. Competition from Non-OPEC Producers:
The rise of shale oil production, particularly in the United States, has reduced OPEC’s market dominance. Shale oil’s flexibility—its ability to ramp up production quickly when prices rise—has weakened OPEC’s control over global supply dynamics.
c. Energy Transition and Climate Policies:
As the world shifts toward renewable energy and decarbonization, the long-term demand for oil may decline. This transition poses strategic challenges for OPEC, as it must adapt to a market where oil is no longer the primary source of energy. Balancing environmental commitments with economic survival remains a delicate task.
d. Geopolitical Tensions:
Many OPEC members are located in politically volatile regions. Conflicts in the Middle East, sanctions on countries like Iran and Venezuela, and regional rivalries can disrupt production and weaken the organization’s cohesion.
5. OPEC’s Modern Strategies for Stability
In response to evolving challenges, OPEC has refined its approach to market stability.
a. The OPEC+ Alliance:
The OPEC+ coalition has been a major innovation in global oil diplomacy. By bringing non-member producers into coordinated production agreements, OPEC has extended its reach beyond traditional boundaries. This broader coalition enhances the group’s capacity to respond to market shocks and maintain price stability.
b. Flexible Policy Frameworks:
OPEC now adopts a more flexible and data-driven approach. Instead of rigid annual quotas, it meets regularly to adjust policies based on real-time data. This agility allows quicker responses to demand changes, such as post-pandemic recovery or geopolitical disruptions.
c. Investment in Energy Technology:
Some OPEC members are diversifying their economies by investing in renewable energy, hydrogen, and carbon capture technologies. For example, Saudi Arabia’s Vision 2030 plan aims to reduce dependence on oil revenues and strengthen economic resilience. This diversification supports long-term market stability by mitigating risks from oil dependency.
6. OPEC’s Economic and Geopolitical Influence
OPEC’s role extends beyond oil markets—it significantly impacts global macroeconomic stability and international relations.
When OPEC successfully stabilizes prices, both producers and consumers benefit. Predictable oil prices allow governments to plan budgets, encourage investment, and maintain economic growth. Conversely, instability often leads to inflation, currency fluctuations, and trade imbalances.
Geopolitically, OPEC serves as a platform for dialogue between member nations, fostering cooperation in an otherwise fragmented global environment. Its coordination with non-OPEC producers has also strengthened diplomatic ties across continents.
7. The Future of OPEC and Market Stability
Looking ahead, OPEC’s relevance will depend on how effectively it adapts to a transforming global energy landscape. The push for carbon neutrality, electric vehicles, and renewable alternatives poses both threats and opportunities. While demand for oil may plateau in the coming decades, OPEC can continue to play a stabilizing role by ensuring orderly transitions in the energy market.
Future stability will likely involve balancing oil production with global sustainability goals, supporting cleaner technologies, and maintaining dialogue with both producers and consumers.
8. Conclusion
OPEC has been, and continues to be, a cornerstone of global market stability. Through production management, international cooperation, and adaptive policymaking, it has guided the oil market through crises, booms, and transitions. While challenges such as energy diversification, internal discord, and environmental policies loom large, OPEC’s experience and coordination capacity position it as a key player in shaping the future of global energy stability.
In essence, OPEC’s success in stabilizing markets lies not only in controlling oil output but in balancing the complex intersection of economics, politics, and sustainability in a world increasingly conscious of both energy security and environmental responsibility.

Microstructure of Institutional Trading1. Understanding Market Microstructure
Market microstructure studies how trades occur, who participates, how prices are set, and what factors influence transaction costs. It looks beyond the macro view of supply and demand to examine the “plumbing” of the market — the trading venues, order types, intermediaries, and algorithms that connect buyers and sellers.
Key components of microstructure include:
Order types (limit, market, stop-loss, iceberg orders)
Trading venues (exchanges, dark pools, electronic communication networks)
Liquidity providers and takers
Transaction costs (explicit and implicit)
Price discovery (how information becomes reflected in prices)
Institutional investors must navigate this microstructure efficiently to minimize slippage (difference between expected and actual trade price) and transaction costs.
2. Characteristics of Institutional Trading
Institutional trading differs from retail trading in several ways:
Trade Size and Impact:
Institutions often trade in very large quantities, making their orders capable of moving market prices significantly. A single institutional order can absorb much of the market’s liquidity in a stock or derivative.
Execution Goals:
Their main objectives are to obtain the best price, minimize market impact, and maintain anonymity. To achieve this, they rely on sophisticated execution strategies and algorithmic trading systems.
Time Horizon:
Institutions may operate over longer horizons (e.g., portfolio rebalancing) or shorter ones (e.g., hedge fund arbitrage). Their strategies depend on their mandates—active funds seek alpha (excess returns), while passive funds focus on tracking indices efficiently.
Information Sensitivity:
Institutional orders can reveal private information. Therefore, discretion and order-splitting techniques are vital to prevent competitors from front-running or copying trades.
3. Trading Venues and Mechanisms
Institutional traders use multiple platforms for execution, depending on their goals and the liquidity of the security.
a) Public Exchanges
These are centralized venues like the NSE, NYSE, or NASDAQ, where prices and volumes are transparent. Trading here provides liquidity but also exposes orders to the public, increasing the risk of market impact.
b) Dark Pools
Dark pools are private trading venues where orders are hidden from public view until after execution. They are crucial for institutions wishing to trade large blocks discreetly.
Advantages: Reduced market impact and anonymity.
Disadvantages: Lower transparency and potential for adverse selection (trading against informed counterparties).
c) Electronic Communication Networks (ECNs)
ECNs match buy and sell orders electronically without intermediaries. They allow fast, efficient, and often lower-cost trading but may fragment liquidity across multiple venues.
4. Types of Orders and Execution Strategies
Institutional traders use various order types to control how their trades interact with the market:
Market Orders: Execute immediately at the best available price; suitable for urgent trades but risk slippage.
Limit Orders: Execute only at a specified price or better; useful for price control but may not fill completely.
Iceberg Orders: Only a portion of the order is visible to the market, hiding true size to reduce impact.
VWAP (Volume Weighted Average Price) Orders: Designed to execute gradually throughout the day to match average market volume, minimizing disruption.
TWAP (Time Weighted Average Price) Orders: Spread execution evenly over a specific time period to achieve average pricing.
5. Algorithmic and High-Frequency Trading (HFT)
Modern institutional trading is heavily algorithm-driven. Algorithms automate execution, monitor market conditions, and adjust strategies dynamically.
Common Institutional Algorithms:
VWAP Algorithms: Match market volume to minimize detection.
TWAP Algorithms: Execute evenly over time for steady exposure.
Implementation Shortfall Algorithms: Balance between speed and cost by comparing real-time execution price with a benchmark.
Liquidity-Seeking Algorithms: Hunt for hidden liquidity across venues, including dark pools.
Smart Order Routing (SOR): Distributes portions of large orders to multiple venues for optimal fill rates.
High-frequency traders (HFTs), though distinct from traditional institutions, influence institutional execution by tightening spreads and providing liquidity—though sometimes they compete aggressively, increasing volatility.
6. Market Impact and Transaction Costs
Institutional trading must account for two main cost categories:
Explicit Costs:
Commissions
Exchange fees
Taxes and regulatory costs
Implicit Costs:
Bid-Ask Spread: Difference between buying and selling prices.
Price Impact: Movement in price caused by executing large trades.
Opportunity Cost: Loss due to unfilled or delayed orders.
Managing these costs is central to institutional execution. Large trades are often broken into smaller slices to disguise intent and reduce impact. For example, a ₹500 crore order might be executed over several days using VWAP algorithms.
7. Information Asymmetry and Adverse Selection
Market microstructure acknowledges that not all participants possess the same information. Institutional investors may trade based on private analysis or insider signals, while market makers quote prices without full knowledge of order intent.
When institutions submit large orders, market makers may widen spreads to protect themselves from potential information disadvantages, leading to adverse selection costs.
To reduce this, institutions:
Use dark pools for anonymity.
Split orders across multiple venues.
Employ execution algorithms that mimic normal trading patterns.
8. Role of Market Makers and Liquidity Providers
Market makers play a crucial role by continuously quoting buy (bid) and sell (ask) prices. For institutional traders, these entities:
Offer liquidity during low-volume periods.
Help stabilize prices by absorbing temporary imbalances.
Sometimes act as counterparties in large block trades (via investment banks or brokers).
However, the liquidity provided is not unlimited—large institutional orders may still cause slippage or gaps in price, especially in less-liquid securities.
9. Regulatory Oversight and Transparency
Regulatory frameworks—such as SEBI in India, SEC in the U.S., and MiFID II in Europe—aim to ensure:
Fairness and transparency in execution.
Prevention of market manipulation and insider trading.
Reporting of large trades and post-trade transparency.
Institutions must comply with best execution standards, meaning they must prove they sought the best possible outcome for clients across venues.
10. Technology and Data in Institutional Trading
Today’s institutional traders rely on:
Real-time data analytics for monitoring liquidity and volatility.
Machine learning models to forecast order book dynamics.
Post-trade analytics to measure execution performance (e.g., tracking VWAP deviation).
Artificial intelligence for adaptive algorithms that learn from historical patterns.
Technology bridges the gap between human strategy and automated precision, optimizing both cost and speed.
11. Conclusion
The microstructure of institutional trading is a sophisticated ecosystem shaped by liquidity dynamics, technology, regulation, and competition. Institutional traders must balance size, secrecy, and speed while minimizing costs and preserving market integrity.
Their trading activity significantly influences price discovery, volatility, and overall market efficiency. As financial markets evolve—with advances in AI, blockchain, and decentralized trading platforms—the microstructure of institutional trading will continue to adapt, becoming even more data-driven, algorithmic, and globally interconnected.
Capital Flows Impacted1. Understanding Capital Flows
Capital flows are broadly classified into two categories:
Foreign Direct Investment (FDI):
Long-term investments in physical assets like factories, infrastructure, or real estate. FDI represents stable and sustainable investment because it indicates confidence in the host country’s economy.
Portfolio Investment:
Short-term investment in financial assets like stocks, bonds, or other securities. These flows are more volatile, as investors can quickly withdraw funds based on changes in risk perception or economic conditions.
Other Capital Flows:
These include banking sector flows, loans, and remittances. While remittances are generally stable, banking flows can fluctuate depending on interest rates and credit conditions.
Capital flows contribute to a country’s balance of payments, affect exchange rates, and determine the availability of foreign reserves. They can enhance investment, technology transfer, and job creation, but excessive inflows or sudden outflows can destabilize financial markets.
2. Factors Impacting Capital Flows
Capital flows are influenced by both push factors (conditions in advanced economies) and pull factors (conditions in emerging markets).
a. Global Interest Rates
One of the most powerful influences on capital movement is the difference in interest rates between countries.
When interest rates in advanced economies like the United States rise, investors tend to pull money out of emerging markets to take advantage of higher returns on safer assets such as U.S. Treasury bonds.
Conversely, when global interest rates are low, investors seek higher yields in developing countries, leading to capital inflows.
For example, during the U.S. Federal Reserve’s monetary tightening cycles, emerging markets like India, Brazil, and Indonesia often experience capital outflows and currency depreciation.
b. Inflation and Macroeconomic Stability
High inflation reduces the real return on investments, making a country less attractive for foreign capital. Investors prefer economies with stable prices and predictable policy environments. Macroeconomic instability—such as high fiscal deficits, political turmoil, or weak governance—can trigger capital flight as investors look for safer destinations.
c. Exchange Rate Movements
Exchange rate expectations play a crucial role in capital flow decisions.
If investors expect a currency to appreciate, they increase inflows to benefit from exchange gains.
If depreciation is expected, capital outflows intensify as investors try to avoid losses.
Unstable or artificially managed exchange rates can also discourage long-term investment, as they create uncertainty about future returns.
d. Trade and Investment Policies
Governments that promote open trade, ease of doing business, and investor-friendly policies tend to attract more capital. On the other hand, restrictive trade policies, high tariffs, or uncertain regulatory environments discourage investors.
For example, India’s liberalization reforms in the 1990s led to significant FDI inflows, while policy uncertainty in some developing countries has caused capital to dry up.
e. Geopolitical and Global Uncertainties
War, sanctions, political instability, and diplomatic tensions often lead to abrupt shifts in capital flows. Investors seek safe-haven assets such as gold, the U.S. dollar, or Swiss franc during uncertain times. The Russia-Ukraine war and tensions in the Middle East have both demonstrated how quickly capital can move in response to global crises.
3. How Capital Flows Impact Economies
The impact of capital flows can be both positive and negative, depending on their nature, duration, and management.
a. Positive Impacts
Boost to Investment and Growth:
Inflows of foreign capital provide funds for domestic investment, which can increase productivity, job creation, and infrastructure development.
Technology Transfer and Knowledge Sharing:
FDI often brings advanced technologies, managerial skills, and innovation to the host country, improving competitiveness.
Strengthening of Financial Markets:
Portfolio inflows increase liquidity in stock and bond markets, deepening the financial system and promoting market efficiency.
Improved External Balances:
Stable capital inflows help countries finance current account deficits and build foreign exchange reserves.
b. Negative Impacts
Volatility and Financial Instability:
Short-term capital, especially portfolio flows, can exit the market rapidly, leading to sharp currency depreciation, stock market crashes, and financial crises.
Exchange Rate Appreciation (Dutch Disease):
Excessive capital inflows can cause the local currency to appreciate, making exports less competitive and hurting the manufacturing sector.
Asset Bubbles:
Large inflows can fuel speculative investments in real estate or equities, inflating asset bubbles that may burst later.
Dependency and External Vulnerability:
Over-reliance on foreign capital can make an economy vulnerable to global shocks. Sudden outflows can lead to liquidity crises, as witnessed during the 1997 Asian Financial Crisis.
4. Historical and Contemporary Examples
Asian Financial Crisis (1997–98):
Rapid capital inflows into Southeast Asia fueled credit and asset bubbles. When investor confidence collapsed, massive outflows led to currency crashes and economic recessions.
Global Financial Crisis (2008):
In the wake of the crisis, developed nations lowered interest rates, leading to a surge in capital inflows to emerging markets like India and Brazil. However, these flows reversed when the U.S. signaled policy tightening in 2013, causing the “taper tantrum.”
COVID-19 Pandemic (2020):
The pandemic caused unprecedented global uncertainty, leading to sudden capital outflows from emerging markets. Later, massive liquidity injections by central banks brought capital back, especially into tech and healthcare sectors.
Current Scenario (2023–2025):
Persistent global inflation, high U.S. interest rates, and geopolitical instability have created volatile capital movements. Many emerging markets are witnessing capital outflows due to a strong U.S. dollar and rising global risk aversion.
5. Policy Measures to Manage Capital Flow Impacts
Governments and central banks use various strategies to mitigate the negative effects of volatile capital movements:
Monetary Policy Adjustments:
Central banks can use interest rate changes to stabilize currencies and control inflation, influencing the direction of capital flows.
Foreign Exchange Reserves:
Maintaining adequate reserves helps cushion against sudden outflows and currency volatility.
Capital Controls:
Temporary restrictions on certain types of inflows or outflows can prevent speculative attacks and financial instability.
Macroprudential Regulations:
Strengthening the banking system through regulations reduces the risk of asset bubbles and credit booms fueled by capital inflows.
Fiscal Discipline:
A sound fiscal policy framework reassures investors of a stable economic environment, encouraging long-term investment.
6. Conclusion
Capital flows are a double-edged sword in the global economy. While they promote growth, innovation, and development, their volatility poses challenges to economic stability. Managing capital flows effectively requires a careful balance between openness and prudence.
Countries must design policies that attract long-term, productive investments while shielding their economies from the adverse effects of short-term speculative movements. As globalization deepens, the interdependence of financial markets means that even local policy decisions can have global repercussions. Therefore, maintaining financial stability amid changing global capital dynamics remains one of the most critical tasks for modern policymakers.
In essence, capital flows reflect not just the movement of money but the pulse of global confidence — a signal of how nations are perceived in an interconnected economic world.

Regional Price Differences in the Global Trade Market1. Introduction to Regional Price Differences
Regional price differences refer to the variation in the price of the same or similar goods and services across different geographic regions or countries. In global trade, these disparities influence where goods are produced, how they are traded, and who benefits most from global value chains. For instance, the same smartphone might cost significantly more in Europe than in Asia due to differing taxes, import duties, and distribution costs.
While globalization and digitalization have helped narrow some price gaps, differences remain pronounced because local economic conditions, government regulations, and logistical constraints continue to vary widely.
2. Key Causes of Regional Price Differences
a. Production Costs and Input Availability
One of the most fundamental reasons behind regional price disparities is the difference in production costs. Labor wages, raw material availability, and energy costs differ from one region to another. For example, manufacturing costs in Southeast Asia are generally lower than in North America or Western Europe, primarily because of cheaper labor and more lenient regulatory frameworks. Consequently, products made in Asia often sell at lower prices, giving the region a competitive edge in global trade.
b. Exchange Rates and Currency Valuation
Currency fluctuations significantly impact pricing in international trade. A country with a strong currency will find its exports becoming more expensive for foreign buyers, while imports may become cheaper. Conversely, a country with a weaker currency can sell goods more competitively abroad. Exchange rate volatility, therefore, introduces continuous adjustments in trade pricing across regions.
c. Trade Policies and Tariffs
Governments impose import tariffs, export duties, and non-tariff barriers to protect domestic industries. These policies alter price structures across borders. For example, U.S. tariffs on Chinese goods during the trade tensions of 2018–2020 increased prices for certain products in American markets. Similarly, the European Union’s agricultural subsidies have led to lower food prices in Europe compared to regions where farmers receive little or no government support.
d. Transportation and Logistics Costs
Geographical distance and infrastructure quality play a vital role in determining final prices. Shipping costs, fuel prices, and port handling fees vary widely between regions. Landlocked countries, such as those in Central Africa, often face higher import prices due to their reliance on overland transportation. In contrast, coastal nations with advanced port facilities, like Singapore or the Netherlands, enjoy lower trade costs and more competitive pricing.
e. Taxation and Regulatory Differences
Value-added tax (VAT), sales tax, and environmental levies contribute to price differences. Developed countries often impose higher consumption taxes, making goods more expensive than in emerging markets. Additionally, stricter quality or safety regulations in some regions may require costly compliance, raising production and retail prices.
f. Market Demand and Purchasing Power
Regional consumer behavior and purchasing power also determine pricing strategies. Companies adjust their prices based on what consumers can afford and are willing to pay. For instance, global fast-food chains often sell products at lower prices in India or Indonesia compared to the U.S. or Japan, aligning with local income levels.
3. Economic Theories Explaining Price Differences
Two key economic theories help explain regional price disparities:
a. The Law of One Price (LOOP)
This theory suggests that in efficient markets without trade barriers or transportation costs, identical goods should have the same price globally when expressed in a common currency. However, real-world frictions — like shipping expenses, tariffs, and local taxes — often violate this law, leading to price differences.
b. Purchasing Power Parity (PPP)
PPP adjusts for differences in price levels between countries, asserting that exchange rates should equalize the purchasing power of different currencies. Yet, deviations from PPP are common due to local factors like government intervention, monopolistic pricing, and varied cost structures.
4. Regional Case Studies
a. Asia: The Manufacturing Hub
Asia, especially China, India, Vietnam, and Indonesia, is known for its low-cost manufacturing advantage. The region benefits from cheaper labor, favorable trade agreements, and strong production ecosystems. As a result, products made in Asia — such as electronics, textiles, and machinery — often cost less than similar items made in Europe or the United States. This price advantage has turned Asia into the world’s factory, though rising labor costs in China are gradually narrowing the gap.
b. Europe: High Standards and High Prices
European markets tend to have higher consumer prices due to stringent labor laws, environmental regulations, and value-added taxes. Additionally, many European countries prioritize sustainable production and quality assurance, which increase costs. However, consumers in Europe are generally willing to pay a premium for quality, ethical sourcing, and environmental responsibility.
c. North America: Market Efficiency and Brand Premiums
The U.S. and Canada enjoy advanced infrastructure and technological efficiency, which can reduce costs in some sectors. However, strong brand influence and higher wage levels often lead to elevated retail prices. Moreover, the U.S. dollar’s global dominance sometimes results in price discrepancies when converted into weaker currencies.
d. Africa and Latin America: Infrastructure and Import Dependency
Many countries in Africa and Latin America face higher prices due to weak infrastructure, high import dependency, and limited manufacturing bases. Import tariffs, long shipping routes, and unstable exchange rates further raise costs. For instance, consumer electronics or cars may cost 30–50% more in these regions than in Asia or North America.
5. Implications for Global Trade
a. Competitive Advantages and Trade Patterns
Regions with lower production costs attract multinational corporations seeking efficiency and profitability. This leads to industrial clustering — such as textile hubs in Bangladesh or electronics hubs in Taiwan. However, this concentration can also cause over-dependence and trade imbalances.
b. Consumer Access and Inequality
Price differences can contribute to global inequality. Consumers in poorer nations often pay higher prices for imported goods relative to their income, limiting access to essential products. Meanwhile, consumers in wealthier nations enjoy broader choices at competitive prices due to efficient supply chains.
c. Supply Chain Strategies
Businesses use regional price data to optimize their supply chains, choosing where to source materials and where to sell products for maximum profit. The rise of digital platforms and data analytics allows companies to monitor regional trends and adjust prices dynamically.
d. Inflation Transmission
Regional price differences can also transmit inflation across borders. For example, if energy prices rise in the Middle East, importing regions like Europe and Asia experience higher fuel and transportation costs, which ripple across global supply chains.
6. Technological and Policy Developments Reducing Price Gaps
Digitalization, automation, and free trade agreements are helping reduce some regional price disparities. E-commerce platforms allow consumers to compare global prices instantly, pressuring sellers to maintain competitiveness. Additionally, trade liberalization efforts under organizations like the World Trade Organization (WTO) aim to minimize tariffs and improve market access.
However, geopolitical tensions, such as the U.S.–China trade war or Brexit, can reverse progress by introducing new trade barriers and regulatory costs, widening price gaps once again.
7. Conclusion
Regional price differences are an inevitable and integral part of the global trade system. They reflect each region’s unique combination of resources, policies, consumer preferences, and economic maturity. While globalization, technology, and policy harmonization have narrowed some disparities, complete price uniformity remains unrealistic due to local economic realities and geopolitical diversity.
For businesses and policymakers, understanding these differences is not just an academic exercise — it is a strategic necessity. It influences where companies invest, how governments design trade agreements, and how consumers experience global markets. In the end, managing regional price differences effectively is key to ensuring balanced growth, fair competition, and sustainable globalization.

Oil Wars and Their Impact on the World Trade Market1. The Strategic Importance of Oil
Oil is the most traded commodity in the world. It accounts for a large share of global trade value and is a key determinant of national security and economic strength. Countries that possess abundant oil reserves—like Saudi Arabia, Russia, the United States, and Iran—often wield considerable influence over the global market. Conversely, oil-importing nations, such as India, Japan, and many European countries, are highly dependent on global oil supply stability and pricing.
Oil prices directly affect inflation, transportation costs, and industrial production. Therefore, any disruption—be it due to war, sanctions, or political instability—ripples through the world economy, impacting global trade flows, currency exchange rates, and stock markets.
2. Historical Background of Oil Wars
The link between oil and conflict dates back to the early 20th century. During both World Wars, control over oil supplies was critical for military success. Germany’s lack of oil access in World War II, for example, significantly weakened its war machine.
Later, the Arab-Israeli conflicts and the 1973 Arab Oil Embargo marked the first major energy crisis in modern history. In retaliation for Western support of Israel, OPEC nations reduced oil production, causing prices to quadruple and triggering global economic turmoil. The incident demonstrated how oil could be used as a political weapon in international trade.
In the late 20th century, the Gulf Wars—especially the 1990–91 conflict following Iraq’s invasion of Kuwait—were driven largely by control over oil resources. These wars disrupted oil exports from the Middle East, affected maritime trade routes, and led to sharp volatility in global markets.
3. Modern Oil Wars: Geopolitical Rivalries and Economic Strategy
Today’s oil wars are less about open military invasion and more about economic and political control. Major powers engage in “energy diplomacy” and sanctions, using oil as leverage. For example:
United States vs. Iran: The U.S. has imposed sanctions on Iranian oil exports to limit Tehran’s revenue and geopolitical influence. This restricts global supply and often causes short-term oil price spikes.
Russia vs. the West: The 2022 Russia–Ukraine war triggered one of the largest energy crises in recent decades. Western sanctions on Russian oil and gas reshaped trade routes and forced Europe to diversify its energy imports.
Saudi Arabia vs. U.S. Shale Producers: In 2014–2016, Saudi Arabia intentionally increased oil production to lower global prices, aiming to drive out high-cost American shale producers from the market. This “price war” destabilized oil-exporting economies and caused massive losses in the energy sector.
These modern conflicts are fought through production levels, price manipulation, and supply chain disruption rather than traditional warfare. Yet their effects on world trade are equally powerful.
4. Impact on Global Oil Prices
Oil wars create volatility—the most visible effect on the world market. When supply is threatened, prices surge; when production rises excessively, prices collapse.
For instance:
The 2022 Russia–Ukraine war pushed Brent crude prices above $120 per barrel—the highest in a decade.
Conversely, during the COVID-19 pandemic in 2020, an oil price war between Russia and Saudi Arabia led to an oversupply. Prices crashed, even turning negative in U.S. futures markets for a brief period.
Price volatility affects not only oil-producing nations but also global consumers. Transportation, manufacturing, and agriculture—all dependent on energy—face rising costs, which can slow economic growth and trade activity.
5. Effects on the Global Trade Market
a. Inflation and Cost of Goods
Oil price fluctuations directly influence inflation. When oil becomes expensive, transportation and manufacturing costs rise, increasing prices for goods globally. This reduces consumer demand and can lead to trade imbalances between nations.
b. Trade Deficits and Surpluses
Oil-importing countries spend more foreign currency on imports when prices rise, worsening their trade deficits. Conversely, oil-exporting countries gain trade surpluses and stronger currencies. For example, high oil prices benefit nations like Saudi Arabia, Norway, and Russia, but hurt countries like India and Japan.
c. Currency Movements
Oil wars also affect foreign exchange markets. The U.S. dollar, traditionally the benchmark currency for oil trading (the “petrodollar”), strengthens during global crises, while currencies of oil-importing nations often weaken. In contrast, oil-exporting countries’ currencies appreciate when prices rise.
d. Supply Chain Disruptions
Many shipping lanes and chokepoints—like the Strait of Hormuz or the Suez Canal—are located in oil-rich, politically unstable regions. Conflicts here disrupt maritime trade, delay shipments, and raise insurance costs for global exporters.
6. The Role of OPEC and Non-OPEC Nations
The Organization of Petroleum Exporting Countries (OPEC), founded in 1960, remains central to global oil politics. Through coordinated production decisions, OPEC and its allies (collectively called OPEC+) attempt to stabilize prices and control supply. However, internal rivalries often lead to disputes and price wars.
Non-OPEC producers like the U.S. (via shale oil) and Russia challenge OPEC’s dominance, creating competitive dynamics that frequently spill into trade wars. Each side uses production adjustments and diplomatic alliances to secure their share of the global market.
7. Energy Transition and Future Oil Conflicts
As the world shifts toward renewable energy and climate-friendly policies, traditional oil producers face declining long-term demand. This transition could spark new forms of “energy wars,” as nations compete for dominance in emerging technologies like electric vehicles, hydrogen, and battery minerals.
For instance:
The U.S. and China are already in competition for control over rare earth elements used in clean energy systems.
Oil-exporting countries are diversifying their economies to reduce dependency, but instability could rise if revenues fall too quickly.
The future oil wars may thus be economic battles over energy influence rather than territorial control.
8. Global Economic Consequences
Oil wars have cascading effects across the global economy:
Stock Markets: Energy price volatility influences global indices. Rising oil prices often cause stock markets to decline due to higher business costs.
Commodity Prices: Oil affects other commodities like natural gas, metals, and agricultural goods, since energy is required for production and transport.
Investment Flows: Investors shift toward safer assets (like gold and U.S. Treasury bonds) during oil-related geopolitical tensions.
Developing Economies: Emerging markets reliant on oil imports suffer higher inflation, currency depreciation, and trade deficits during crises.
9. Case Studies: Notable Oil Conflicts
1973 Arab Oil Embargo: OPEC’s restriction on oil exports to the West quadrupled prices, leading to global recession and inflation.
1991 Gulf War: Iraq’s invasion of Kuwait disrupted oil supply and triggered U.S.-led military intervention, causing price surges.
2014–2016 Oil Price War: Saudi Arabia flooded the market to undercut U.S. shale, resulting in a 70% price drop.
2022 Russia–Ukraine War: Sanctions and supply restrictions reshaped the global energy trade, with Europe turning to U.S. and Middle Eastern suppliers.
10. Conclusion
Oil wars have always been more than just battles for resources—they are struggles for power, influence, and economic dominance. Every time an oil-producing nation faces conflict or sanctions, the repercussions are felt in trade balances, inflation rates, and financial markets worldwide. The volatility of oil prices remains one of the most significant risks to global economic stability.
As the world transitions toward renewable energy, new types of resource competition will emerge. But as long as oil remains the foundation of industrial energy, the geopolitics of oil will continue to shape the world trade market—deciding winners and losers in the global economic arena.

Spot forex trading — practical “secrets”1. Trade the market you see, not the story you tell
One of the most costly “secrets” is simply this: markets don’t care about your narrative. Human brains love stories (inflation, wars, central banks) and those stories can be useful, but your priority must be price action and confirmed structure. If price breaks a key level and confirms with follow-through, act. If your view relies entirely on a neat story without price confirmation, you’re speculating, not trading.
2. Make risk management your system’s backbone
Successful traders manage risk first, edge second. A few principles:
Risk a fixed small percent of capital per trade (commonly 0.5–2%). This prevents one loss from wiping your gains.
Define stop loss and maximum acceptable daily drawdown before entering.
Use position sizing math (risk per trade / distance to stop) to determine lots. This is mechanical and removes emotion.
Never average down into a losing position unless you have a documented, statistically tested scaling plan and the trade still fits your edge.
3. The spread and slippage are your invisible costs
Spreads, commissions and slippage silently erode profitability. Avoid trading pairs with wide spreads or during low-liquidity hours. Be mindful of news events that widen spreads and cause slippage. Using limit orders where sensible can reduce market impact, but they come with the risk of not getting filled.
4. Know when liquidity favors you
Forex liquidity follows a daily rhythm: London and New York sessions see the most volume and narrowest spreads. Volatility is higher at market overlaps (London/New York). Trade when your strategy thrives — if you’re a breakout trader, trade during high-liquidity hours; if you prefer quiet mean-reversion, consider quieter times but watch for thin-market spikes.
5. Use timeframes intentionally — multi-timeframe confirmation
A “secret” repeatedly practiced by pros: align multiple timeframes. Identify the primary bias on a higher timeframe (daily/4H), then refine entries on a lower timeframe (1H/15m). This reduces random noise and improves odds. Don’t confuse confirmation with paralysis — you still need execution rules.
6. Focus on a handful of pairs
Mastery beats variety. Pick 3–6 currency pairs and learn their quirks: baseline volatility, reaction to economic releases, correlation to other assets (e.g., USD/JPY sensitivity to risk sentiment). Specialization lets you anticipate typical behavior and manage trades more skillfully.
7. Correlation awareness avoids accidental overexposure
Many currency pairs move together. Holding multiple correlated positions doubles risk without you noticing. Monitor correlations and limit portfolio-level exposure to avoid being leveraged into a single macro move.
8. Trade the event, not the headline
Economic releases are traded in two stages: initial fast move (often noisy and driven by order flow) and the follow-through as market participants digest the new information. If you trade news, have rules about whether you fade the initial spike, chase momentum, or wait for the post-news structure. Rushing in during the chaotic first seconds is a common way to get stopped out.
9. Execution matters: order types and placement
Limit orders can capture better prices and reduce spread costs — use them for entries and scaling.
Stop orders protect capital; place them beyond logical structural levels, not at obvious spots where they’re likely to be hunted.
Virtual stops (mental stops) are dangerous; write your stops in the platform and accept fills.
10. Keep a rigorous trading journal
Record entry/exit, stop size, reasoning, timeframe, emotions, and post-trade thoughts. Over weeks and months, the journal reveals systematic errors (overtrading, revenge trading, entering too early). The journal is the only honest performance feedback loop — analyze it weekly.
11. Have a clear, tested edge
An “edge” might be: specific breakout behavior after a London open, mean reversion after RSI extremes on 1H for EURUSD, or trading divergence with volume confirmation. Backtest carefully, but beware overfitting. Simpler rules that generalize are better than complex rules that only worked historically.
12. Use position scaling and pyramiding conservatively
Scaling in (adding to winners) can be more effective than averaging losers. Add small increments as the trade proves correct and widen stops appropriately. Pyramiding increases position when evidence supports it; averaging into a losing trade destroys capital.
13. Understand carry, swaps, and overnight exposure
Holding spot forex overnight can incur swap/rollover credits or charges depending on interest rate differentials. For short-term traders this is minor; for swing traders it matters. Include swap costs in your plan when holding for days.
14. Manage psychology like a trader, not a gambler
Common mental traps: FOMO (chasing a missed move), revenge trading (immediately trying to recoup a loss), and overconfidence after a streak. Predefine a daily trade limit and a rule to stop after N consecutive losses. Mindfulness, routines, and small rituals before trading can stabilize decision-making.
15. Build a repeatable routine and playbook
Have a morning checklist: review economic calendar, market internals, correlated asset moves (equities, bonds, commodities), overnight price action, and your watchlist levels. A consistent routine reduces impulsive trades and protects capital.
16. Use technology — but avoid overreliance
Algos and EAs can execute consistently, but remember they inherit your assumptions. Backtest on out-of-sample data and forward paper-trade before going live. Latency, slippage, and broker behavior differ from backtest assumptions.
17. Respect market structure — support/resistance, trend, range
Trade with the structure: buy pullbacks in a clean uptrend; sell rallies in a downtrend; trade ranges only when price respects levels repeatedly. Recognize when structure is shifting (higher highs/lows breakdown) and adapt.
18. Continual learning vs. strategy churn
Many traders hurt themselves by switching strategies too often. Test a new idea on a small size or in a demo account and apply only if it shows consistent edge. Maintain a learning log and implement improvements incrementally.
Final secret: small consistent edges compound
You don’t need to be right all the time. If your average win is larger than your average loss and you manage trade frequency and risk, compounding will work in your favor. Shrink risk, increase discipline, and keep trading costs low — that combination, repeated, is the truest “secret” in spot forex.

Scalping in the World Market1. Understanding Scalping
Scalping is a short-term trading strategy that focuses on exploiting tiny price gaps created by order flows, liquidity imbalances, or temporary market inefficiencies. Unlike swing traders or investors who hold positions for days, weeks, or months, scalpers hold positions for seconds to minutes. The key principle behind scalping is that smaller price movements occur more frequently than larger ones, offering more trading opportunities.
In global markets—such as forex, commodities, equities, and indices—scalpers rely on high liquidity and tight spreads to enter and exit positions quickly. They typically use leverage to magnify gains, as the profit per trade is minimal.
2. Core Principles of Scalping
Scalping operates on several fundamental principles:
Speed: Since market prices can change within milliseconds, speed in execution is essential. Scalpers use advanced trading platforms, direct market access (DMA), and low-latency connections.
Volume: Scalpers make many small trades daily. Each trade might aim for profits as low as 0.05%–0.3%, but hundreds of trades can compound into meaningful returns.
Liquidity: High liquidity ensures that scalpers can enter and exit positions without significant slippage. Major currency pairs like EUR/USD or large-cap stocks like Apple, Microsoft, or Tesla are popular among scalpers.
Risk Control: Because profits per trade are small, losses must be minimized. Scalpers often set tight stop-losses and focus on maintaining a high win rate (above 70%).
3. Types of Scalping Strategies
There are multiple approaches to scalping in the world market, each tailored to different instruments and trader preferences:
a. Market-Making Scalping
Traders act as market makers, placing both buy and sell limit orders around the current price. They profit from the bid-ask spread if both orders are filled. This method requires deep understanding of order book dynamics and access to direct liquidity pools.
b. Momentum Scalping
This strategy relies on identifying short-term trends and trading in the direction of momentum. Scalpers jump into trades when a breakout occurs and exit as soon as momentum slows. It is common in volatile assets like cryptocurrencies and tech stocks.
c. Range Scalping
Scalpers exploit sideways market movements by repeatedly buying at support and selling at resistance. This works well in stable, low-volatility sessions when prices oscillate within a predictable band.
d. News-Based Scalping
Scalpers react to breaking news, such as economic data releases or earnings announcements. Fast reactions to volatility spikes can yield quick profits—but require excellent reflexes and execution systems.
e. Algorithmic Scalping
Automated systems or trading bots are programmed to execute thousands of micro-trades per second based on pre-set parameters. Algorithmic scalping dominates modern global markets due to its speed and efficiency.
4. Scalping Across Global Markets
Scalping takes different forms depending on the market environment and asset class:
a. Forex Market
The foreign exchange market is ideal for scalping due to 24-hour trading, high liquidity, and minimal transaction costs. Popular pairs include EUR/USD, GBP/USD, and USD/JPY. Forex scalpers rely heavily on technical indicators like moving averages, Bollinger Bands, and RSI to time entries and exits.
b. Stock Market
In equity markets, scalping focuses on high-volume, blue-chip stocks. Traders monitor order books, market depth, and volume patterns. Scalpers often use Level II quotes to anticipate short-term price changes.
c. Commodities and Futures
Gold, crude oil, and index futures are popular instruments for scalping because they offer high liquidity and continuous price movement. Traders use tick charts and DOM (Depth of Market) data to detect micro-trends.
d. Cryptocurrency Market
The 24/7 nature and volatility of crypto markets make them attractive for scalping. Bitcoin (BTC), Ethereum (ETH), and Solana (SOL) often move several percent daily, offering frequent micro opportunities. However, spreads and fees can be higher compared to forex.
5. Tools and Techniques Used in Scalping
Successful scalpers rely on advanced tools and precise analysis:
Charting Software: Real-time charting with one-minute, tick, or volume-based time frames.
Indicators: Moving Average Convergence Divergence (MACD), Relative Strength Index (RSI), VWAP (Volume Weighted Average Price), and Stochastic Oscillator.
Order Flow Analysis: Observing the order book, time and sales data, and bid-ask imbalances to anticipate short-term direction.
Hotkeys and Automation: Speedy order entry and exits are crucial, often executed using hotkeys or algorithmic scripts.
Broker and Platform: Low-latency brokers with ECN (Electronic Communication Network) access and minimal spreads are preferred.
6. Advantages of Scalping
Frequent Opportunities: Since prices fluctuate constantly, there are continuous trading chances.
Limited Exposure: Positions are held briefly, reducing exposure to large market swings or news shocks.
Compounding Gains: Small consistent profits accumulate over time, building meaningful returns.
Adaptability: Scalping strategies can be applied to multiple asset classes globally.
7. Disadvantages and Risks of Scalping
Despite its appeal, scalping is challenging and not suitable for every trader:
High Transaction Costs: Frequent trades lead to higher commissions and fees that can erode profits.
Stress and Concentration: The need for quick decisions and constant monitoring can be mentally exhausting.
Execution Slippage: Delays in order execution can turn profitable trades into losses.
Broker Restrictions: Some brokers discourage or prohibit scalping due to the high server load and short holding times.
Small Margin of Error: One large loss can wipe out profits from dozens of successful trades.
8. Psychology of a Scalper
Scalping demands a specific mindset. Scalpers must remain calm, disciplined, and unemotional even under intense market pressure. They focus on process over outcome, knowing that statistical consistency matters more than any single trade. Impulsiveness or revenge trading can quickly destroy a scalper’s capital.
Good scalpers often have backgrounds in mathematics, data analysis, or programming, allowing them to develop or optimize trading systems that enhance precision and risk control.
9. Risk Management in Scalping
Effective risk management is crucial. Typical techniques include:
Tight Stop-Loss Orders: To prevent large drawdowns, stops are set just a few ticks away.
Position Sizing: Scalpers limit exposure per trade to a small portion of their capital.
Daily Loss Limits: Many professionals stop trading after hitting a predefined loss cap.
Avoiding Overtrading: Not every price movement is an opportunity; discipline is key.
10. The Future of Scalping in the Global Market
As global markets become increasingly digitalized, scalping is evolving rapidly. The rise of high-frequency trading (HFT), AI-driven algorithms, and machine learning models has made manual scalping less dominant but still viable for specialized traders.
Technological advances such as low-latency networks, colocation near exchange servers, and quantitative analysis tools give professional scalpers a competitive edge. However, regulators worldwide are introducing tighter rules to ensure market fairness, which affects the way scalping is conducted—especially in equity and futures markets.
Conclusion
Scalping plays a vital role in the global financial ecosystem by enhancing liquidity, narrowing spreads, and maintaining market efficiency. It attracts traders who thrive on speed, precision, and discipline. While it offers the potential for consistent profit, it demands exceptional skill, emotional control, and access to cutting-edge technology.
In essence, scalping is not just about quick profits—it is a test of reflexes, discipline, and strategy in a world where milliseconds can determine success or failure. As automation and AI reshape global trading, scalping continues to be both an art and a science, symbolizing the ultimate pursuit of efficiency in the financial markets.

ESG Investing and Sustainable Finance1. Understanding ESG Investing
ESG stands for Environmental, Social, and Governance — the three key pillars used to evaluate the sustainability and ethical impact of an investment.
Environmental (E):
This pillar examines how a company manages its environmental responsibilities. Factors include carbon emissions, energy efficiency, waste management, pollution control, renewable energy use, and climate change mitigation strategies.
Example: Companies that reduce greenhouse gas emissions or invest in renewable energy are seen as environmentally responsible.
Importance: Investors assess environmental performance to gauge how well a company can manage climate-related risks and comply with emerging environmental regulations.
Social (S):
This component focuses on how a company interacts with people — employees, customers, suppliers, and communities. It includes labor practices, employee welfare, diversity and inclusion, human rights, product safety, and community engagement.
Example: Firms that promote gender equality, maintain fair wages, or engage in ethical supply chains demonstrate strong social values.
Importance: Socially responsible companies tend to attract loyal customers, maintain a motivated workforce, and avoid reputational risks.
Governance (G):
Governance deals with corporate leadership, internal controls, and shareholder rights. It assesses board diversity, executive pay, ethical business conduct, transparency, and anti-corruption policies.
Example: Companies with independent boards, fair executive compensation, and transparent reporting systems score high in governance.
Importance: Good governance reduces the likelihood of fraud, mismanagement, and unethical behavior — ensuring long-term stability.
In ESG investing, these three dimensions help investors identify organizations that are not only financially sound but also sustainable and ethical in their operations.
2. The Rise of ESG Investing
ESG investing has evolved from a niche concept to a global mainstream movement. Several factors have contributed to this shift:
Investor Awareness:
Modern investors, particularly millennials and Gen Z, are increasingly motivated by values. They prefer to invest in companies that align with their ethical and environmental beliefs.
Regulatory Push:
Governments and international bodies are promoting ESG standards. For example, the European Union introduced the Sustainable Finance Disclosure Regulation (SFDR), and India’s Business Responsibility and Sustainability Report (BRSR) mandates ESG disclosures for top-listed companies.
Corporate Accountability:
Global corporations are under growing pressure to adopt ESG frameworks, not only to attract investors but also to secure long-term sustainability and brand credibility.
Risk Management:
ESG factors are now recognized as essential to identifying long-term risks such as environmental disasters, regulatory changes, or social unrest that could affect business performance.
According to data from the Global Sustainable Investment Alliance (GSIA), ESG-related investments surpassed $35 trillion globally by 2023, representing about one-third of all professionally managed assets.
3. The Concept of Sustainable Finance
While ESG investing focuses on evaluating company performance using sustainability metrics, sustainable finance refers to the broader financial system that supports sustainable development.
Sustainable finance integrates environmental, social, and governance considerations into all aspects of financial decision-making — including banking, insurance, and capital markets. It aims to channel capital toward projects and companies that contribute positively to society and the planet.
Key components of sustainable finance include:
Green Finance:
This focuses on funding environmentally friendly projects — such as renewable energy, energy-efficient infrastructure, sustainable agriculture, or water conservation.
Example: Green bonds are debt instruments used to finance environmental projects.
Social Finance:
This supports initiatives that improve social well-being — such as affordable housing, education, healthcare, or employment generation.
Climate Finance:
A subcategory of sustainable finance, it targets investments that mitigate or adapt to climate change. This includes funding clean technologies and climate-resilient infrastructure.
Impact Investing:
This approach seeks measurable positive social and environmental outcomes alongside financial returns. Investors directly fund projects or enterprises that deliver tangible societal benefits.
4. Interconnection Between ESG Investing and Sustainable Finance
ESG investing is a subset of sustainable finance. While ESG focuses on assessing companies through sustainability metrics, sustainable finance provides the financial infrastructure — such as green bonds, sustainability-linked loans, and climate funds — to support those ESG-driven companies and initiatives.
In other words:
ESG provides the criteria for evaluation.
Sustainable finance provides the capital for transformation.
Together, they form a comprehensive ecosystem where financial decisions contribute to a greener, fairer, and more transparent global economy.
5. Benefits of ESG Investing and Sustainable Finance
Long-Term Value Creation:
ESG-aligned companies tend to perform better in the long run due to better risk management, innovation, and adaptability.
Lower Risk Exposure:
Firms adhering to ESG standards are less likely to face regulatory fines, lawsuits, or reputational damage.
Improved Access to Capital:
Sustainable companies attract more investors, as many institutional funds now mandate ESG compliance.
Enhanced Reputation and Brand Loyalty:
Consumers increasingly support ethical and eco-conscious brands, boosting market share.
Positive Societal Impact:
Capital is directed toward solving global issues like climate change, poverty, and inequality, leading to inclusive growth.
6. Challenges in ESG and Sustainable Finance
Despite its growth, ESG investing faces several obstacles:
Lack of Standardization:
Different rating agencies use varying ESG criteria, leading to inconsistent evaluations of the same company.
Greenwashing:
Some companies falsely claim to be sustainable to attract investors — a practice known as “greenwashing.”
Data Limitations:
Reliable and comparable ESG data is scarce, especially in emerging markets.
Short-Term Market Pressures:
Investors often prioritize quarterly profits over long-term sustainability goals.
High Implementation Costs:
Transitioning to sustainable practices can be expensive, particularly for small and medium enterprises (SMEs).
7. Global and Indian Perspective
Globally, regions like Europe and North America lead in ESG adoption, with institutional investors such as BlackRock and Vanguard emphasizing sustainability mandates. The United Nations Principles for Responsible Investment (UN PRI) and the Paris Agreement have further driven ESG integration into the financial system.
In India, ESG and sustainable finance are gaining momentum:
SEBI (Securities and Exchange Board of India) has made ESG reporting mandatory for the top 1,000 listed companies under the BRSR framework.
The Reserve Bank of India (RBI) has initiated policies supporting green and social financing.
Indian banks like SBI and HDFC are issuing green bonds to finance renewable energy and social projects.
This marks a clear shift in India’s investment culture — aligning financial growth with sustainability.
8. The Future of ESG and Sustainable Finance
The future of finance lies in sustainability-driven innovation. Artificial intelligence, big data, and blockchain are being used to enhance ESG data transparency and traceability. Governments are introducing carbon pricing, taxonomy regulations, and sustainability-linked incentives to encourage responsible investing.
As climate risks and social inequalities intensify, ESG and sustainable finance will continue to evolve — not as alternatives but as the new standard of global financial practice.
Conclusion
ESG investing and sustainable finance represent more than just financial trends — they are part of a paradigm shift in how societies view growth and prosperity. They align economic success with social well-being and environmental preservation. By integrating sustainability into financial systems, investors and institutions are not only securing returns but also shaping a resilient, equitable, and sustainable future for generations to come.
In essence, profit and purpose are no longer opposites — they are partners in the global mission toward sustainable development.

#AN028: London Challenges European Union, Halts Defense Funds
The news that the United Kingdom has decided not to pay the €6.75 billion earmarked for the new European Defense Fund sends a clear political and economic signal to Brussels. Hello, I'm Andrea Russo, an independent Forex trader and prop trader with $200,000 in capital under management. Thank you in advance for your time.
Behind this decision is not just a question of money, but a precise strategy of industrial and military independence aimed at reaffirming British sovereignty post-Brexit.
💼 Economic and geopolitical implications
The European fund was designed to finance joint defense and technological projects, reducing dependence on the United States and strengthening the EU's autonomous military capacity.
By refusing to participate, London is sending a two-pronged message:
Economic: Priority is given to its own budgets and its national defense industry, which has seen a strong revival in the last two years with orders from Ukraine, the Middle East, and NATO countries.
Strategic: The United Kingdom does not intend to bind itself to European defense plans that could compete with NATO, of which it remains a key member.
📉 Market Impact
In currency markets, the news tends to temporarily strengthen the pound sterling (GBP), as it is perceived as a gesture of autonomy and fiscal stability—less public spending in a context of tensions over EU budgets.
However, the effect could be short-lived: the decision deepens the rift with Brussels, fueling political risks and potential trade frictions, especially if the EU reacts with restrictive measures on joint military contracts or exports.
On the equity front, British defense stocks (BAE Systems, Rolls-Royce Defence) could benefit from "patriotic" sentiment and increased domestic orders.
On the bond market, however, the effect is neutral: the move does not change the sovereign rating but reinforces the idea of the pound as a regional safe haven currency in a Europe torn between austerity and defense spending.
🌍 Risks for the EU
For Brussels, London's lack of input complicates the construction of a common defense policy:
less funding for shared industrial programs,
greater dependence on Germany and France,
and a perception of European institutional instability, a factor that tends to weaken the euro (EUR).

Sanctions and Their Role in the Global Market1. Understanding Sanctions
Sanctions are restrictions placed by one country or a group of countries on another nation or entity to enforce international laws or influence political or economic decisions. They are often used as alternatives to military intervention, serving as diplomatic or economic pressure tools. Sanctions can be applied for various reasons — to punish aggression, prevent nuclear proliferation, counter terrorism, or respond to human rights violations.
The key players in imposing sanctions are major economic and political blocs such as the United Nations (UN), the European Union (EU), and powerful individual nations like the United States. The U.S., for instance, uses the Office of Foreign Assets Control (OFAC) to design and enforce sanctions globally.
2. Types of Sanctions
Sanctions come in several forms, each targeting different aspects of an economy or government operation. The most common types include:
Economic Sanctions:
These restrict trade and financial transactions. Examples include import and export bans, restrictions on investments, or freezing of assets. Economic sanctions are intended to weaken a nation’s economic stability.
Trade Sanctions:
Trade restrictions can prevent the export of critical goods like oil, technology, or weapons. For instance, sanctions on Iran’s oil exports have significantly limited its main source of revenue.
Financial Sanctions:
These target banking systems, financial institutions, and access to international payment systems like SWIFT. Russia, for example, faced severe financial isolation after its 2022 invasion of Ukraine.
Travel and Visa Sanctions:
These restrict the movement of political leaders, business executives, or individuals associated with illicit activities.
Military Sanctions:
These include arms embargoes that prevent the sale or supply of weapons and military technology.
Sectoral Sanctions:
These are targeted at specific sectors, such as defense, energy, or finance, to maximize economic pressure while minimizing collateral damage.
3. Objectives of Sanctions
The main goal of sanctions is to influence the behavior of governments or organizations without direct conflict. Their objectives include:
Deterring Aggression:
Sanctions can discourage military invasions or aggressive policies by raising the economic costs of conflict.
Promoting Human Rights:
Countries imposing sanctions often aim to pressure regimes accused of human rights abuses to change their policies or release political prisoners.
Preventing Nuclear Proliferation:
Sanctions against nations like North Korea and Iran are designed to stop the development of nuclear weapons programs.
Countering Terrorism:
Sanctions can block financial channels and assets used by terrorist groups.
Maintaining Global Stability:
Sanctions can be part of a coordinated global response to maintain international peace and uphold the rules-based order.
4. Mechanisms and Enforcement
Sanctions are typically implemented through laws, executive orders, or international agreements. Enforcement mechanisms include:
Asset Freezes: Preventing access to money or property held in foreign accounts.
Export Controls: Blocking the sale of critical goods, technology, or services.
Financial Restrictions: Limiting a country's access to international capital markets or payment systems.
Secondary Sanctions: Penalizing third-party countries or companies that do business with the sanctioned nation.
Monitoring compliance is crucial. Organizations such as the Financial Action Task Force (FATF) help track illegal financial activities and ensure that sanctions are effectively enforced.
5. Impact on the Global Market
The effects of sanctions ripple through the global economy, influencing trade balances, currency values, and market confidence. The impact varies based on the size and integration of the targeted country into the global market.
a. Trade and Supply Chains
Sanctions often disrupt global supply chains. For instance, sanctions on Russia and Iran have affected oil and gas supplies, driving up energy prices worldwide. Similarly, export restrictions on high-tech goods to China have reshaped global semiconductor and electronics markets.
b. Energy Markets
Energy is one of the most affected sectors. Russia’s sanctions after the Ukraine conflict caused global oil and gas price surges, forcing Europe to seek alternative energy suppliers. The Organization of the Petroleum Exporting Countries (OPEC) also faces indirect pressure when sanctions alter global energy supply and demand dynamics.
c. Financial Markets
Financial sanctions can restrict global capital flow. When large economies face sanctions, investors often move funds to safer markets, affecting currency exchange rates and global liquidity. For example, the freezing of Russian foreign reserves shook confidence in the global financial system and led to a rethinking of foreign reserve management by other nations.
d. Currency and Inflation
Countries under sanctions often experience currency depreciation due to restricted foreign investment and reduced exports. This leads to inflation and reduced purchasing power. Conversely, global markets can see inflation spikes when critical exports like oil or metals are restricted.
e. Global Business and Investment
Multinational corporations often have to withdraw from sanctioned regions to avoid penalties. For example, Western companies left Russia in 2022, leading to billions in losses. At the same time, other countries—like China, India, and Turkey—sometimes step in to fill trade gaps, reshaping global business networks.
6. Winners and Losers of Sanctions
Sanctions do not impact all players equally.
Losers:
The sanctioned nation’s economy typically suffers severe downturns—loss of exports, unemployment, and financial isolation. Ordinary citizens bear the brunt of inflation and shortages.
Winners:
Competing countries may benefit by capturing markets vacated by the sanctioned nation. For example, when Western countries stopped buying Iranian oil, Asian importers received discounted rates.
Some nations, particularly those with large domestic markets or resource independence, can mitigate sanctions' effects. Russia and Iran, for example, have developed parallel financial systems and strengthened ties with non-Western economies.
7. Geopolitical and Strategic Consequences
Sanctions also alter geopolitical alliances. Countries facing sanctions often form new partnerships to bypass restrictions. The growing trade between Russia, China, and Iran illustrates the emergence of an alternative economic bloc.
Furthermore, sanctions can accelerate de-dollarization—efforts by countries to reduce reliance on the U.S. dollar in international trade. This trend threatens to reshape the structure of global finance in the long term.
8. Criticisms and Limitations
While sanctions aim to promote peace and justice, they often have unintended consequences. Critics argue that:
Humanitarian Impact: Sanctions can lead to shortages of food, medicine, and essentials, harming civilians more than political elites.
Limited Effectiveness: Some regimes adapt through smuggling, black markets, or new alliances, reducing the intended pressure.
Global Economic Distortion: Sanctions can destabilize global markets, raising costs for consumers worldwide.
Political Misuse: At times, sanctions are used to advance national interests rather than collective global welfare.
9. The Future of Sanctions in a Multipolar World
As global power becomes more multipolar, sanctions may evolve from unilateral tools into complex, multilateral strategies. The rise of alternative payment systems, digital currencies, and regional alliances is challenging traditional sanction mechanisms.
Future sanctions are likely to become more targeted, using data analytics and AI to precisely identify and restrict individuals or companies, minimizing collateral damage. Digital finance, blockchain monitoring, and trade transparency will shape how sanctions are enforced.
10. Conclusion
Sanctions are a central instrument of global diplomacy and economic policy. They influence trade routes, investment flows, and geopolitical alignments across the world. While they serve as a non-violent means to uphold international norms, their ripple effects on the global market can be profound—affecting everything from oil prices to inflation and financial stability.
The challenge for the international community is to design sanctions that are strategic, humane, and effective, achieving political goals without destabilizing the world economy. In an era of interconnected markets, the role of sanctions will continue to grow—reflecting not only power politics but also the evolving architecture of the global financial and trade system.
Global Trade, Cost Inflation, and Interest RatesIntroduction: An Interconnected Analysis
The global economy is a complex web of interdependent factors where trade, inflation, and interest rates play pivotal roles in determining economic growth, stability, and prosperity. These three variables—global trade, cost inflation, and interest rates—are deeply interconnected. Changes in one often trigger ripple effects across the others, influencing everything from consumer prices to investment flows and geopolitical dynamics. Understanding their relationship is essential to grasp how modern economies function and respond to challenges like supply chain disruptions, energy crises, and policy shifts by central banks.
1. Global Trade: The Engine of Economic Growth
Global trade refers to the exchange of goods and services across international borders. Over the past several decades, global trade has been a major driver of economic development, technological progress, and poverty reduction. It allows countries to specialize in producing goods where they have a comparative advantage, leading to greater efficiency and lower costs.
The liberalization of trade—through organizations like the World Trade Organization (WTO) and trade agreements such as NAFTA and RCEP—has encouraged the integration of global markets. However, global trade is sensitive to macroeconomic variables like inflation and interest rates, which affect production costs, consumer demand, and investment decisions.
In recent years, global trade has been influenced by various factors:
Pandemic disruptions (COVID-19) that halted supply chains.
Geopolitical tensions, such as U.S.-China trade wars and the Russia-Ukraine conflict.
Rising protectionism, as seen in tariffs and export restrictions.
Technological shifts towards digital trade and automation.
These factors have collectively reshaped how goods move around the world and how prices respond to economic shocks.
2. Cost Inflation: Rising Prices in the Global Economy
Inflation refers to the sustained increase in the general price level of goods and services. In a globalized economy, cost inflation often arises from factors that affect the supply side of trade, such as rising commodity prices, labor shortages, or disruptions in logistics.
There are two main types of inflation relevant to global trade:
Demand-pull inflation – when global demand exceeds supply, driving up prices.
Cost-push inflation – when input costs (energy, raw materials, transportation) increase, pushing prices higher.
In recent years, the world has witnessed cost-push inflation more prominently due to:
Energy price spikes: Oil and natural gas prices rose sharply after the Russia-Ukraine war, raising production and transportation costs worldwide.
Supply chain bottlenecks: Delays in ports and shortages of semiconductors or shipping containers increased manufacturing costs.
Wage pressures: Labor shortages in many economies have led to higher wages, contributing to price rises.
As global trade depends heavily on transportation and logistics, even small increases in shipping or fuel costs can translate into significant global inflationary pressures. For example, a surge in crude oil prices affects not just fuel costs but also the prices of plastics, fertilizers, and food products.
3. Interest Rates: The Policy Tool of Central Banks
Interest rates are the primary tool used by central banks (like the Federal Reserve, European Central Bank, and Reserve Bank of India) to control inflation and stimulate or cool down economic activity. When inflation rises, central banks typically increase interest rates to make borrowing more expensive, thereby reducing spending and demand. Conversely, when economic growth slows, rates are cut to encourage investment and consumption.
Global interest rate cycles have a profound impact on trade and inflation:
High interest rates tend to strengthen a country’s currency, making exports more expensive and imports cheaper, which can reduce the trade balance.
Low interest rates have the opposite effect, weakening the currency, boosting exports, but potentially fueling inflation.
Since 2021, central banks around the world have engaged in monetary tightening to combat high inflation triggered by post-pandemic recovery and energy shocks. For instance, the U.S. Federal Reserve raised rates multiple times, leading to a stronger dollar and higher borrowing costs globally. Emerging markets, in turn, faced capital outflows and currency depreciation, which further raised import prices and inflationary pressures.
4. The Interlink Between Trade, Inflation, and Interest Rates
The three forces—global trade, inflation, and interest rates—are interdependent and influence one another in complex ways.
a) Trade and Inflation
Global trade can both mitigate and amplify inflation. On one hand, open trade allows countries to import cheaper goods, which can reduce domestic inflation. On the other hand, disruptions in trade (like sanctions or shipping blockages) can cause shortages and raise prices. For example, disruptions in global food and energy supplies due to the Ukraine war led to worldwide food inflation.
b) Inflation and Interest Rates
When inflation rises, central banks increase interest rates to curb demand. However, higher interest rates raise the cost of financing for businesses involved in trade, which can reduce investment and global trade volumes. The slowdown in trade, in turn, can ease inflation but may also hurt economic growth.
c) Interest Rates and Trade
High interest rates can appreciate a country's currency, making exports less competitive. For example, a strong U.S. dollar makes American goods more expensive for foreign buyers, reducing export demand. Conversely, low interest rates can weaken the currency, boosting exports but potentially increasing imported inflation.
5. Global Trends Since 2020
Since the onset of the COVID-19 pandemic, the relationship between these three elements has undergone major shifts:
2020: Central banks slashed interest rates to near zero to support economies. Global trade contracted sharply due to lockdowns and supply chain collapses.
2021–2022: As economies reopened, demand surged faster than supply recovery, leading to inflation spikes. Energy shortages and logistics issues worsened cost inflation.
2022–2023: Central banks began raising interest rates aggressively to control inflation. This monetary tightening slowed down global trade growth, increased borrowing costs, and affected emerging market currencies.
2024–2025: The world entered a period of adjustment. Inflation started to moderate but remained sticky due to lingering cost pressures, especially in energy and food sectors. Trade diversification, such as "China+1" strategies, began to reshape supply chains and reduce dependency on single markets.
6. Effects on Businesses and Consumers
For businesses, higher global inflation and interest rates mean increased production costs, reduced profit margins, and difficulty accessing affordable credit. Companies engaged in international trade also face exchange rate risks and tariff uncertainties.
For consumers, inflation erodes purchasing power, while high interest rates make loans (for homes, cars, education) more expensive. This leads to reduced consumption, which can further dampen global demand.
For governments, managing these variables is a balancing act—stimulating growth through trade while keeping inflation in check without triggering a recession.
7. The Path Ahead: Challenges and Opportunities
As the world adapts to new economic realities, several trends are shaping the future of global trade, inflation, and interest rates:
Digital trade and automation are reducing costs and making global supply chains more efficient.
Energy transition towards renewables is helping stabilize long-term cost inflation linked to fossil fuels.
Regional trade blocs are emerging to secure supply chains and reduce vulnerability to geopolitical risks.
Central bank coordination remains crucial in avoiding excessive volatility in exchange rates and capital flows.
However, challenges persist—rising protectionism, climate-related disruptions, and financial market instability could continue to influence inflation and interest rate dynamics.
8. Conclusion
Global trade, cost inflation, and interest rates form a powerful triad that determines the rhythm of the global economy. When trade flows smoothly and inflation remains moderate, interest rates stay stable, supporting growth and investment. But when inflation surges due to global shocks—such as wars, pandemics, or supply chain disruptions—interest rates rise, trade slows, and economic uncertainty increases.
In essence, the balance between these factors defines global economic stability. Policymakers must carefully calibrate interest rates, promote open yet resilient trade systems, and address the root causes of cost inflation to ensure sustainable growth. As the world becomes increasingly interconnected, the harmony between trade, prices, and monetary policy will remain at the heart of global prosperity.

How to Trade and Make Extra Income with a Full-Time JobAt QuantSignals (QS), we’re proud to have a diverse global community — members from every country, every profession, and every walk of life.
Some of our traders dedicate their full day to the markets, while others are working professionals with limited time who still want to build wealth and generate extra income through trading.
This article is for the latter group — the busy professionals who want to trade smartly and efficiently without sacrificing their full-time careers.
Below are three proven approaches to trading successfully while working a full-time job.
1️⃣ The “Morning Power” Strategy — Trade the First Hour
If your schedule allows, the first hour after the market opens is often the most volatile and active period of the day.
Overnight news, economic data, and institutional orders all hit the tape at once — creating strong directional moves.
This is where the #💹live-kline-signal from QS shines.
Our proprietary AI, trained on billions of price action data points, provides a 2-hour prediction window, giving traders a clear picture of the potential move ahead.
All you need to do is:
Enter when the market starts moving in the direction of the kline prediction.
Manage or close the trade within one hour.
💡 Time commitment: Around 1 hour
💡 Goal: Capture morning volatility with AI precision
💡 Edge: Use data-driven forecasts instead of emotions
Repeat this consistently with proper risk management, and it can become a powerful daily income routine.
2️⃣ The “Evening Income” Strategy — Trade the Last Hour or Overnight
If you can’t trade in the morning, the final hour (“power hour”) is another prime opportunity.
Liquidity returns, institutions position for the close, and volatility picks up again.
You can apply the same #💹live-kline-signal strategy for short-term trades.
But there’s also a way to earn while you sleep — using the #💰live-credit-spread-signal.
This screener selects the top 9 credit spread trade ideas each day. After the market closes, volatility tends to drop, creating ideal conditions for income through time decay (theta) and IV collapse.
💡 Time commitment: 30 minutes before or after the close
💡 Goal: Generate passive overnight income
💡 Edge: Make the market work for you while you rest
It’s not about catching every move — it’s about leveraging time and stability.
3️⃣ The “Set & Forget” Strategy — Swing and Long-Term Trading
For those who prefer not to watch the market daily, QS offers several mid-to-long-term AI signal channels:
#📈live-swing-signal – typically 2–4 week trades
#💼live-stock-signal – directional stock ideas
#🚀live-leap-signal – long-dated options plays (6–12 months)
These strategies let you “set and forget,” checking in occasionally while the AI tracks and updates the signals automatically.
💡 Time commitment: Weekly or monthly review
💡 Goal: Build wealth passively
💡 Edge: Leverage institutional-grade AI for timing and selection
Final Thoughts
Trading doesn’t have to be a full-time profession — it can be a structured side income stream when powered by the right technology.
With QS, you can choose the trading style that fits your lifestyle:
Morning trader — capitalize on volatility.
Evening trader — earn while you sleep.
Swing investor — grow long-term wealth passively.
The key is discipline + data + consistency.
QS gives you the AI advantage to trade smarter, not longer.

The Identity Trade“When I’m winning, I feel unstoppable. When I’m losing, I feel worthless.”
That rollercoaster isn’t just emotional - it’s existential.
Follow along. I hope this helps.
BUT FIRST
NOTE – This is a post on mindset and emotion. It’s not a trade idea or system designed to make you money.
My intention is to help you preserve your capital, focus and composure - so you can trade your own system with calm and confidence.
HERE’S WHAT HAPPENS
You start to merge with your results.
A green day feels like proof you’re good.
A red day feels like proof you’re not.
The screen becomes a mirror.
Every tick feels personal.
Every drawdown feels like rejection.
And slowly... trading stops being something you do
and starts being who you are.
That’s when the smallest loss hits like a character flaw
and the biggest win can’t quiet the noise for long.
WHY IT MATTERS
When your identity fuses with your PnL,
you stop managing trades and start managing your self-worth.
You trade to feel whole.
To feel enough.
And that’s when emotional risk becomes financial risk.
THE SHIFT
You are not your last result.
You are the awareness behind it - the one capable of learning, adapting and evolving.
Next time the chart moves against you, notice what hurts more - the loss itself or what it means about you.
That’s your real edge.
Ask yourself:
Who are you when you’re not trading?

Petrodollars and Their Global Impact1. The Origin of Petrodollars
The concept of petrodollars emerged in the early 1970s following the collapse of the Bretton Woods system and the oil shocks that reshaped global energy markets. After the U.S. decoupled the dollar from gold in 1971, the dollar’s value began to fluctuate freely. In 1973, the Organization of the Petroleum Exporting Countries (OPEC) significantly increased oil prices in response to geopolitical tensions and rising global demand.
At the same time, an agreement between the United States and Saudi Arabia ensured that oil would continue to be priced and traded exclusively in U.S. dollars. This deal effectively globalized the dollar as the primary currency for energy trade. As oil prices surged, exporting countries, particularly in the Middle East, earned enormous dollar revenues. These dollars became known as petrodollars, representing the surplus funds that oil producers accumulated from selling oil abroad.
2. Petrodollar Recycling
Petrodollar recycling refers to how oil-exporting countries reinvest or redistribute their dollar earnings. This recycling process has two main channels:
Financial Recycling: Oil-exporting nations deposit their dollar earnings in international banks or invest them in global financial markets, especially U.S. Treasury securities, stocks, and bonds. This recycling helps sustain global liquidity and supports the U.S. economy by financing its trade and fiscal deficits.
Real Recycling: Petrodollars are used for development projects, infrastructure building, or the import of goods and services. Oil-rich nations often spend their surpluses on foreign products, technology, and defense equipment, which stimulates demand in manufacturing economies such as the U.S., Europe, and increasingly, China.
During the 1970s and 1980s, the recycling of petrodollars was crucial for stabilizing global financial systems. Banks used the inflow of funds from oil exporters to lend to developing nations, leading to an expansion of global credit. However, this also contributed to the debt crises of the 1980s when many borrowing countries were unable to repay their loans.
3. Economic Impacts of Petrodollars
The accumulation and recycling of petrodollars have wide-ranging economic consequences that shape both national and global economies.
a) U.S. Dollar Dominance:
Petrodollars reinforce the U.S. dollar’s role as the world’s reserve currency. Since oil must be purchased in dollars, all countries need to hold large dollar reserves. This creates consistent demand for the dollar, giving the U.S. a unique financial advantage known as “exorbitant privilege.” It allows the U.S. to run persistent trade deficits without facing immediate pressure to devalue its currency.
b) Balance of Payments Effects:
Oil-importing nations often face balance-of-payments deficits when oil prices rise because they need to spend more dollars on energy imports. Conversely, oil-exporting nations accumulate surpluses, strengthening their fiscal positions. These imbalances influence global capital flows, interest rates, and investment patterns.
c) Inflation and Exchange Rates:
Fluctuations in oil prices directly affect inflation rates worldwide. Higher oil prices increase transportation and production costs, driving inflation. Countries with weaker currencies or heavy energy dependence experience greater inflationary pressure. At the same time, oil exporters’ currencies may appreciate due to rising export revenues, affecting their non-oil sectors’ competitiveness.
4. Political and Geopolitical Implications
Petrodollars are not just an economic concept—they carry enormous geopolitical weight. The control and flow of petrodollars often determine international alliances, diplomatic relations, and power structures.
a) U.S.–Middle East Relations:
The petrodollar system strengthened ties between the United States and major oil producers like Saudi Arabia. In exchange for pricing oil in dollars, the U.S. provided military protection and political support to these regimes. This interdependence shaped decades of Middle Eastern geopolitics, influencing regional conflicts and global energy policy.
b) Geopolitical Leverage:
Countries that control oil exports wield considerable influence over global markets. For example, OPEC’s decisions to increase or cut production affect not only oil prices but also inflation, currency values, and economic stability across the globe. The accumulation of petrodollar reserves gives these nations leverage in international diplomacy.
c) Challenge to Dollar Hegemony:
In recent years, some countries, including China, Russia, and Iran, have sought to reduce reliance on the dollar in oil trade, promoting alternatives such as the petroyuan. If major energy exporters begin accepting other currencies, it could gradually weaken the dollar’s dominance and alter global financial power dynamics.
5. Petrodollars and Global Financial Markets
Petrodollar flows significantly influence global capital markets. When oil prices are high, exporters earn more dollars and invest heavily abroad. This results in large capital inflows into Western financial markets, especially the U.S., Europe, and Japan. These funds help maintain low interest rates and high liquidity in developed economies.
For instance, during oil booms, sovereign wealth funds (SWFs) from countries like Saudi Arabia, the United Arab Emirates, and Norway invest billions of dollars in equities, bonds, and infrastructure projects worldwide. These investments provide stability to global markets but also tie the financial fortunes of oil-rich nations to the performance of global assets.
However, during oil price declines, the opposite occurs—oil exporters withdraw funds to support domestic spending, which can tighten global liquidity and trigger financial volatility.
6. Petrodollars and the Developing World
The flow of petrodollars also impacts developing economies in complex ways. On one hand, petrodollar-funded loans and investments have financed infrastructure and industrialization in many developing countries. On the other hand, easy access to petrodollar-driven credit during the 1970s led to unsustainable borrowing, resulting in debt crises across Latin America and Africa.
Today, oil-importing developing nations face fiscal stress when oil prices rise, as more of their foreign exchange reserves are spent on energy imports. This can widen trade deficits and increase inflation. Conversely, oil-exporting developing nations experience economic booms during high oil price periods, though many struggle with the “resource curse”—an overreliance on oil revenues that undermines diversification and governance.
7. The Environmental and Energy Transition Dimension
In the 21st century, the world’s transition toward renewable energy presents new challenges for the petrodollar system. As global efforts to reduce carbon emissions intensify, the demand for oil may gradually decline, reducing the flow of petrodollars. This could weaken the economic power of traditional oil exporters and reshape global financial alignments.
Countries dependent on petrodollar revenues face growing pressure to diversify their economies. Initiatives like Saudi Arabia’s Vision 2030 aim to transform oil-dependent economies into diversified, investment-driven ones. Meanwhile, the shift to green energy could also influence currency dynamics if renewable energy trade begins to operate in non-dollar terms.
8. Conclusion
The petrodollar system has been one of the most influential forces in shaping modern global economics and geopolitics. It strengthened the U.S. dollar’s dominance, facilitated global financial integration, and underpinned strategic alliances, especially between the U.S. and Middle Eastern oil producers. At the same time, it created structural imbalances—linking global liquidity and financial stability to volatile oil prices.
As the world moves toward renewable energy and multipolar finance, the traditional petrodollar system faces challenges from alternative energy sources, new trading currencies, and geopolitical shifts. Nonetheless, as long as oil remains a central component of global energy consumption, petrodollars will continue to shape the global economic order, influencing everything from exchange rates and inflation to political alliances and investment flows.
In essence, petrodollars represent far more than currency—they are the lifeblood of the global energy economy and a cornerstone of modern financial power.
