CBDCs in the World Trading System1. What Are CBDCs?
A CBDC is a digital form of legal tender issued by a country’s central bank. It is:
Sovereign-backed
Regulated and stable
A digital liability of the central bank
Designed for domestic and international use
CBDCs generally come in two forms:
Retail CBDCs – used by the general public for everyday transactions.
Wholesale CBDCs – used by financial institutions for large-value payments and settlements.
In the context of world trade, wholesale CBDCs hold greater significance due to their ability to streamline international payments and reduce reliance on intermediary banking systems.
2. Current Problems in the World Trading and Payment System
Before understanding the value of CBDCs, it's important to consider the limitations of the existing trading and settlement framework:
a. High Cost of Cross-Border Payments
International transactions often involve multiple banks, SWIFT messaging, and correspondent banking networks. This leads to:
Expensive transfer fees
Slow processing times
Reliance on intermediaries
b. Dollar-Dominated Global Trade
Over 80% of global trade is invoiced in USD. This creates:
Dependency on US monetary policy
Currency risk for emerging markets
High demand for dollar liquidity
c. Slow Settlement Processes
Cross-border trade can take days to settle due to:
Time zone differences
Compliance checks
Lack of common settlement rails
d. Fragmented Financial Infrastructure
Different countries use incompatible regulations, payment systems, and messaging formats, making interoperability difficult.
CBDCs are considered a strategic solution to all these challenges.
3. How CBDCs Can Transform the World Trading System
CBDCs have the potential to reshape global trade in multiple ways.
a. Instant and Low-Cost Cross-Border Settlements
CBDCs can enable near-instant settlements by connecting central bank systems directly through digital ledger technology (DLT).
Benefits:
Reduced transaction fees
Faster trade finance processes
Lower counterparty and settlement risk
b. Reduced Dependence on Intermediaries
Traditional cross-border payments rely on correspondent banks. CBDCs, however, enable:
Direct central bank-to-central bank transactions
Fewer intermediaries
Reduced complexity in the payments chain
This leads to greater efficiency and transparency.
c. Enhanced Transparency and Anti-Fraud Controls
CBDCs allow full traceability. This is advantageous for global trade because:
Money laundering can be detected easily
Fraud and trade-based financial crimes reduce
Compliance becomes more automated
With programmable features, central banks can embed smart compliance rules into the currency itself.
d. Strengthening of Local Currencies in Trade
If CBDCs become interoperable, nations may settle trades in their own currency instead of relying on USD.
This will help countries:
Reduce dollar exposure
Stabilize local exchange rates
Enhance monetary sovereignty
China’s Digital Yuan (e-CNY) is already being tested for cross-border trade to promote Yuan internationalization.
e. Programmability in Trade Finance
CBDCs can support programmable smart contracts, enabling automated trade functions such as:
Conditional payments
Automated customs clearance
Real-time shipment tracking linked to payment triggers
Smart invoices and escrow systems
This reduces human error, delays, and contract disputes.
4. CBDCs and Global Trade Networks
a. Interoperability Projects
Many global initiatives aim to connect CBDCs across borders:
mBridge (Hong Kong, China, UAE, Thailand, BIS)
Project Dunbar (Australia, Malaysia, Singapore, South Africa)
Project Icebreaker (BIS, Sweden, Norway, Israel)
These projects test how CBDCs can settle international trade without SWIFT.
b. Digital Trade Corridors
CBDC-enabled digital trade corridors can make it easier for regions to conduct business without dependency on legacy systems. They also facilitate:
Bilateral and multilateral trade agreements
Currency swap arrangements
Real-time settlement layers
c. Impact on SWIFT and Correspondent Banking
CBDCs could reduce global reliance on SWIFT. Although SWIFT is adapting through digital integration, CBDCs bypass many of SWIFT’s limitations.
5. Challenges and Risks of CBDCs in World Trade
Despite their potential, CBDCs face significant challenges.
a. Lack of Global Standards
Without common frameworks for:
Cybersecurity
Privacy
Settlement rules
Regulatory alignment
interoperability will be limited.
b. Cybersecurity Concerns
CBDCs increase vulnerability to:
Cross-border cyber-attacks
Systemic risk if central bank networks fail
State-sponsored digital warfare
c. Geopolitical Competition
Countries may use CBDCs to:
Avoid sanctions
Reduce dependence on dominant currencies
Create regional trade blocs
This could reshape global power balances.
d. Privacy Concerns
Governments may monitor transactions too closely, raising:
Data security issues
User privacy concerns
Risks of misuse of financial information
e. Impact on Commercial Banks
If businesses prefer using CBDCs for trade:
Commercial banks may lose transaction revenue
Deposits could shift away from banks
Banks may face funding pressure
Central banks must balance innovation without destabilizing financial institutions.
6. Future of CBDCs in the World Trading System
CBDCs are still in their experimental stage, but global momentum is strong:
Over 130 countries are exploring CBDCs
Over 20 countries are in pilot or launch phases
Major economies like China, India, UAE, and the EU are leading adoption
CBDCs will likely become a core settlement infrastructure in global trade within the next decade.
Future expectations:
CBDC-based trade hubs in Asia and the Middle East
Digital currencies replacing letters of credit (LCs)
Automation of global supply chain finance
Programmable trade contracts integrated into logistics systems
Rise of multi-CBDC platforms creating a unified digital trade layer
Conclusion
CBDCs represent a revolutionary step in the evolution of the world trading system. By providing a faster, cheaper, and more transparent method of cross-border settlement, CBDCs have the power to significantly reduce inefficiencies in global trade. They also promote monetary sovereignty, reduce dependence on the US dollar, and enable programmable trade finance. Although challenges such as cybersecurity, privacy, and geopolitical tensions persist, the direction of global finance clearly indicates that CBDCs will play a major role in shaping the future of international commerce.
Contains image
Capital Flows: Concept and Characteristics1. Concept of Capital Flows
Definition
Capital flows refer to the movement of financial resources between countries. These resources include investments in financial markets, real assets, loans, and banking transfers. The underlying motivation behind these flows is to seek higher returns, diversify risks, fund economic development, or benefit from interest rate differentials and exchange rate expectations.
In macroeconomic terms, capital flows form the capital account and financial account of a country’s balance of payments (BoP). When foreign investors invest in a country, it records capital inflows. When domestic investors invest abroad, it results in capital outflows.
Types of Capital Flows
Capital flows can be broadly categorized into two major types:
A. Foreign Direct Investment (FDI)
FDI involves long-term investments where a foreign entity acquires ownership or controlling stake in a domestic company. Examples include:
Setting up factories
Buying significant equity in a foreign company
Mergers and acquisitions
FDI is typically stable, growth-enhancing, and associated with technology transfer and employment generation.
B. Foreign Portfolio Investment (FPI)
These are investments in financial assets such as stocks, bonds, and other securities without acquiring management control. FPIs are highly liquid and sensitive to:
Interest rates
Market sentiment
Global financial conditions
Due to their volatility, FPIs are often called hot money flows.
C. Other Capital Flows
Bank loans and deposits
External commercial borrowings (ECBs)
Sovereign bond purchases
Remittances (often classified separately)
Short-term speculative flows
2. Importance of Capital Flows in the Global Economy
A. Financing Development
Capital flows help developing economies fill investment gaps. Low domestic savings often restrict capital formation, and foreign investment helps fund infrastructure, manufacturing, and services.
B. Enhancing Financial Market Efficiency
Global capital flows integrate financial markets, increasing liquidity and improving price discovery. This allows companies to raise funds more efficiently and reduces the cost of capital.
C. Boosting Productivity and Innovation
FDI brings new technologies, management practices, and skills that enhance productivity. Exposure to global competition also pushes domestic firms to innovate and modernize.
D. Supporting Balance of Payments Stability
Capital inflows help countries finance current account deficits. For example, if a nation imports more than it exports, foreign investments can help cover the gap.
E. Influencing Exchange Rates
Large inflows appreciate the domestic currency, while outflows lead to depreciation. Exchange rate movements, in turn, influence trade competitiveness and inflation.
3. Characteristics of Capital Flows
Capital flows vary in size, stability, duration, and impact. The following are key characteristics that define their behavior:
A. Mobility
In today’s digital, globalized financial system, capital flows are highly mobile. Investors can shift funds across borders with the click of a button. This mobility increases liquidity but also contributes to volatility.
For instance:
Rising US interest rates may trigger outflows from emerging markets within hours.
A geopolitical tension may cause investors to rapidly move towards safe-haven assets like gold or US Treasury bonds.
B. Volatility
Not all capital flows are stable. Portfolio investments, short-term loans, and speculative flows are extremely sensitive to:
Global interest rate changes
Investor sentiment
Currency movements
Political stability
A sudden reversal of flows can trigger financial instability, known as capital flight. Emerging markets are especially vulnerable because their financial systems are relatively smaller and more fragile.
C. Risk–Return Driven
The direction of capital flows is predominantly determined by risk–return calculations. Investors compare:
Interest rate differentials (e.g., “carry trade”)
Expected currency changes
Economic growth prospects
Political risks
Financial stability metrics
Countries with stable policies, higher returns, and sound macroeconomics attract more inflows.
D. Impact on Currency and Exchange Rates
Large capital inflows strengthen the domestic currency because foreign investors must purchase local currency to invest. This can lead to:
Cheaper imports
More expensive exports
On the other hand, capital outflows weaken the currency, sometimes resulting in inflationary pressures.
E. Short-Term vs. Long-Term Nature
Capital flows differ in duration:
FDI is long-term, stable, and less likely to exit suddenly.
Portfolio flows are short-term and highly reversible.
Short-term debts increase vulnerability during crises.
Countries with higher shares of short-term external debt face greater risks during global financial shocks.
F. Pro-Cyclicality
Capital flows often move in tandem with global economic cycles:
During global booms, flows rush into emerging markets seeking higher returns.
During recessions or crises, investors retreat to safer assets (“flight to safety”).
This pro-cyclical nature can amplify economic fluctuations in recipient countries.
G. Influence of Global Liquidity Conditions
Global financial conditions, especially monetary policies of major central banks like the US Federal Reserve and ECB, heavily influence the magnitude and direction of capital flows.
For example:
Low interest rates in the U.S. push investors toward emerging markets for higher yields.
Tightening monetary policy triggers widespread outflows.
H. Policy Sensitivity
Capital flows respond quickly to changes in:
Tax policies
Capital control regulations
FDI norms
Banking sector reforms
Political developments
Stable and transparent policies attract long-term capital, while unpredictable regulations discourage investors.
I. Impact on Domestic Financial Stability
Large capital inflows can create:
Asset bubbles (stocks, real estate)
Credit booms
Over-leveraging
Similarly, sharp outflows can lead to:
Currency crashes
Stock market declines
Liquidity shortages
Thus, managing capital flows is crucial to financial stability.
4. Policy Tools to Manage Capital Flows
Countries use several strategies to handle volatile capital movements:
A. Capital Controls
Restrictions on inflows or outflows to reduce vulnerabilities.
Examples:
Limits on foreign ownership
Taxes on short-term flows
Minimum holding periods
B. Exchange Rate Interventions
Central banks may buy or sell foreign currency to stabilize exchange rates.
C. Macroprudential Policies
Limits on external borrowing
Stress tests for banks
Higher reserve requirements
D. Building Forex Reserves
Large reserves help soften the impact of outflows and boost investor confidence.
Conclusion
Capital flows are a vital engine of global economic growth and integration. They help countries access investment, improve productivity, strengthen financial markets, and support development. At the same time, their volatility, mobility, and sensitivity to global events pose significant risks, especially for developing economies.
Understanding the concept, types, and characteristics of capital flows is essential for designing effective policies that maximize benefits while reducing vulnerabilities. Proper management of these flows enables countries to achieve sustainable economic growth and maintain financial stability in a highly interconnected world.

Global Economy Shifts1. Multipolarity and the Rebalancing of Global Power
For decades, the global economy operated under a largely unipolar structure led by the United States and its Western allies. Today, this dominance is fading as new economic blocs rise. Emerging markets—most notably China, India, Southeast Asia, the Middle East, and Africa—are becoming engines of global growth.
Rise of Asia
Asia now contributes more than half of global economic growth. China remains the world’s second-largest economy despite slowing growth, while India is emerging as the fastest-growing major economy, driven by demographics, domestic consumption, and digital infrastructure.
Shift Toward Regional Blocs
Increasing geopolitical tensions between the U.S. and China have accelerated the formation of economic blocs:
BRICS+ expansion has brought new resource-rich members.
Regional trade agreements such as RCEP and CPTPP are reshaping Asia-Pacific integration.
The European Union, despite internal challenges, is investing in strategic autonomy, green energy, and advanced manufacturing.
This move toward multipolarity is redefining investment flows, supply chains, and diplomatic alignments.
2. Technological Transformation and the Digital Economy
Technology is the most powerful force reshaping global economic structures. The accelerating adoption of AI, automation, robotics, and digital platforms is altering productivity, labor markets, and competitive advantages.
Artificial Intelligence as a Growth Catalyst
AI is transforming sectors such as finance, healthcare, logistics, and manufacturing. Countries that invest heavily in AI—like the U.S., China, and South Korea—are gaining competitive edges.
Digital Infrastructure Expansion
Digital connectivity has become the backbone of national competitiveness. Innovations such as:
5G and upcoming 6G networks
Cloud computing
Quantum technologies
Blockchain and digital payments
are enabling new business models. Digital public infrastructure (DPI), led by India’s UPI, Aadhaar, and ONDC, is becoming a blueprint for emerging markets.
Techno-Economic Fragmentation
However, technology is also driving global fragmentation:
Competing semiconductor supply chains
Restrictions on data flows
Tech-related sanctions
Global technology standards may split into competing spheres, creating challenges for multinational corporations.
3. Geopolitical Conflicts and De-Risking of Supply Chains
Conflicts such as the Russia–Ukraine war, Middle East instability, and U.S.–China tensions have triggered a significant rethinking of global supply chains.
From Globalization to “De-Risking”
Countries are not fully de-globalizing, but they are diversifying away from single-source dependencies. This has led to:
Nearshoring (e.g., U.S. companies shifting production to Mexico)
Friendshoring (production moving among geopolitical allies)
China+1 strategy (India, Vietnam, Indonesia as beneficiaries)
Resilience Over Efficiency
Companies are prioritizing:
Multi-location manufacturing
Strategic stockpiling
Strengthening logistics networks
Supply chains are becoming more regional and networked, reducing vulnerability to shocks.
4. Green Transition and the Economics of Climate Change
Climate change is reshaping policymaking and investment decisions. Governments and corporations are transitioning toward low-carbon economies, driving structural changes across energy, transportation, manufacturing, and agriculture.
Shift Toward Clean Energy
Renewables—solar, wind, hydro, hydrogen—are experiencing massive investment. Nations like China lead in solar manufacturing, Europe in wind technology, and the Middle East in green hydrogen.
Electric Vehicle (EV) Transformation
EV adoption is accelerating globally, forcing:
Auto companies to redesign supply chains
Battery manufacturers to secure critical mineral sources
Governments to provide subsidies and carbon regulations
Climate-Resilient Infrastructure
Rising temperatures and extreme weather events require substantial investment in resilient infrastructure, influencing fiscal priorities worldwide.
5. Demographic Changes and Labor Market Evolution
Demographics play a critical role in shaping economic potential.
Aging Economies
Developed nations—Japan, South Korea, much of Europe, and even China—face aging populations, shrinking workforces, and rising healthcare burdens. This leads to:
Lower long-term growth
Higher fiscal pressure
Increased need for automation and immigration
Youthful Economies
In contrast, India, Africa, and parts of Southeast Asia have young populations and rapidly urbanizing societies. These countries will be key drivers of global labor supply and consumer demand in coming decades.
Future of Work
Automation and AI will redefine jobs across sectors. While high-skilled workers benefit from rising productivity, low-skilled jobs face displacement. Upskilling, remote work, and gig economy platforms are altering labor structures.
6. Shifts in Global Trade, Currency, and Finance
Global trade patterns are being reshaped by:
Tariffs and trade barriers
Sanctions
New trade agreements
Carbon border taxes
Changing Currency Dynamics
While the U.S. dollar remains dominant, alternative currency arrangements are gaining traction:
BRICS countries exploring settlement in local currencies
Digital currencies and central bank digital currencies (CBDCs)
Bilateral trade agreements bypassing the dollar
Although the dollar’s dominance will not end soon, its relative share is gradually declining.
Capital Flow Reconfiguration
Investments are moving into:
Resilient supply chains
Green energy
Technology hubs
Emerging markets
Sovereign wealth funds, especially from the Middle East, are playing a major role in global capital allocation.
7. Consumer Behavior and Market Transformations
Consumers are shifting their preferences due to technological access, environmental awareness, and rising incomes.
Key trends include:
Increased digital consumption
Demand for sustainable products
Rapid growth of e-commerce and online services
Preference for personalized and subscription-based models
Emerging market middle classes—especially in India, Indonesia, and Africa—are becoming major contributors to global consumption growth.
Conclusion: A Transformative Decade Ahead
The global economy is transitioning through a period of deep structural change. Multipolarity, technological acceleration, shifting demographics, climate imperatives, and geopolitical tensions are transforming how nations trade, innovate, and grow.
The next decade will be defined by adaptability. Countries and companies that invest in technology, diversify supply chains, embrace sustainability, and harness human capital will emerge as winners. As economic power diffuses and the global order evolves, agility and resilience will shape the new world economy.

Emerging Market Impact in the Global Trade Market1. Transformation of Global Demand and Consumption
One of the most significant impacts of emerging markets on global trade comes from their expanding consumer bases. Rising incomes, rapid urbanization, and demographic advantages—particularly in economies like India, Indonesia, and Nigeria—have created massive new markets for global goods and services.
Growing Middle Class
The global middle class has more than doubled since 2000, primarily driven by Asia.
Emerging economies now account for over two-thirds of global consumption growth.
This increasing consumption translates into greater demand for automobiles, electronics, pharmaceuticals, luxury goods, food products, and technology services. For multinational corporations, emerging markets are no longer optional but essential destinations for expansion and long-term growth.
2. Shift in Global Production Centers
The global manufacturing landscape has undergone dramatic shifts, with emerging markets becoming the backbone of global production networks. China led the manufacturing revolution, but other economies—including Vietnam, Bangladesh, India, and Mexico—have followed suit.
Low-Cost Labor Advantage
Emerging markets often provide affordable labor and supportive tax policies, attracting foreign direct investment (FDI) from international firms seeking cost-efficient production hubs.
Rise of New Manufacturing Titans
Vietnam has become a global hub for electronics and textiles.
India is emerging strongly in electronics, pharmaceuticals, and automotive parts.
Mexico benefits significantly from nearshoring trends driven by U.S.-based companies.
This shift has diversified the global supply chain, reducing dependency on single sources and making international trade more resilient and adaptive.
3. Backbone of Global Commodity Trade
Emerging markets play a vital role in both the supply and demand sides of global commodities.
Demand-Side Influence
As developing economies industrialize, their need for:
crude oil
natural gas
steel
copper
agricultural commodities
increases dramatically. China alone has been a major driver of global commodity demand for the last two decades.
Supply-Side Contribution
Many emerging countries are rich in natural resources.
Examples include:
Brazil and Argentina in agriculture
South Africa and Chile in metals and minerals
Indonesia and Malaysia in palm oil
Gulf and African countries in energy resources
The pricing of many global commodities is now significantly influenced by the economic growth patterns of emerging markets.
4. Increasing Role in Global Trade Policies
Emerging markets are becoming more influential in international economic institutions such as the World Trade Organization (WTO), IMF, G20, and regional trade blocs.
Strategic Alliances and Trade Blocs
BRICS (Brazil, Russia, India, China, South Africa)
ASEAN (Association of Southeast Asian Nations)
MERCOSUR in South America
These groups advocate for more balanced trade policies and improved access to developed markets. Their collective bargaining power is reshaping global tariffs, trade agreements, and development frameworks.
5. Digital Transformation and Technology Services
Emerging markets are not just manufacturing hubs; many have become leaders in digital trade and technology services.
India’s IT Dominance
India has become the world’s IT outsourcing leader, supplying software services, cloud solutions, and consulting to major global corporations.
China’s Tech Ecosystem
China’s evolution into a global powerhouse in:
smartphones
e-commerce
artificial intelligence
robotics
has changed the competitive landscape.
Start-Up Ecosystems Rising
Several emerging economies now boast robust start-up ecosystems, including:
Indonesia
Brazil
Nigeria
Vietnam
Their growing digital markets contribute significantly to global e-commerce and fintech trade.
6. Changing Global Supply Chain Dynamics
The pandemic accelerated a realignment of supply chain strategies. Companies began diversifying production away from single-country dependence—a phenomenon known as China+1 strategy.
Winners of Supply Chain Diversification
Vietnam
India
Mexico
Thailand
Malaysia
As multinational firms diversify, emerging markets gain new investments, technology transfers, and increased participation in global trade networks. This shift enhances their economic resilience and strengthens their influence in global trade decisions.
7. Growing Investment Destinations
Emerging markets attract significant foreign direct investment (FDI) due to:
large workforces
improving ease of doing business
competitive production costs
rapid digitalization
Investments in sectors like manufacturing, infrastructure, renewable energy, and technology have fueled growth. In return, these economies are increasingly investing abroad, particularly through:
sovereign wealth funds
multinational corporations
development banks (e.g., China’s Belt & Road Initiative)
This two-way investment flow deepens global trade linkages and accelerates economic integration.
8. Challenges and Vulnerabilities
Despite their growth and influence, emerging markets face structural challenges that affect global trade.
Economic Volatility
These economies are more vulnerable to:
currency fluctuations
inflation cycles
commodity price swings
debt stress
Global economic slowdowns disproportionately impact emerging markets.
Infrastructure Gaps
Inadequate infrastructure in ports, logistics, power supply, and digital connectivity can limit trade efficiency.
Political and Policy Risks
Trade policies, regulatory changes, and geopolitical tensions can create uncertainty for investors and trading partners.
Yet despite these challenges, their overall trajectory continues upward.
9. Geopolitical Influence and Realignment
Emerging markets now play major roles in global geopolitics, influencing trade corridors, energy routes, and investment flows. China’s Belt and Road Initiative (BRI), India’s Act East Policy, and regional trade blocs show a growing desire for strategic autonomy.
These geopolitical realignments have reshaped:
maritime trade routes
infrastructure development
cross-border connectivity
As emerging markets grow stronger, their geopolitical strategies directly impact global trade patterns.
10. Future Outlook: The Next Phase of Global Trade
In the coming decade, emerging markets are expected to contribute nearly 60–65% of global GDP growth. Their rise will further influence:
Key Trends
Expansion of digital trade and fintech
Green energy transitions leading new commodity markets
Growing influence in global governance institutions
Greater regional trade integration
Increased innovation and technological adoption
Emerging markets are not just participants—they are becoming architects of the future global trade system.
Conclusion
Emerging markets have fundamentally reshaped the global trade landscape. From driving consumption growth and diversifying production hubs to influencing commodity markets and trade policies, these economies are now critical pillars of global economic architecture. While challenges remain, their increasing economic integration, expanding middle class, rapid digitalization, and strategic geopolitical influence position them as the key engines of global trade in the decades ahead.
BRICS Thriving in the Global Market1. Economic Powerhouse: The Growing Weight of BRICS
BRICS nations collectively account for:
~45% of the world’s population
~36% of global GDP (PPP terms)
Over 30% of global energy supply
More than 25% of global exports
This economic heft gives the bloc a powerful edge in global markets. China and India alone are among the world’s top three economies (PPP), contributing significantly to global consumption and manufacturing.
Diverse Economic Strengths
Each BRICS nation contributes uniquely:
China remains the world’s manufacturing hub.
India is a technology and services powerhouse.
Brazil dominates agricultural exports—soybeans, beef, sugar.
Russia is a global leader in oil, gas, and defence.
South Africa is rich in minerals and precious metals.
Saudi Arabia & UAE bring capital and strategic energy influence.
Iran adds geopolitical depth and massive energy reserves.
Egypt & Ethiopia boost African connectivity and demographic momentum.
This diversity allows BRICS to remain resilient amid global disruptions, creating a balanced ecosystem that strengthens intra-bloc cooperation.
2. Trade Expansion: Intra-BRICS and Global Influence
BRICS countries are rapidly expanding trade ties among themselves to reduce dependence on Western markets. China’s trade with BRICS partners has surged, while India has significantly increased exports to Brazil, Russia, and Middle Eastern BRICS members.
Key Factors Driving BRICS Trade Growth
a) Complementary Economies
China and India require energy → Russia, Saudi Arabia, Iran supply it.
Brazil’s agricultural exports feed Asia.
Africa’s mineral wealth fuels global industrial supply chains.
This interdependence strengthens BRICS’ internal trade network.
b) Reduced Trade Barriers
Countries are increasingly settling trade in local currencies rather than the U.S. dollar, reducing currency volatility and sanctions exposure.
c) Shift in Global Supply Chains
The “China+1” and “China+2” strategies have allowed India, Brazil, and others to attract manufacturing investments as global firms diversify.
3. Financial Resilience: BRICS Challenging the Western Banking System
One of the strongest signs of BRICS thriving in the global market is the growing independence from Western-dominated financial structures.
The New Development Bank (NDB)
Founded in 2014, the NDB finances infrastructure and sustainable projects across member countries. It has approved billions in funding and aims to rival institutions like the World Bank.
Local Currency Settlements
Countries like India, Russia, and China are increasingly settling trade in:
Indian Rupee (INR)
Chinese Yuan (CNY)
Russian Ruble (RUB)
This reduces dollar dependency and creates a more stable financial ecosystem.
Rise of Yuan in Global Trade
With China’s vast trade network, the Yuan has become a preferred settlement currency in Asia, Middle East, and parts of Africa—indicating the financial reach of BRICS nations.
4. Energy Dominance: A Core Strength of BRICS
Energy-rich BRICS members—Russia, Saudi Arabia, Iran, Brazil—have reshaped global oil and gas markets.
Why Energy Gives BRICS Global Power
They control over 40% of the world’s oil production.
They significantly influence OPEC+ decisions.
Asian demand for energy gives the bloc leverage.
Energy trade in local currencies challenges petrodollar dominance.
This energy ecosystem further strengthens BRICS economic integration.
5. Technological and Digital Growth: The New Engine of BRICS
Technology and digital infrastructure are crucial for modern economic dominance. BRICS nations, especially China and India, are leading in several key areas:
a) Digital Payments
India’s UPI has become a global model.
Brazil’s PIX and China’s WeChat Pay dominate domestic markets.
b) Artificial Intelligence & Semiconductors
China is a global AI leader; India is emerging as a major chip-design hub.
c) Space Technology
India, China, and Brazil have advanced space programs that boost telecom, navigation, and climate research.
d) 5G and Future Tech
China’s Huawei leads global telecom infrastructure development, especially in Africa and Asia.
BRICS nations are not just consumers of technology—they are innovators and exporters, enhancing their global market competitiveness.
6. Geopolitical Influence: BRICS as a Multipolar Power Center
The growth of BRICS is inherently tied to the global shift away from unipolarity. With the West and emerging economies diverging in priorities, BRICS offers an alternative global governance model.
Geopolitical Strengths of BRICS
Represents major regional powers across Asia, Africa, Middle East, South America.
Coordinates policies on global issues like climate, development, and trade.
Provides a counterweight to NATO, G7, and Western-led financial institutions.
The expansion of BRICS signals its rising diplomatic and strategic relevance.
7. Global South Leadership: BRICS as a Voice for Developing Nations
A major reason BRICS is thriving is its role as the champion of the Global South.
Key roles include:
Promoting fairer global trade rules.
Improving access to development finance.
Supporting infrastructure development across Africa & Asia.
Challenging Western dominance in global decision-making.
As inequality between developed and developing countries rises, BRICS becomes a preferred platform for emerging economies.
8. Future Outlook: Can BRICS Redefine Global Markets?
The momentum behind BRICS is strong, but the future will depend on:
Deepening financial integration.
Improving trade logistics.
Balancing China–India competition.
Leveraging energy dominance responsibly.
Expanding technological cooperation.
If successful, BRICS could become the largest economic bloc in the world by 2035, shaping global trade, currencies, and geopolitics.
Conclusion
BRICS is thriving in the global market due to its massive population, resource wealth, rapid digital growth, rising financial independence, and strategic geopolitical influence. As the world transitions toward a multipolar era, BRICS nations are not only shaping global trade but also redefining the economic and political architecture of the 21st century. With expanding membership, growing economic interdependence, and increasing relevance in global governance, BRICS is poised to become one of the most powerful alliances in the decades ahead.

Understanding Forex Money Flow: Risk-on & Risk-offWhen it comes to Forex, most traders focus on technicals, chart patterns, or indicators. But “money flow” — the force that truly moves price — is often overlooked. If you want to read the market like a pro, you must understand Risk-on and Risk-off: the two sentiment states that drive global capital.
Today, let’s break them down clearly, practically, and in a way you can apply immediately.
🔥 What Is Risk-on?
“Risk-on” appears when the market is optimistic, investors seek risk, and money flows strongly into high-return assets.
Signals of a Risk-on Environment:
Strong stock market rallies
Capital shifts into riskier assets
Bond yields rise
Positive economic news or geopolitical easing
Assets That Benefit in Forex:
AUD, NZD, CAD (commodity currencies)
GBP, EUR (when the economy is stable)
Bitcoin, oil, and equities also tend to rise
Risk-on = “The market is excited → money flows into high-yield assets”.
💥 What Is Risk-off?
“Risk-off” occurs when the market fears uncertainty, causing money to move toward safe-haven assets.
Signals of a Risk-off Environment:
Stock markets fall sharply
Money exits risky assets
Gold spikes
USD and JPY strengthen
Negative economic news, war, inflation, or political instability
Assets That Benefit in Forex:
USD, JPY, CHF
Gold (XAUUSD)
U.S. government bonds
Risk-off = “The market is scared → money runs to safety”.
❓ Why Forex Traders MUST Understand Risk-on / Risk-off
No matter what indicator you use, the market ultimately reacts to major capital flow.
Understanding these two states helps you:
Trade with market sentiment → dramatically increases win rate
Avoid entering trades against the money flow → fewer “pointless stop-loss hits”
Identify strong/weak currencies → choose high-probability setups
Many perfect technical setups fail simply because they go against global money flow.
📌 How to Apply This Immediately in Your Forex Trading
1. Check the News → Identify Sentiment
Good news? Strong GDP? Stable markets? → Risk-on
Bad news? War? Inflation? Hawkish Fed? → Risk-off
2. Compare Currency Strength
Simple formula:
Risk-on → prioritize BUY AUD, NZD, CAD
Risk-off → prioritize BUY USD, JPY, CHF
3. Follow the Trend — Avoid Fighting Money Flow
The strongest trends often come from shifts between Risk-on and Risk-off.
Examples:
Bad news → JPY strengthens → XXXJPY pairs fall hard
Risk-on returns → USD weakens → gold rises quickly
Follow the money flow, and you’re already ahead of 80% of traders.
🧠 Conclusion – If You Want to Trade Smart, Trade With the Money Flow
Risk-on and Risk-off aren’t just theory — they’re the compass that reveals market psychology, which is the foundation of every trend.
Want to trade like Smart Money?
→ Watch where the money is moving, not just where the candles are going.

WaverVanir Market Intelligence — PLTR UpdatePalantir is showing one of the strongest bifurcations we’ve seen this quarter:
our Institutional ML Forecast Model projects a 63% upside toward $252,
while our SMC + Fibonacci liquidity map outlines a deeper liquidity-seek toward $111 if the current structure breaks down.
This divergence is exactly why VolanX runs multi-framework confirmation instead of relying on a single bias.
VolanX DSS Read — Key Signals
Strong Buy signal from the institutional ML ensemble
Target Range: $252.62 (30-day predictive horizon)
Prediction Volatility: 114.84% — high-velocity environment
Model Agreement: 8 of 9 bullish
Sharpe Ratio (simulation): 1.66
SMC / Fibonacci Structure Read
Price is currently sitting at the 0.886 retracement — a high-reaction zone
Clear CHoCH signaling short-term displacement
If price fails to reclaim equilibrium (~$171–$178 zone),
liquidity magnets sit at:
$133
$124
$111 (1.618 full extension)
Interpretation
Bullish bias from AI models + bearish liquidity structure = compression environment.
Historically, PLTR produces violent expansions after this setup.
VolanX plays these environments with reduced position sizing and event-driven execution until direction resolves.
Outlook
We will update our directional call once the following triggers confirm:
Daily close above equilibrium → bullish continuation
Daily close below $147.56 → liquidity sweep pathway toward $133 / $124
WaverVanir continues to monitor PLTR using both institution-grade AI forecasting and human-validated smart-money structure.


AUDJPY--Head and Shouder--"Head and shoulder" is forming
--entry and tp levels are as shown on the chart

Bitcoin Classic Bearish StructureThe weekly picture for Bitcoin is looking heavy. After losing the W21 EMA , price briefly caught a bid at the W50 EMA but was promptly rejected on the retest of the W21. The subsequent breakdown was swift, now finding a temporary floor at the Monthly21/W100 EMA.
The W21 EMA has officially now flipped from support to key resistance, and any bounce will likely be sold into until that level is recaptured by the end of the Bear Market
Are we looking at a consolidation here before another leg down to the W200 SMA?
Or Bulls are looking for an abrupt pump back to the W21 ema??!
Let me know what you think down Below!

Gold.Gold.
RARE and IMPORTANT breakout about to occur.
5 more trading before it gets CONFIRMED.
Have a great weekend!

May be/may be not ...Basing this purely on fractal theory...
Could be so wrong on this, particularly with the recent dip the last week, but I'm going with it for now.
A dip below the 0.5 on the fib distribution, and i'm potentially out... playing it by ear/price action for now.
Will try to update this idea over the coming trading days to show other reasons why I think this is he move.
Worst case, we could see a dip down to the major support (best viewed on the 1 day/1 week charts) but from what I see for now, this is the move.
Thoughts?

Tesla Retests Key support Amid a New Lawsuit After Deadly CrashTesla (NASDAQ: NASDAQ:TSLA ) faces renewed scrutiny after a lawsuit was filed over a fatal January 2023 crash in Washington state. According to the complaint, the vehicle “rapidly accelerated” before striking a utility pole and bursting into flames, killing one passenger and severely injuring another. First responders reportedly struggled to access the victims due to the vehicle’s structure and fire behavior, raising questions about safety systems and emergency accessibility.
The lawsuit lands during a period of heightened attention on Tesla’s real-world AI features, including Autopilot and Full Self-Driving (FSD). While the filing does not explicitly blame autonomous systems, it adds pressure to Tesla’s regulatory and legal environment, which remains a critical investor risk factor heading into 2026.
Tesla’s Fundamentals Remain Strong
Despite the legal challenges, Tesla retains a massive market cap near $1.33 trillion and continues scaling its energy and robotics divisions. The company remains profitable, with a strong balance sheet and long-term margin expansion driven by software, AI, and autonomous capabilities. The Optimus humanoid robot program and 4680 battery ramp both strengthen Tesla’s position in the next industrial cycle.
Tesla’s broad lineup—from the Model 3 to the Semi and Cybertruck—supports global delivery growth, while its charging infrastructure partnerships increase ecosystem reach. Fundamentally, Tesla remains one of the strongest players in the EV and AI–mobility sectors.
Technical Outlook: Trendline Retest in Play
From a price-action perspective, Tesla trades around $391, pulling back toward a critical ascending trendline visible on the weekly chart. This trendline has guided Tesla’s recovery since April and remains the key level to watch.
Support:
• $390 trendline
• Major demand at $350
• Long-term support at $250
Resistance:
• $425
• $492 (2025 high)
A strong bounce at the trendline could send TSLA back toward $425 and eventually $492. However, a clean breakdown risks a deeper correction toward the $320 zone.

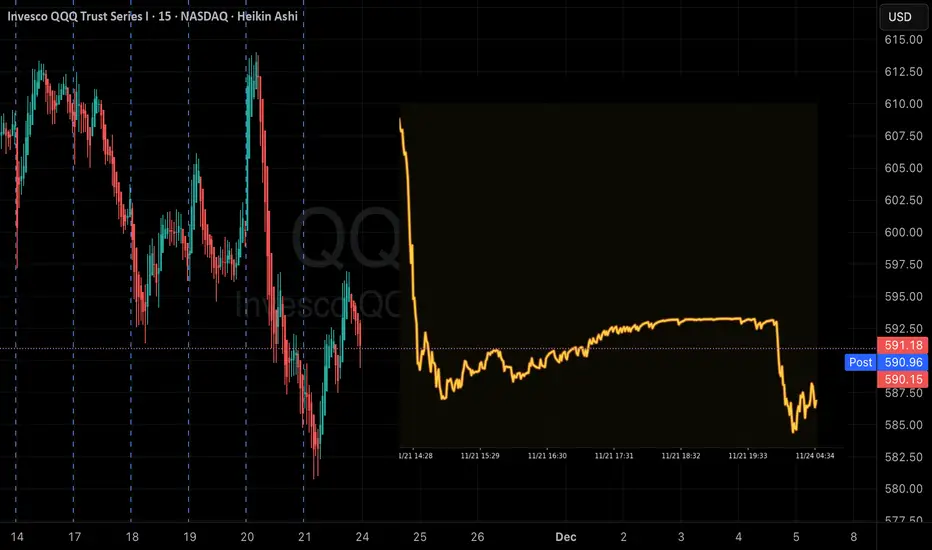
QQQ Momentum Play: QuantSignals V3 Sees Sharp DownsideQQQ | QuantSignals Katy 1M Prediction (2025-11-21)
Current Price: $595.17
Predicted Close: $582.79 (-2.08%)
30-min Target: $584.69 (-1.76%)
Trend: Bearish
Confidence: 73.9%
Volatility: 16.8%
Trade Signal
Direction: PUT (SHORT)
Entry: $595.17
Target: $585.26
Stop Loss: $604.10
Expected Move: -2.08%
Summary: 1 trade signal generated from 1 successful analysis.
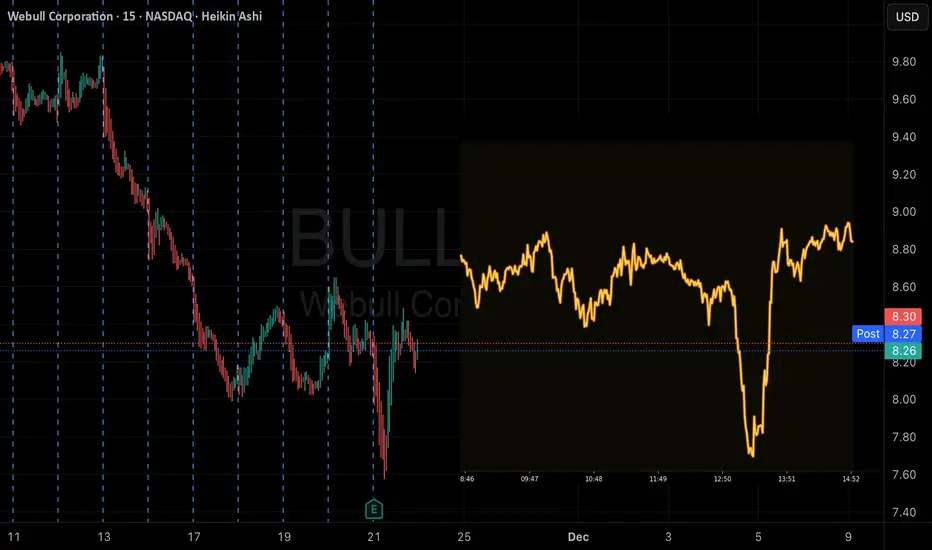
BULL SHORT Alert! QuantSignals V3 Predicts Slight DownsideBULL | QuantSignals Katy 1M Prediction (2025-11-21)
Current Price: $8.39
Predicted Close: $8.35 (-0.51%)
30-min Target: $8.24 (-1.79%)
Trend: Neutral
Confidence: 55%
Volatility: 93.2%
Trade Signal
Direction: SHORT (PUT)
Entry: $8.39
Target: $8.36
Stop Loss: $8.52
Expected Move: -0.51%
Summary: 1 trade signal generated from 1 successful analysis.
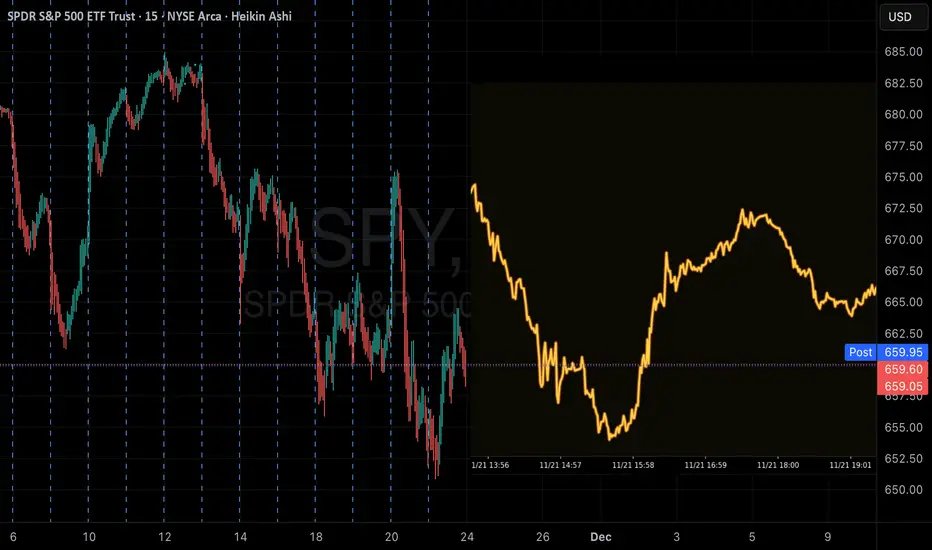
SPY Momentum Play: QuantSignals V3 Sees DownsideSPY | QuantSignals Katy 1M Prediction (2025-11-21)
Current Price: $659.25
Predicted Close: $654.44 (-0.73%)
30-min Target: $655.71 (-0.54%)
Trend: Bearish
Confidence: 64.9%
Volatility: 14.8%
Trade Signal
Direction: SHORT (PUT)
Entry: $659.25
Target: $655.40
Stop Loss: $669.14
Expected Move: -0.73%
Summary: 1 trade signal generated from 1 successful analysis.
QuantSignals V3 APLD Bullish Alert! APLD | QuantSignals Katy 1M Prediction (2025-11-21)
Current Price: $19.25
Predicted Close: $20.43 (+6.12%)
30-min Target: $20.05 (+4.18%)
Trend: Bullish
Confidence: 75%
Volatility: 111.2%
Trade Signal
Direction: CALL
Entry: $19.25
Target: $20.19
Stop Loss: $18.96
Expected Move: +6.12%
Summary: 1 trade signal generated from 1 successful analysis.

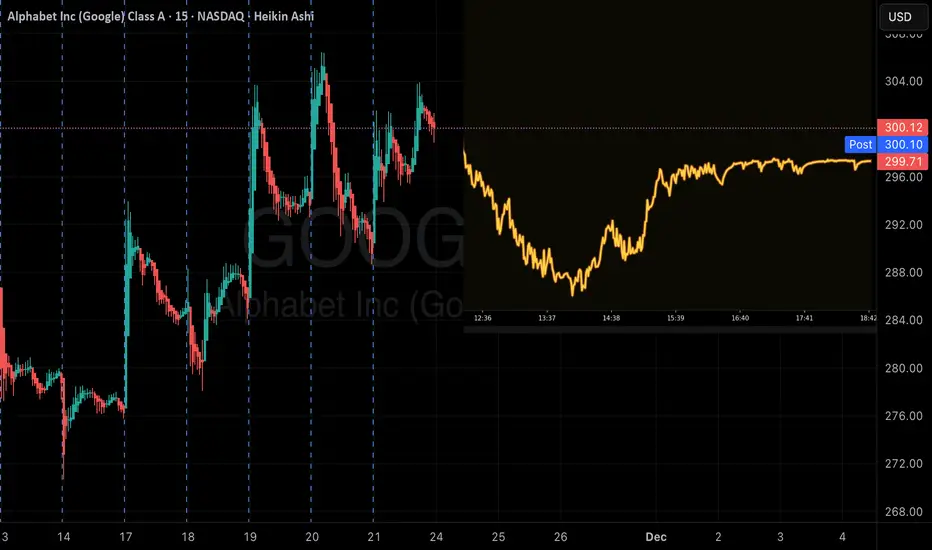
GOOGL Momentum Play: QuantSignals V3 Sees DownsideGOOGL | QuantSignals Katy 1M Prediction (2025-11-21)
Current Price: $295.97
Predicted Close: $293.39 (-0.87%)
30-min Target: $291.79 (-1.41%)
Trend: Bearish
Confidence: 65.8%
Volatility: 32.1%
Trade Signal
Direction: SHORT (PUT)
Entry: $295.97
Target: $293.90
Stop Loss: $300.41
Expected Move: -0.87%
Summary: 1 trade signal generated from 1 successful analysis.
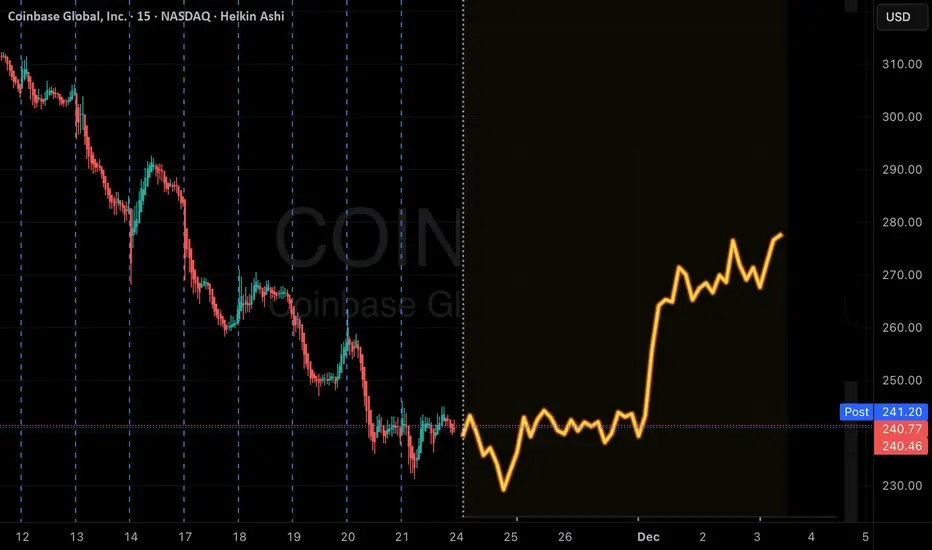
COIN Swing Alert! QuantSignals V3 Predicts Strong Put MoveCOIN | QuantSignals V3 Swing Trade Alert (2025-11-20)
Signal Overview
Direction: BUY PUTS (Short)
Confidence: 72% (Medium Conviction)
Horizon: 15 days → Expiry 2025-12-05
Strike: $240.00
Entry Price: $17.83
Target 1: $25.50 (+43%)
Target 2: $32.00 (+79%)
Stop Loss: $12.50 (-30%)
Position Size: 2.5% of portfolio
Market Context
1W Move: -7.35% | 2W Move: -13.26%
Swing Range: $246.88 – $287.92
Technicals: Bearish momentum, RSI oversold (21.2), MACD bearish, EMAs aligned bearish
News Sentiment: Mixed → Coinbase prediction market + regulatory tailwinds, but BTC < $90k weighs on crypto stocks
Trade Rationale
Katy AI shows neutral-to-bullish bias, but overwhelming bearish technical evidence supports PUT
Price at lower swing range → high probability for continuation or controlled bounce
Elevated VIX (23.66) → increased premiums, use moderate position size
Tight stop loss mitigates premium decay and oversold risk
⚠️ Risk Warning
Oversold conditions may cause sharp reversals → monitor closely
Moderate confidence → reduce position size
BTC correlation → track crypto market closely
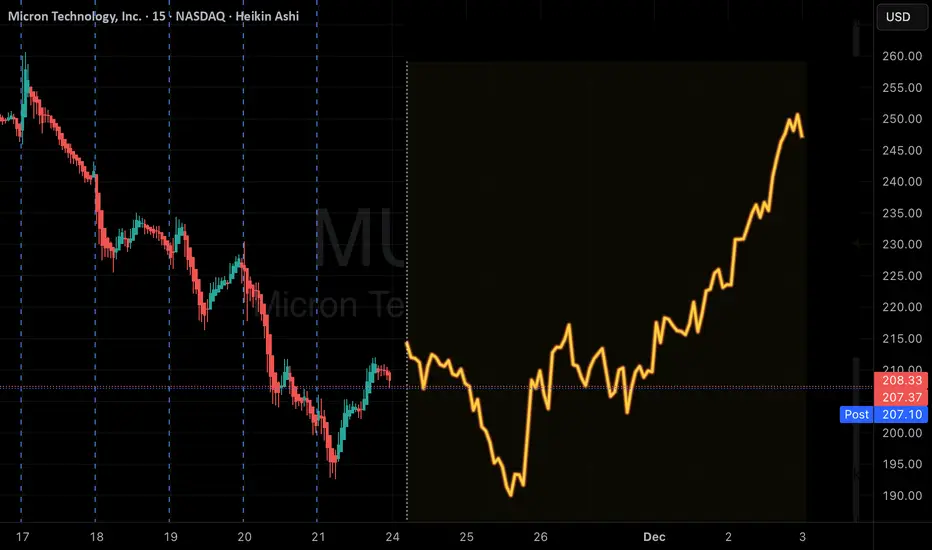
MU Trade Alert: Katy V3 Sees Late-Week UpsideMU | QuantSignals V3 Weekly Trade Alert (2025-11-21)
Signal Overview
Direction: BUY CALLS (LONG)
Confidence: 58% (Low Conviction)
Expiry: 2025-11-28 (7 days)
Strike: $212.50
Entry Price: $7.75
Target 1: $11.63 (+50%)
Target 2: $15.50 (+100%)
Stop Loss: $5.43 (-30%)
Position Size: 2% of portfolio
Market Context
Weekly Momentum: Bullish +3.64%
Flow Intel: Bearish PCR 2.31 → likely institutional hedging
Technical Support: $207.05 | Resistance: ~$230
Current Price Action: Strong late-week bullish trajectory, recovering from Nov 24 lows toward Katy target $224.11
Trade Rationale
Katy AI shows NEUTRAL overall confidence but a late-week bullish trend
PCR bearishness interpreted as hedging, not conviction, creating asymmetric opportunity
Friday gamma effects may accelerate price movement toward $224 target
Conservative sizing mitigates risk while capturing potential upside
⚠️ Risk Warning
Low Katy confidence → use small position size
Friday expiration → higher gamma risk
Mixed signals → consider scaling in cautiously
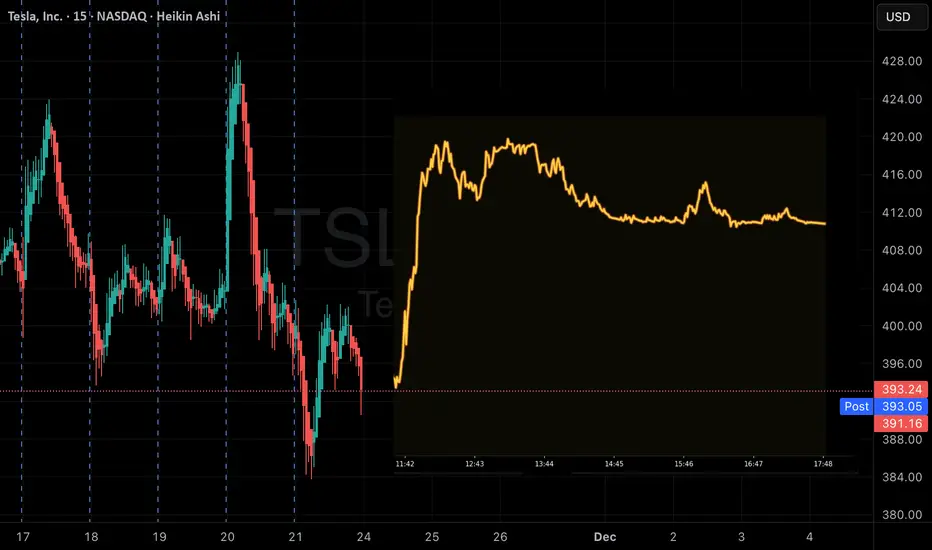
TSLA Momentum Play: QuantSignals V3 Sees Strong UpsideTSLA | QuantSignals Katy 1M Prediction (2025-11-21)
Current Price: $385.51
Predicted Close: $396.06 (+2.74%)
30-min Target: $393.15 (+1.98%)
Trend: Bullish
Confidence: 75%
Volatility: 27.4%
Trade Signal
Direction: CALL
Entry: $385.51
Target: $393.95
Stop Loss: $379.73
Expected Move: +2.74%
Summary: 1 trade signal generated from 1 successful analysis.
NVDA PUT Trade — QuantSignals Katy High-Conviction ShortNVDA | QuantSignals Katy 1M Prediction (2025-11-21)
Current Price: $178.81
Predicted Close: $173.03 (-3.23%)
30-min Target: $177.19 (-0.91%)
Trend: Bearish
Confidence: 75%
Volatility: 49.6%
Trade Signal
Direction: PUT
Entry: $178.81
Target: $174.18
Stop Loss: $181.49
Expected Move: -3.23%
Summary: 1 trade signal generated from 1 successful analysis.

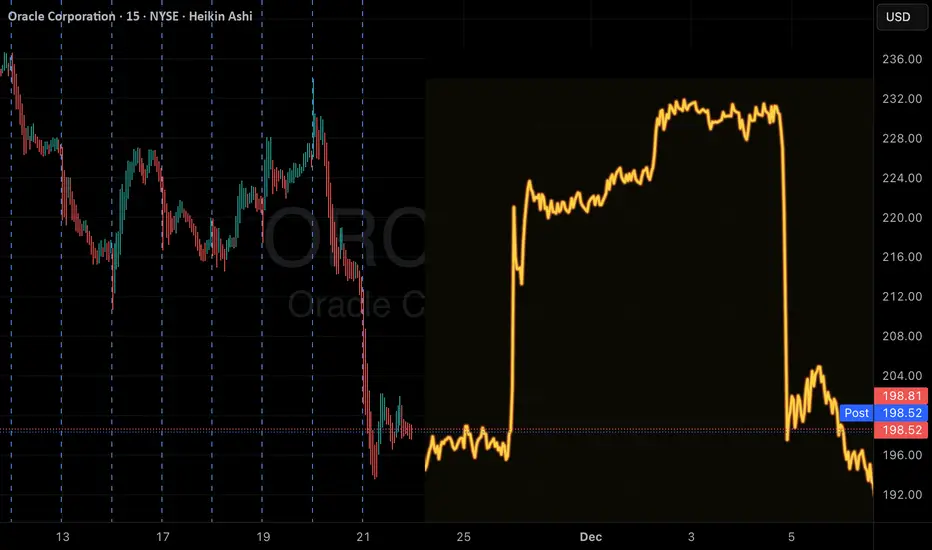
ORCL Momentum Play: Go Long with QuantSignals V3!ORCL — QuantSignals Katy (1M Prediction | 2025-11-21)
Current Price: $198.11
Predicted Close: $200.82 (+1.37%)
30-min Target: $197.64 (-0.23%)
Trend: Bullish
Confidence: 69.1%
Volatility: 113.3%
Trade Signal
• Direction: Long
• Entry: $198.11
• Target: $200.28
• Stop Loss: $195.14
• Expected Move: +1.37%