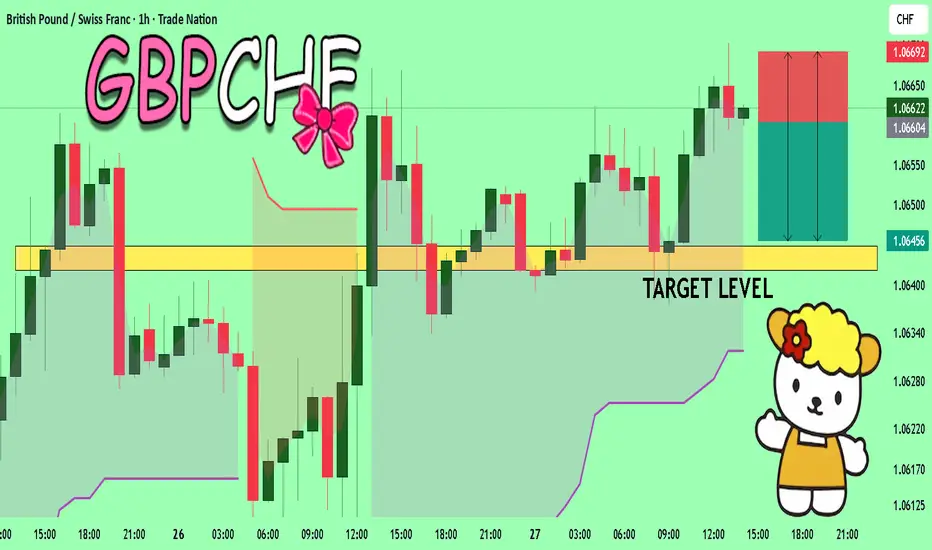
GBPCHF Set To Fall! SELL!
My dear subscribers,
GBPCHF looks like it will make a good move, and here are the details:
The market is trading on 1.0660 pivot level.
Bias - Bearish
My Stop Loss - 1.0669
Technical Indicators: Both Super Trend & Pivot HL indicate a highly probable Bearish continuation.
Target - 1.0644
About Used Indicators:
The average true range (ATR) plays an important role in 'Supertrend' as the indicator uses ATR to calculate its value. The ATR indicator signals the degree of price volatility.
Disclosure: I am part of Trade Nation's Influencer program and receive a monthly fee for using their TradingView charts in my analysis.
———————————
WISH YOU ALL LUCK
Contains image
EUR/USD Bounces From Support – Bulls Showing StrengthOn the EUR/USD 10-minute chart, price has reacted cleanly from the 1.1579 support zone, forming a bullish bounce after a sharp decline. If buyers maintain momentum, the pair could push back toward the recent highs around 1.1605–1.1615. This support level has held multiple times, making it a key zone to watch. A sustained move above current structure may confirm further upside, while a break below 1.1579 would invalidate the bullish scenario. Patience and confirmation remain essential.

DOCU: Full techniqual analysisDOCU:
.
-ABCD pattern.
-Three rising methods pattern.
-Key level and trendline, demand zone support.
-Backtest breakout zone with low supply volume.
.
US STOCKS- WALL STREET DREAM- LET'S THE MARKET SPEAK!

Gold may continue rising — Trading around 4,150–4,200 USD range📊 Market outlook:
• Spot gold is currently ~ 4,150 USD/oz
• It’s up roughly +0.20% (≈ +8 USD) over the past 24 hours.
• The increase is supported by expectations that the Federal Reserve (Fed) may cut interest rates soon, making non-yielding assets like gold more attractive.
📉 Technical view (short-term):
• Support zone: ~ 4,130 – 4,140 USD/oz — watch for retracement bounce.
• Resistance zone: ~ 4,180 – 4,200 USD/oz — a breakout could fuel further gains.
• In a low-interest environment and ongoing macro uncertainties, gold remains a safe-haven — bullish bias persists.
📌 Interpretation:
• In short-term, gold is likely to continue rising if rate-cut expectations hold.
• If U.S. economic data surprises to the upside and the Fed stays hawkish → slight correction possible.
• Current bias: upside, but sensitive to Fed and U.S. data developments.
💡 Trading Strategy:
🔺 BUY XAU/USD: 4,135 – 4,132
🎯 TP: 40 / 80 / 200 pips
🛑 SL: 4,129
🔻 SELL XAU/USD: 4,185 – 4,188
🎯 TP: 40 / 80 / 200 pips
🛑 SL: 4,192

Exchange Rate Dynamics and Fluctuations1. What Are Exchange Rates?
An exchange rate is the price of one currency expressed in terms of another. For example, if 1 USD = 83 INR, the exchange rate tells us how many Indian rupees one U.S. dollar can buy. Exchange rates are determined by supply and demand in the foreign exchange (forex) market, the largest and most liquid financial market in the world.
Currencies can either fluctuate freely based on market forces (floating exchange rates) or be controlled by governments or central banks (fixed or managed exchange rates).
2. Types of Exchange Rate Systems
a) Floating Exchange Rate
Most advanced economies, such as the U.S., U.K., Japan, and the Eurozone, use freely floating systems. Here, currencies appreciate or depreciate based on market supply and demand.
b) Fixed Exchange Rate
Some nations peg their currency to another currency, typically the U.S. dollar. The UAE and Saudi Arabia maintain such pegs. The central bank intervenes actively to maintain the peg.
c) Managed Float (Dirty Float)
Countries like India follow a managed float system. Here, the currency is mostly market-driven, but the central bank intervenes occasionally to reduce volatility.
3. Key Drivers of Exchange Rate Movements
Exchange rates do not move randomly. They follow economic logic, even if short-term movements seem volatile. Below are the major drivers:
**1. Interest Rates
Interest rates are among the most influential factors. When a country raises interest rates, foreign investors earn higher returns on its bonds and deposits. This increases demand for that currency and makes it appreciate.
Example:
If the U.S. Federal Reserve raises interest rates, the USD typically strengthens.
Emerging market currencies may weaken when the U.S. dollar strengthens due to capital outflow.
This relationship is known as interest rate parity.
**2. Inflation Levels
Low inflation generally strengthens a currency because it preserves purchasing power.
Countries with lower inflation (like Switzerland) tend to have stronger currencies.
Countries with high inflation often see their currencies weaken, as seen in Turkey or Argentina.
This concept is tied to purchasing power parity (PPP).
**3. Economic Growth and GDP Trends
Strong economic growth attracts foreign direct investment (FDI), increasing demand for the domestic currency.
For example:
India’s long-term economic growth prospects often support INR stability.
Weak economies see declines in currency demand.
**4. Trade Balance (Exports vs Imports)
If a country exports more than it imports (trade surplus), demand for its currency rises because foreign buyers must purchase its currency.
Surplus → Currency appreciation
Deficit → Currency depreciation
Japan, with large trade surpluses, often sees yen appreciation pressures during stable periods.
**5. Capital Flows and Foreign Investments
Foreign portfolio investments in stocks and bonds boost currency demand.
Example:
When FIIs invest heavily in Indian equities, INR strengthens.
When global risk rises, FIIs withdraw, weakening INR.
**6. Government Debt Levels
Countries with high public debt face higher default risk, weakening investor confidence.
High debt → Currency weakness
Low debt → Currency stability
This is why countries with strong fiscal discipline (like Germany or Singapore) have stable currencies.
**7. Speculation and Market Sentiment
Currency traders often anticipate future movements. If they expect a currency to appreciate, they buy it, leading to self-fulfilling appreciation.
Sentiment-driven moves can be volatile and disconnected from fundamentals in the short term.
**8. Geopolitical and Global Factors
Political stability strengthens currency demand; instability weakens it.
Events that trigger currency movements:
Elections
Wars
Sanctions
Trade disputes
Pandemics
For example, Russia’s ruble fell sharply after geopolitical tensions increased.
**9. Central Bank Interventions
Central banks buy or sell their currency to stabilize market conditions.
In India, the RBI:
Buys USD to weaken INR when it becomes too strong (supports exporters).
Sells USD to prevent sharp INR depreciation during crises.
Intervention smoothens volatility but does not permanently control long-term trends.
4. Short-Term vs Long-Term Exchange Rate Dynamics
Short-Term Dynamics
Short-term currency movements are driven by:
Speculation
Interest rate expectations
Day-to-day economic news
Market psychology
Risk sentiment
These fluctuations are often noisy and volatile.
Long-Term Dynamics
Long-term trends depend on:
Structural economic growth
Technological competitiveness
Productivity levels
Trade balances
Fiscal stability
These forces determine whether a currency strengthens or weakens over decades.
5. How Exchange Rate Fluctuations Affect the Economy
a) Impact on Imports and Exports
Strong currency → Cheaper imports, expensive exports
Weak currency → Costlier imports, cheaper exports
Countries often prefer a stable or slightly weak currency to support export competitiveness.
b) Impact on Inflation
Depreciation makes imported goods more expensive, increasing inflation.
This is why central banks monitor exchange rates while setting monetary policy.
c) Impact on FDI and Financial Markets
Foreign investors prefer stable currencies; volatility increases investment risk.
A sudden depreciation reduces returns for foreign investors, leading to capital outflows.
d) Impact on Tourism
A stronger domestic currency makes foreign travel cheaper.
A weaker domestic currency attracts more foreign tourists.
e) Impact on Corporate Earnings
Companies with international exposure face currency risks:
Exporters benefit from currency depreciation.
Import-dependent companies suffer when the currency weakens.
Many companies use hedging strategies such as futures and options to manage currency risk.
6. Why Exchange Rates Are So Volatile
Exchange rates fluctuate constantly because the forex market is influenced simultaneously by:
Economic data releases
Central bank speeches
Policy changes
Market sentiment
Global events
The market operates 24 hours a day, ensuring continuous adjustments.
Unlike stock markets, currency markets incorporate new information almost instantly, making them highly sensitive and liquid.
7. Modern Trends Influencing Exchange Rates
a) Algorithmic and High-Frequency Trading
Advanced algorithms react to data in milliseconds, increasing short-term volatility.
b) De-Dollarization Efforts
Countries are exploring trade in local currencies, affecting USD demand over time.
c) Digital Currencies
Central Bank Digital Currencies (CBDCs) may impact future forex markets by increasing transaction speed and transparency.
8. Conclusion
Exchange rate dynamics result from a complex interplay of macroeconomic fundamentals, market psychology, capital flows, and geopolitical developments. While long-term currency movements reflect a country’s underlying economic strength, short-term fluctuations are driven by news, speculation, and global risk sentiment. Understanding these dynamics is essential for investors, businesses, and policymakers in a globalized world. Stable exchange rates promote sustainable economic growth, while excessive volatility can disrupt trade, increase inflation, and create financial instability. As global financial integration deepens, exchange rate management will remain a key pillar of economic policy and international market behavior.
Trading Strategies and Index Investment1. Introduction: Trading vs Index Investing
Trading involves buying and selling financial instruments in shorter timeframes to profit from price fluctuations. Index investing, on the other hand, focuses on long-term wealth creation by tracking the performance of a market index like the Nifty 50, Sensex, S&P 500, or NASDAQ 100.
While traders depend on market timing, momentum, volatility, and technical setups, index investors rely on discipline, low cost, and time-driven compounding. Both approaches serve different objectives and require different skill sets.
2. Major Trading Strategies Used in Financial Markets
A. Intraday Trading
Intraday trading refers to buying and selling within the same day. Traders aim to capture small price movements and typically close all positions before the market shuts.
Key techniques include:
Breakout Trading: Entering when the price breaks above resistance or below support.
Volume and Volatility Trading: Using spikes in volume or volatility to anticipate intraday trends.
Scalping: Making multiple quick trades to profit from tiny price changes.
Skill requirement: Strong technical analysis, risk control, and emotional discipline.
B. Swing Trading
Swing trading targets price moves spanning several days to weeks. This strategy is ideal for those who want to avoid the stress of intraday noise yet prefer active participation.
Popular tools include:
Trendlines and channels
Moving averages (20-, 50-, 200-day)
RSI, MACD, Stochastic
Support-resistance zones
Swing traders capitalize on market swings that occur within broader trends.
C. Position Trading
Position traders hold assets for weeks or months, combining technical triggers with macroeconomic analysis.
Key metrics:
Interest rates
Economic cycles
Earnings growth (for equities)
Commodity cycles
This strategy suits individuals seeking medium-term returns without daily monitoring.
D. Momentum Trading
Momentum traders buy assets that are rising and sell assets that are falling. The philosophy is simple: “the trend is your friend.”
Indicators include:
Relative Strength Index (RSI)
MACD
Rate of Change (ROC)
Volume analysis
Momentum strategies perform well during strong trending markets but can suffer in sideways markets.
E. Algorithmic and Quantitative Trading
Algo trading uses computer programs to execute trades based on mathematical models. Many institutions and advanced retail traders employ:
High-frequency trading (HFT)
Statistical arbitrage
Mean reversion models
Machine learning–based systems
Algo trading removes human emotions and allows ultra-fast executions.
F. Options Trading Strategies
Options expand trading flexibility through strategies like:
Buying Calls/Puts (directional bets)
Selling Options (income generation)
Spreads (Bull Call, Bear Put, Iron Condor)
Hedging portfolios
Options allow traders to manage risk, speculate, or generate regular income.
3. Core Principles Behind Successful Trading Strategies
Regardless of strategy, certain principles determine long-term success:
A. Risk Management
The most critical factor. Traders must fix:
Stop-loss levels
Position sizing
Maximum loss per trade
Daily loss limits
Without discipline, even the best strategy fails.
B. Psychology and Emotional Control
Fear, greed, and impatience lead to poor decisions. Professional traders emphasize:
Sticking to the plan
Avoiding revenge trading
Staying consistent
Recording trades and reviewing mistakes
C. Market Structure and Trend Recognition
Understanding trends, ranges, liquidity zones, and market phases helps traders avoid confusion and noise.
D. Backtesting and Strategy Optimization
Before risking real capital, strategies must be tested on historical data. Key evaluation metrics include:
Win rate
Average return per trade
Maximum drawdown
Risk-reward ratio
4. Introduction to Index Investing
Index investing involves buying a basket of securities that track a broad market index. It is a passive investment strategy, focused on long-term wealth building without frequent buying or selling.
Examples of popular indices:
India: Nifty 50, Sensex, Nifty Next 50, Nifty Bank
Global: S&P 500, Dow Jones, NASDAQ 100, FTSE 100
Index investing is typically done through:
Index funds
Exchange-Traded Funds (ETFs)
Index-based systematic investment plans (SIPs)
5. Why Index Investing Works
A. Broad Diversification
An index spreads investment across multiple sectors and companies, reducing single-stock risk.
B. Low Costs
Since there is no active fund manager, expense ratios are much lower.
C. Long-Term Compounding
Index investing leverages time rather than timing. Markets generally rise over the long run as economies expand.
D. Consistent Performance
Most actively managed funds fail to beat major indices over long periods. Index funds often outperform because they avoid high fees and complex decisions.
6. Popular Index Investment Strategies
A. Buy and Hold
Investing a lump sum or systematically and holding for decades. Suitable for retirement and long-term goals.
B. Systematic Investment Plans (SIP)
Investing fixed amounts regularly. Benefits:
Rupee cost averaging
Disciplined investing
Emotional neutrality
C. Smart Beta Strategies
Smart beta funds track indices based on factors like:
Value
Momentum
Low volatility
Quality
Equal weight
These offer a mix of passive and active management.
D. ETF Trading and Tactical Allocation
Some investors actively buy and sell index ETFs based on:
Market cycles
Interest rates
Sector rotations
This blends trading with index investing.
7. Combining Trading Strategies with Index Investing
Many professional investors use a hybrid approach:
Core Portfolio: 60–80% in index funds/ETFs for long-term stability
Satellites: 20–40% in active trading or high-conviction positions
This maintains balance between growth and risk.
8. Final Thoughts
Trading strategies and index investing represent two ends of the investment spectrum—one active and tactical, the other passive and long-term. Traders seek to capitalize on market inefficiencies, short-term momentum, or technical signals. Index investors rely on the power of diversification, low cost, and long-term market growth.
A smart market participant understands both worlds and uses them based on their financial goals, risk tolerance, and time availability. Successful wealth creation doesn’t depend on choosing one over the other, but on aligning them intelligently with one’s personal financial roadmap.
The World Economy’s Journey in the Trading Market1. Early Foundations: The Birth of Global Trade
Modern world trade began centuries ago with land routes, maritime exchanges, and colonial expansions. However, true economic globalization began after the Industrial Revolution.
Factories produced goods at scale, and countries required raw materials, capital, and new markets. This interdependence set the foundation for a global trading web.
Key Features of Early Global Trade
Simple Trading Infrastructure: Telegraphs, ships, and railways connected markets but at slow speeds by today’s standards.
Commodity Dominance: Coal, textiles, metals, and agricultural products drove trade volumes.
Gold Standard: Most countries pegged their currencies to gold, stabilizing international trade.
Though primitive compared to today, these early systems planted the seeds for a unified world economy.
2. Post-War Growth and the Era of Financial Globalization
After World War II, nations realized that economic cooperation was essential for peace and progress. This launched institutions like:
IMF (International Monetary Fund)
World Bank
GATT → WTO (World Trade Organization)
These bodies shaped trade rules, stabilized currencies, and opened markets.
The Bretton Woods System
The global economy operated under a fixed exchange-rate regime led by the U.S. dollar pegged to gold. This stable environment helped:
Facilitate international trade
Increase capital flows
Rebuild war-torn economies
When the system collapsed in 1971, floating exchange rates emerged, giving birth to modern currency trading.
3. Rise of Capital Markets: Stocks, Commodities, and Currencies Go Global
From the 1980s onward, deregulation and technology transformed world markets.
Key Milestones
Electronic trading platforms replaced floor trading.
Multinational corporations expanded production globally.
Derivatives markets (futures, options, swaps) exploded in size.
Hedge funds, investment banks, and pension funds became major market players.
Oil, gold, and commodity futures shaped inflation and energy policies.
This period marked a fundamental shift:
Trade was no longer limited to goods; money itself became the most traded commodity.
Foreign exchange (forex) grew into a $7-trillion-a-day market, making it the largest financial market in the world.
4. Digital Revolution: The 21st Century Trading Landscape
With the rise of the internet and high-speed computing, the early 2000s launched the digital trading era.
What changed?
Algorithmic trading (algo trading) began executing trades in milliseconds.
Online brokerages democratized market access.
Financial information became instant and global.
High-frequency trading (HFT) reshaped liquidity and market volatility.
Cryptocurrencies emerged as a parallel financial system.
Mobile trading apps made stock participation mainstream.
The world economy became deeply connected: A policy change in China or a tweet from a global leader could move markets worldwide.
Key Drivers of Modern Global Trade
Technology
Capital mobility
Global supply chains
Central bank policies
Cross-border investments
This phase also brought unprecedented speed—capital could fly across continents in seconds, impacting currencies, equities, commodities, and bond markets simultaneously.
5. The Shockwaves: Crises That Reshaped Global Markets
Major global events redefined the world economy’s trading journey:
2008 Global Financial Crisis
Triggered by U.S. mortgage collapse
Nearly crashed global banking
Led to quantitative easing (QE) era
Pushed interest rates to near zero
This event emphasized how interconnected global markets had become.
COVID-19 Pandemic (2020)
Disrupted supply chains
Crashed global demand initially
Fuelled the greatest monetary stimulus in history
Caused inflation waves across the world
Financial markets experienced extreme volatility, while digital and retail trading boomed.
Russia–Ukraine Conflict
Massive impact on energy, oil, natural gas, and wheat prices
Reshaped Europe’s energy landscape
Elevated geopolitical risk across global markets
Each crisis reshaped trading behavior, capital flows, risk perception, and investor psychology.
6. The Shift to Multipolar Trading: De-globalization Begins
From 2020 onwards, a new phase began: geoeconomic fragmentation.
The world is slowly drifting away from a U.S.-centric model into a multipolar system with major players like:
United States
China
India
European Union
Middle East (as energy and investment hubs)
Emerging Trends
Friend-shoring and reshoring of supply chains
Rise of regional trade blocs
Energy transition reshaping commodity markets
Local currency trade agreements (INR, yuan, ruble)
Digital currency experimentation by central banks (CBDCs)
Countries are building self-reliance while still operating within global markets—a hybrid model of globalization.
7. The Future: Where the World Economy and Trading Market Are Heading
The journey continues as new forces redefine global trade:
A. Rise of AI-Driven Markets
Artificial Intelligence is changing how markets function:
Real-time market prediction
Automated portfolio rebalancing
Sentiment analysis through big data
Algorithmic hedging strategies
Ultra-fast execution
Trading is becoming more data-driven, precise, and automated.
B. Green Energy and Commodity Supercycles
The global shift toward renewable energy is reshaping:
Lithium
Copper
Nickel
Rare earth metals
Natural gas
These commodities are becoming the new strategic assets of the 21st century.
C. Battle of Currencies: USD vs New Regional Powers
The U.S. dollar still dominates global trade, but new challenges are rising:
China promoting yuan settlement
India increasing INR trade agreements
Middle East exploring oil trade in non-USD currencies
Digital currencies becoming part of financial networks
While the dollar remains strong, the future will likely see multiple important currencies power trade.
D. Digital Assets and Blockchain
Crypto, tokenization, and blockchain-based systems are reshaping:
Settlement speed
Transparency
Cross-border payments
Decentralized finance (DeFi)
Tokenized commodities and real-world assets
This could become the next major phase of global trading.
Conclusion: A Journey That Never Stops
The world economy’s journey in the trading market is a story of continuous evolution—driven by technology, politics, crises, and the collective ambitions of nations and markets.
From simple trade routes to AI-based trading desks, from gold-backed currencies to digital assets, and from regional markets to global interdependence—the world of trade has expanded beyond imagination.
Today’s global economy is:
Faster
More interconnected
More competitive
More volatile
More data-driven
And the journey ahead promises even greater transformation as nations redefine alliances, technology reshapes markets, and investors navigate an increasingly complex global landscape.
Commodity Super Cycle1. What Is a Commodity Super Cycle?
A commodity super cycle is a multi-decade phase of elevated commodity prices caused by structural changes in demand from rapid industrialization, technological shifts, demographic growth, or large-scale urban development. During a super cycle, commodities such as crude oil, natural gas, copper, aluminum, steel, coal, lithium, nickel, and agricultural products rise and stay at higher price levels for many years.
Commodity prices move in cycles, but a super cycle stands apart because:
It lasts much longer (10–30 years)
It reflects global economic transformation
It involves broad sectors simultaneously—not just one commodity
It pushes producer nations into economic booms
It drives inflation and reshapes global financial markets
Examples include the industrial revolution-driven cycles in the 1800s, post–World War II reconstruction, and the China-led boom in the 2000s.
2. Historical Commodity Super Cycles
(A) The Late 1800s Industrial Expansion
With the rise of the U.S., U.K., and Germany during the industrial revolution, demand for coal, steel, and metals exploded. Railways, factories, and mechanization created decades of high commodity consumption. The cycle lasted until the early 1900s.
(B) Post–World War II Reconstruction (1950–1970s)
Massive rebuilding of Europe and Japan required huge imports of steel, copper, oil, machinery, and energy. A global manufacturing boom sustained high prices.
(C) The 1970s Oil Boom
The oil embargo and supply disruptions pushed crude prices sharply higher, fueling high inflation worldwide. Energy-driven commodities surged.
(D) China-Led Super Cycle (2000–2014)
China’s unprecedented urbanization and industrialization lifted global demand for iron ore, copper, coal, cement, crude oil, and fertilizers. Prices stayed elevated for more than a decade. This cycle ended after China slowed infrastructure expansion.
3. What Triggers a Commodity Super Cycle?
A super cycle typically begins when the world undergoes a major structural transformation. Key triggers include:
(1) Industrialization & Urbanization
When economies shift from rural to urban structures, they need:
Steel for buildings
Copper for electricity grids
Energy for factories and transportation
Cement for infrastructure
China used more cement between 2011 and 2013 than the U.S. did in the entire 20th century—this is the essence of a super cycle.
Today, India, Southeast Asia, Africa, and the Middle East may become the next demand engines.
(2) Massive Technological Shifts
New technologies can drive extraordinary demand for specific commodities—for example:
Lithium, nickel, and cobalt for EV batteries
Copper for renewable grids
Rare-earth metals for electronics and defense systems
The current energy transition is a key candidate for a new super cycle.
(3) Global Population Growth
A rising population increases the need for:
Food commodities (grains, pulses, oils)
Housing (steel, cement, lumber)
Transportation (oil, metals)
Electricity (coal, natural gas, renewables)
(4) Supply Constraints
If supply cannot keep up with demand, prices remain high for years. Constraints include:
Lack of mining investment
Depletion of high-grade mineral resources
Geopolitical disruptions
Environmental regulations restricting production
Logistical bottlenecks (shipping, pipelines)
The post-2020 world has seen multiple supply challenges, intensifying commodity cycles.
4. Characteristics of a Commodity Super Cycle
A true super cycle shows distinct features:
1. Broad-Based Commodity Price Rise
It affects multiple sectors:
Energy
Base metals
Precious metals
Agricultural commodities
Not just one commodity—unlike a short-lived oil spike.
2. Long Duration
Lasts 10–30 years due to slow-moving structural reforms and capital-intensive supply side.
3. High Inflation Periods
Commodities influence global inflation. During super cycles:
Producer prices rise
Consumer inflation increases
Interest rates remain elevated
The 1970s and early 2000s saw inflationary pressure during super cycles.
4. Investment Surges in Mining & Energy
Companies increase capex massively:
New mines
New drilling fields
Infrastructure expansion
But supply expansion takes years, prolonging high prices.
5. Geopolitical Tensions
Competition for natural resources increases:
Oil politics in the Middle East
Rare earth dominance by China
Copper and lithium battles in Africa & Latin America
5. Why the World May Be Entering a New Commodity Super Cycle
Several factors suggest the possibility of a new commodity boom between 2025–2040.
(A) Global Energy Transition
The shift from fossil fuels to clean energy requires:
4X more copper per megawatt
10X more lithium for EVs
Massive rare-earth demand for wind turbines
Nickel & cobalt for battery storage
This structural shift is long-term and irreversible.
(B) Underinvestment in Mining (Last 10 Years)
Mining companies have not invested enough in new supply since the 2014 commodity crash. As a result:
Copper mines are aging
Oil discoveries are fewer
Nickel & lithium supply is insufficient for future demand
Low supply + rising demand = multi-year high prices.
(C) Multipolar Geopolitics
The world is splitting into blocs:
U.S.–Europe
China–Russia
Middle East power centers
Emerging markets
This fragmentation raises risks for supply chains, transportation, and energy markets. Commodities thrive during uncertainty.
(D) Rising Consumption from India & Africa
India is expected to become the world’s third largest economy by 2030, driving growth in steel, energy, cement, copper, and oil. Africa’s urbanization is accelerating as well.
(E) Fiscal Expansion & Infrastructure Boom
Countries are investing in:
High-speed rail
Renewable grids
Ports & highways
Urban housing
These require massive commodity inputs.
6. Impact of a Commodity Super Cycle on the Global Economy
1. Higher Inflation Globally
Commodities influence food, transportation, electricity, and housing. A prolonged price rise creates persistent inflation.
2. Shift in Global Wealth
Commodity-exporting nations benefit:
Middle East (oil, gas)
Australia (iron ore, coal)
Brazil (agri, metals)
Chile & Peru (copper, lithium)
South Africa (metals)
Import-dependent nations face pressure:
India (oil, gas)
Japan
Europe
3. Stronger Currency for Exporters
Countries exporting high-demand commodities see currency appreciation.
4. Stock Market Re-Rating
Sectors gaining:
Energy companies
Mining companies
Metal producers
Agri-business firms
Infrastructure suppliers
Sectors hurt:
Consumer goods (higher input cost)
Electronics (higher metal costs)
5. Rise of New Global Powers
Nations with critical minerals become geopolitically significant:
Lithium Triangle (Chile, Argentina, Bolivia)
Indonesia (nickel)
DR Congo (cobalt)
7. Risks That Can End a Super Cycle
Super cycles end when demand slows or supply catches up. Key risks include:
Technological change reducing commodity use
Global recession reducing demand
Major new mining discoveries
Substitution (e.g., aluminum replacing copper)
Policy shifts like carbon taxes or mining bans
However, because these changes take time, a super cycle does not collapse quickly.
Conclusion
A commodity super cycle is one of the most powerful forces shaping the global economic landscape. These long, decade-spanning cycles emerge from structural transformations like industrialization, urbanization, technological revolutions, or global energy transitions. When demand surges and supply lags, commodities rise across the board—fueling inflation, reallocating global wealth, shifting geopolitical power, and creating an entirely new investment environment.
Today’s world—driven by renewable energy transition, underinvestment in mining, rising emerging-market demand, and geopolitical fragmentation—has many of the conditions necessary for a new super cycle. Whether or not it fully materializes, the next decade will likely be dominated by commodities that form the backbone of modern civilization.

Economic Future at Risk in the Trading Market1. Heightened Market Volatility and Unpredictability
Market volatility is not new, but its frequency, magnitude, and drivers have changed. Previously, volatility was largely triggered by economic data or company earnings. Today, geopolitical shocks, pandemic-like events, cyber-attacks, and supply chain breakdowns trigger sudden movements across global markets.
High-frequency trading algorithms and automated systems amplify these movements. A minor headline can trigger billions of dollars in buying or selling within seconds, resulting in flash crashes or sharp intraday swings. This makes the trading environment more dangerous for retail traders and institutions, raising the probability of mispricing, liquidity traps, and cascading sell-offs.
2. Central Bank Tightening and the Threat of Economic Slowdown
The last decade was marked by cheap money—near-zero interest rates and quantitative easing. But inflationary pressures following the pandemic, supply chain shortages, and geopolitical tensions forced central banks (like the U.S. Federal Reserve, ECB, and RBI) to raise interest rates aggressively.
Higher interest rates bring several risks:
Reduced liquidity in equity and bond markets
Corporate borrowing costs rise, leading to lower earnings
Emerging markets face currency pressure as capital flows back to the U.S.
Real estate and financial assets lose valuation
Higher chance of recession
In a high-rate environment, every asset class—stocks, crypto, gold, bonds, real estate—faces pricing uncertainty. Traders must adapt to a world where liquidity is shrinking and capital is more expensive.
3. Geopolitical Instability Rewriting Global Trade
The global economy is undergoing a major geopolitical realignment:
The U.S.–China rivalry is disrupting technology supply chains.
Conflicts in Europe, Middle East, and Asia threaten fuel and food supplies.
Countries are prioritizing economic nationalism, reshoring factories and reducing trade dependencies.
These shifts raise costs for companies and slow down global economic growth. Markets react violently to geopolitical shocks—especially commodity markets like oil, gas, wheat, and rare earth metals. For traders, this means higher uncertainty, sudden price gaps, and the constant threat of new sanctions or regulations.
4. Currency Instability and the Fight for Dominance
Global currency markets face major instability:
The U.S. dollar is strong, creating pressure on emerging market currencies.
Multiple countries are exploring de-dollarization, challenging the global currency order.
Large nations are increasing their reserves of gold, signaling declining trust in fiat systems.
Cryptocurrencies continue rising but remain highly volatile.
When currencies fluctuate rapidly, it affects trade balances, government debt, import/export costs, and corporate earnings. Multinational companies face higher hedging costs. Investors face exchange-rate risks. For developing economies, the risk of capital flight increases, putting their economic future at risk.
5. Debt Crisis Looming Over Countries and Corporations
Global debt—government, household, and corporate—has reached historically extreme levels. Many countries borrowed heavily during the pandemic to support their economies. Now, with higher interest rates, repayment burdens are rising.
Countries at risk include:
Highly indebted developed nations
Emerging markets dependent on foreign loans
Economies struggling with weak exports or falling currency reserves
A debt default or liquidity crisis in one major economy could trigger global contagion, as seen in the 2008 financial crisis. Corporate debt is another danger—many companies now face refinancing at significantly higher interest rates, which could push weaker firms toward bankruptcy.
6. Technology Disruption, Cyber Risks, and AI-Driven Trading
Technology has always shaped finance, but today’s disruption is unprecedented:
AI-driven trading
Algorithms dominate global trading volumes, making markets move faster and sometimes more irrationally. Errors, bugs, or miscalculations in algorithms can cause massive volatility.
Cyber-attack risks
Financial markets are prime targets for cyber warfare. A major breach on a stock exchange, bank, or clearinghouse could disrupt global markets instantly.
Blockchain instability
Crypto markets add another layer of uncertainty, with regulatory crackdowns, exchange failures, and price manipulation affecting investor confidence.
While technology brings efficiency, it also introduces systemic fragility, where one failure can ripple across markets.
7. Commodity Shock Risks: Energy, Metals, and Food
Commodity markets are extremely sensitive to global shocks:
Oil and gas supply disruptions raise costs worldwide.
Climate change affects crop yields, increasing food prices.
Rare earth and metal shortages disrupt technology and electric vehicle industries.
When commodities spike, inflation rises. When they crash, exporting nations suffer revenue losses. Both extremes create economic instability, affecting stock markets, currency markets, and global trade.
8. Climate Change and the Cost of Environmental Disasters
Climate risks are now financial risks. Extreme weather events—floods, droughts, heatwaves, storms—directly impact national economies and trading markets:
Agricultural output drops
Insurance costs surge
Supply chains break
Infrastructure is damaged
Energy demands rise
Climate-related losses already cost trillions globally. As environmental disasters increase, financial assets that depend on stability become more vulnerable.
9. Social and Political Instability Threatening Economic Confidence
Economic inequality, unemployment, and inflation often lead to social tensions. Political unrest can weaken investor confidence, reduce foreign investment, and derail economic growth. Countries facing internal instability often see:
Capital outflows
Currency depreciation
Stock market decline
Increased borrowing costs
Such scenarios make long-term planning difficult for traders and investors.
10. Psychological and Behavioral Risks in Trading
Human behavior plays a crucial role in market dynamics. The modern era has amplified emotional trading:
Social media influences market sentiment
FOMO-driven trading causes bubbles
Panic selling creates flash crashes
Retail traders follow trends without risk management
This irrational behavior increases systemic vulnerability. When millions follow the same emotional trend, markets lose stability.
Conclusion: Navigating a Future Filled With Risk
The economic future is undeniably at risk due to converging forces: geopolitical conflict, technology disruption, debt burdens, climate change, currency instability, and behavioral volatility. The trading market reflects these tensions in the form of rapid price swings, liquidity shocks, and unpredictable cycles.
However, risks also create opportunities. Traders and investors who focus on diversification, risk management, macro insights, and disciplined strategy can thrive even in turbulent times. The key is understanding that the future will not resemble the stability of previous decades. Instead, success depends on adapting to a world defined by uncertainty, speed, and global interconnectedness.
Global Finance and Central Control1. The Architecture of Global Finance
The modern global financial system is built on several interconnected layers:
a) International Financial Markets
These include:
Foreign exchange (Forex) markets where currencies are traded.
Global bond markets where governments and corporations borrow.
Equity markets where companies raise capital.
Derivatives markets where risk is traded through futures, options, and swaps.
These markets operate almost 24/7 and link every financial center—New York, London, Tokyo, Singapore, Dubai, Frankfurt.
b) Cross-Border Capital Flows
Capital moves across borders in the form of:
Foreign direct investment (FDI)
Portfolio investments in stocks and bonds
Bank lending
Remittances
Trade financing
These flows allow nations to grow, but they also expose countries to global shocks.
c) Financial Institutions
The key pillars include:
Global banks (JPMorgan, HSBC, Citi, Standard Chartered)
Multinational corporations
Pension funds and sovereign wealth funds
Hedge funds and private equity
Central banks and regulatory bodies
Together, these institutions shape how money circulates globally.
2. The Rise of Central Control in Global Finance
Although global finance appears “free-flowing,” it is not without central oversight. Control is exerted in three broad ways:
A. Central Banks: The Nerve Centers of Financial Power
Central banks are the most powerful financial institutions within countries, but their influence spills into global markets.
Key Functions
Set interest rates that influence global borrowing.
Control money supply and liquidity.
Stabilize inflation and currency value.
Act as lenders of last resort during crises.
Global Impact
When the Federal Reserve (US) raises or cuts rates, the effects cascade worldwide:
Global investors shift capital.
Emerging-market currencies rise or fall.
Commodity prices fluctuate.
Debt burdens in dollar-dependent nations increase or ease.
Similarly, the European Central Bank (ECB), Bank of England, and Bank of Japan impact global liquidity and yield curves.
In this sense, global finance is not only shaped by markets but by centralized monetary decisions from a handful of powerful institutions.
B. International Financial Institutions (IFIs)
These include:
International Monetary Fund (IMF)
World Bank
Bank for International Settlements (BIS)
Financial Stability Board (FSB)
Their Role in Central Control
1. The IMF
Provides emergency loans, sets macroeconomic rules, and monitors global financial stability. Countries receiving IMF support must often adopt conditions such as:
Fiscal tightening
Structural reforms
Currency adjustments
This creates a form of policy influence over sovereign nations.
2. The World Bank
Finances development projects and shapes the economic policies of emerging markets through program design and conditional funding.
3. The BIS
Known as the “central bank of central banks,” the BIS sets global banking norms through the Basel accords:
Basel I: Capital requirements
Basel II: Risk management
Basel III: Liquidity and leverage rules
These rules unify how banks operate across the world.
4. Financial Stability Board (FSB)
Coordinates global regulators and sets standards for the world’s largest banks and financial institutions.
C. Regulatory and Political Control
Global finance is also influenced by:
Government fiscal policies
Trade agreements
Sanctions and geopolitical decisions
Financial regulations (AML, KYC, FATF rules)
The Power of Sanctions
The U.S., EU, and UN often use financial sanctions to control, punish, or pressure countries.
Sanctions affect:
Banking access (SWIFT restrictions)
Global payments
Trade receipts
Ability to borrow internationally
This highlights how finance becomes a tool of geopolitical influence.
3. The USD-Centric Financial Order
The U.S. dollar is the anchor of global finance:
60% of global reserves
88% of all FX transactions
50%+ of global trade invoicing
This dominance gives the U.S. unparalleled financial power:
It influences global liquidity via Fed policy.
It controls access to dollar clearing.
It sets global borrowing costs.
It can impose financial sanctions with global impact.
In short, the dollar system is a centralized backbone of global finance.
4. Technology and the Future Centralization of Finance
Digital innovation is transforming financial control.
A. Central Bank Digital Currencies (CBDCs)
Many countries—including China, India, the EU, and the U.S.—are researching or piloting CBDCs.
Implications
Real-time monetary policy tools
Greater surveillance of transactions
More control over taxation and fiscal distribution
Potential reduction in cash usage
Cross-border settlement improvements
CBDCs strengthen central authority and expand the scope of financial oversight.
B. Digital Payments & Fintech Networks
Platforms like:
UPI (India)
PayPal
SWIFT gpi
Visa/Mastercard
RippleNet
Crypto exchanges
These networks process billions of transactions daily. While they make finance efficient, they also consolidate control within digital ecosystems.
C. Cryptocurrencies and Decentralized Finance (DeFi)
Crypto represents the opposite of central control:
No central intermediary
Blockchain-based transparency
Peer-to-peer value transfer
However, regulators are increasing oversight on:
Exchanges
Stablecoins
DeFi protocols
On- and off-ramps
This means even decentralized systems are gradually being integrated back into the centrally regulated financial order.
5. The Tension Between Free Markets and Central Control
Global finance operates under constant tension:
Free Market Forces
Capital flows to high-return markets.
Traders respond to price signals.
Currency values fluctuate.
Central Controls
Interest rate decisions
Capital controls
Sanctions
Regulatory requirements
Monetary interventions
The global system depends on maintaining a balance between these forces.
Too much freedom leads to speculative bubbles and crises.
Too much central control restricts innovation and creates financial rigidity.
6. Crises and the Need for Central Coordination
Major financial crises have shown why central coordination is essential:
1997 Asian Financial Crisis
Massive capital flight destabilized multiple economies.
2008 Global Financial Crisis
The collapse of U.S. mortgage markets triggered global recession.
2020 Pandemic Shock
Central banks injected unprecedented liquidity to prevent collapse.
During crises, free markets alone cannot stabilize the system—central intervention becomes indispensable.
7. The Direction of Global Finance Going Forward
The future will be shaped by three trends:
1. Increasing Centralization
CBDCs
Stronger regulatory norms
Coordinated global oversight
Tighter cross-border monitoring
2. Multipolar Financial Power
Rise of China’s yuan
India’s rapid economic growth
Regional currency arrangements
Asian, Middle Eastern, and African financial alliances
3. Hybrid Financial Models
Mix of centralized control (CBDCs, regulations) and decentralized innovation (blockchain, tokenized assets).
Conclusion
Global finance is a vast, interconnected system shaped by markets, institutions, and powerful central actors. Central banks, the IMF, World Bank, BIS, and regulatory bodies exercise significant control over capital movement, banking standards, and financial stability. At the same time, digital transformation—from CBDCs to fintech—will increase central oversight while creating new tensions with decentralized technologies like crypto.
In essence, global finance is both free-flowing and centrally influenced, a system where market dynamics meet institutional power. Understanding this balance is essential to understanding how the world’s economic engine truly works.
Emerging Markets and Capital Flows1. Understanding Emerging Markets
Emerging markets are economies transitioning from low-income, resource-driven systems to more advanced, industrialized, and service-oriented structures. They typically share the following characteristics:
Key Features
High economic growth rates compared to developed nations.
Rapid urbanization and industrial expansion.
Significant reliance on foreign investment to finance growth.
Developing but fragile financial markets—often shallow and prone to volatility.
Exposure to global economic cycles, interest rate changes, and commodity price shocks.
Growing consumer market, driven by rising incomes and demographic strength.
These characteristics make EMs attractive but risky destinations for global capital.
2. What Are Capital Flows?
Capital flows refer to the movement of money for investment, trade, or business production across countries. For emerging markets, capital flows are critical because they influence:
Exchange rates
Interest rates
Stock and bond markets
Inflation
Economic growth
Financial stability
Capital inflows bring liquidity and strengthen markets, while outflows pressure currencies and reduce investment capacity.
3. Types of Capital Flows in Emerging Markets
Global investors participate in EMs through several channels:
A. Foreign Direct Investment (FDI)
FDI involves long-term investments such as setting up factories, acquiring companies, or building infrastructure. It is the most stable form of capital because:
It creates employment
It brings technology
It enhances productivity
It is less likely to exit during short-term crises
Countries like India, Vietnam, and Mexico have become major FDI destinations due to manufacturing expansions and favourable government policies.
B. Foreign Portfolio Investment (FPI)
Portfolio flows include investments in:
Stocks
Bonds
Mutual funds
ETFs
These are short-term and highly sensitive to global interest rates, sentiment, and liquidity conditions.
FPI can rapidly enter during bullish periods and exit during uncertainty, making it the most volatile category of capital flows.
C. External Commercial Borrowings (ECB)
Corporates or governments borrow from international lenders to fund:
Infrastructure projects
Expansion plans
Government spending
While ECB helps meet capital needs, excessive borrowing increases external debt vulnerability.
D. Remittances
Large EMs like India, Philippines, and Mexico receive significant remittances from workers abroad. Remittances are stable, counter-cyclical, and support domestic consumption.
4. Why Do Capital Flows Move Toward Emerging Markets?
Global investors allocate funds to EMs due to:
1. Higher Returns on Investment
Emerging markets often offer:
Higher GDP growth
Better corporate earnings prospects
Attractive bond yields
In a low-yield world, EM assets become appealing.
2. Demographic Advantage
A young population drives consumption growth, expanding market opportunities.
3. Structural Reforms
Privatization, tax reforms, digitalization, and financial sector improvements attract long-term capital.
4. Commodity Cycles
Resource-rich nations (Brazil, Indonesia, South Africa) attract capital during commodity booms.
5. Currency Appreciation Potential
Investors earn not only from market returns but also from appreciating EM currencies during stable periods.
5. What Drives Capital Outflows from Emerging Markets?
While inflows bring optimism, outflows can trigger crises. Key drivers include:
1. Global Interest Rate Changes (Especially U.S. Rates)
When U.S. Federal Reserve raises interest rates:
Dollar strengthens
EM currencies weaken
Investors shift funds from EM to U.S. Treasuries
This “flight to safety” drains EM liquidity.
2. Financial Market Uncertainty
Events such as:
Emerging market debt crises
Stock market corrections
Currency depreciation
cause rapid portfolio outflows.
3. Geopolitical Risks
Wars, political instability, elections, sanctions, or policy unpredictability scare investors.
4. Commodity Price Volatility
Commodity exporters suffer when global prices fall, leading to foreign investor exit.
5. Strong U.S. Dollar
A rising dollar increases external debt burden for EMs and triggers outflows.
6. Effects of Capital Flows on Emerging Markets
Capital flows influence economic conditions in both positive and negative ways.
Positive Effects
1. Boosts Investment and Growth
Foreign capital funds:
Infrastructure
Manufacturing
Real estate
Technology
Financial markets
This accelerates economic development.
2. Supports Domestic Currency
Stable inflows strengthen the currency, reducing import costs.
3. Improves Financial Market Depth
Foreign investors increase liquidity in equity and bond markets, making them more efficient.
4. Enhances Global Integration
Capital flows link EMs to global markets, improving trade and investment relationships.
Negative Effects
1. Currency Volatility
Sudden outflows weaken the currency and may cause inflation.
2. Asset Bubbles
Excessive inflows inflate stock or real estate prices beyond fundamentals.
3. External Debt Vulnerability
Borrowing in foreign currency exposes countries to refinancing risk.
4. Financial Instability
Rapid outflows may trigger:
Banking crises
Balance of payment issues
Market crashes
Examples include the Asian Financial Crisis (1997) and the taper tantrum (2013).
7. Managing Capital Flows: Policy Tools for Emerging Markets
Emerging markets adopt a mix of strategies to handle capital flow volatility:
1. Foreign Exchange Reserves
Holding adequate FX reserves helps protect the currency during outflows.
2. Macroprudential Regulations
Governments may impose:
Limits on external borrowing
Controls on short-term capital
Banking sector leverage caps
These reduce systemic risk.
3. Flexible Exchange Rates
Allowing currencies to adjust absorbs external shocks.
4. Fiscal Discipline
Lower deficits improve investor confidence.
5. Encouraging FDI Over FPI
FDI is stable and long-term; EMs design policies to attract more of it.
6. Bilateral and Multilateral Financing
Partnerships with IMF, World Bank, or regional groups provide safety nets.
8. The Future of Capital Flows in Emerging Markets
As global financial systems evolve, several future trends are shaping the trajectory of capital flows:
1. Digitalization and Fintech Growth
Digital economies like India and Indonesia will attract tech-focused FDI.
2. Nearshoring and Supply Chain Shifts
Companies shifting production away from China will benefit economies like Vietnam, Mexico, and India.
3. Sustainable Investing
Green bonds and ESG funds are rising, diverting inflows to climate-friendly EM projects.
4. Rising Domestic Capital Markets
Local investors are becoming strong players, reducing dependence on foreign flows.
Conclusion
Emerging markets and capital flows are deeply interconnected. EMs depend on global capital for growth and development, while investors depend on EMs for higher returns. However, this relationship is inherently volatile. Inflows boost growth, strengthen currencies, and deepen financial markets, but outflows can cause instability, pressure exchange rates, and trigger crises.
Managing capital flows through sound policies, stable governance, and long-term reforms is essential for sustained growth. As the world undergoes technological transformation, shifting supply chains, and changing geopolitical dynamics, emerging markets will continue to be central to global investment flows—offering both opportunities and risks in equal measure.
Bullish ScenarioBroke out of downtrend ✔️
Pullback to yellow line is expected ✔️
Hold above yellow line = bullish ✔️
Next targets are 6,953 → 7,026 → 7,070+ ✔️

Bearish Scenario – ES Futures (BurakTheScalper)The chart shows a clear 3-tap rejection off the descending upper channel (orange arrows). Each touch has produced a lower high, confirming seller control at the channel top.
Price has now completed another full ABC corrective leg and is repeating the pattern of:
Lower High → Sharp Selloff → Channel Bottom Test
We are currently at the third rejection, which historically has been the strongest in a descending channel because:
✔️ Sellers defend the trendline aggressively
✔️ Liquidity builds above the 3rd touch → fuel for downside
✔️ Momentum typically shifts down sharply after the 3rd tap
If the pattern continues, ES is lined up for a full bearish leg toward the lower boundary of the channel.

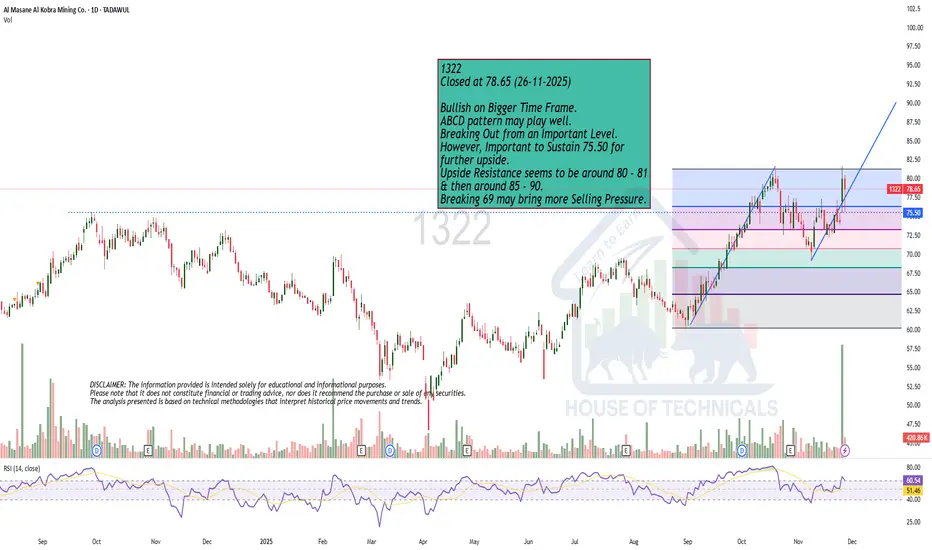
Bullish on Bigger Time Frame.1322
Closed at 78.65 (26-11-2025)
Bullish on Bigger Time Frame.
ABCD pattern may play well.
Breaking Out from an Important Level.
However, Important to Sustain 75.50 for
further upside.
Upside Resistance seems to be around 80 - 81
& then around 85 - 90.
Breaking 69 may bring more Selling Pressure.
QGEN🌎 Qiagen N.V. is a Dutch holding company and global provider of molecular diagnostics and life sciences solutions.
Core activities:
Sample processing technologies: Extraction and processing of DNA, RNA, and proteins from blood, tissue, and other materials.
Analysis technologies: Preparation of biomolecules for analysis.
Bioinformatics: Software and knowledge bases for data interpretation and practical applications.
Key products and platforms:
QuantiFERON: A test for the diagnosis of latent tuberculosis
QIAstat-Dx: A syndromic testing system for the simultaneous detection of a broad range of pathogens
QIAcuity: A digital PCR system
QIAGEN Digital Insights (QDI): A bioinformatics division
The company serves more than 500,000 customers worldwide in the life sciences (academic institutions, pharmaceutical R&D, forensic medicine) and molecular diagnostics.
In the second quarter of 2025, revenue reached $533.54 million, exceeding the consensus estimate.
The company expects to achieve its mid-term adjusted operating margin target of 31% by 2025, above its initial 2028 guidance.
Management increased its full-year 2025 adjusted earnings per share guidance to approximately $2.35 per year from the previous $2.28.
In 2025, Qiagen received CE-IVDR certification for its entire QIAstat-Dx portfolio in Europe and US FDA approval for the QIAstat-Dx Rise system.
The stock is trading broadly sideways at the upper end of the channel.

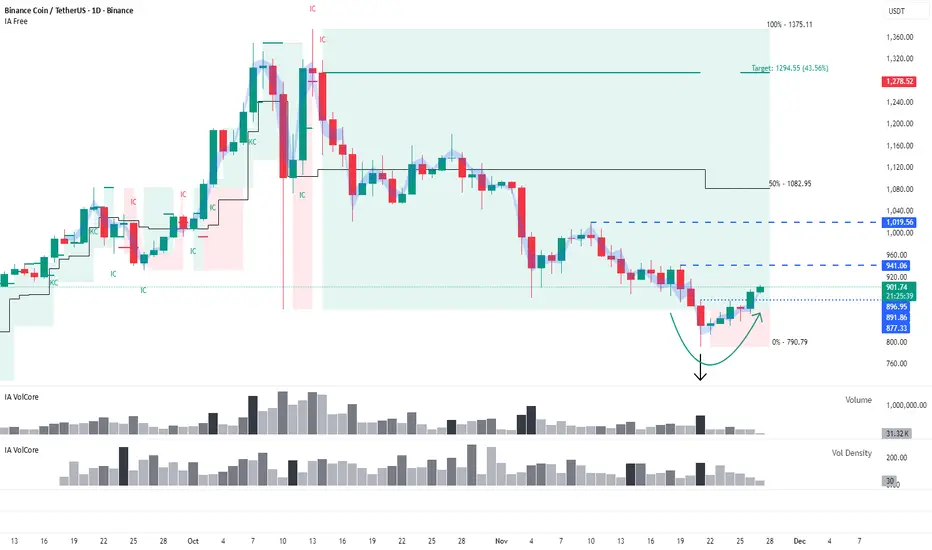
BNB: Long setups remain a priorityBuyers may still show strength despite the lack of interaction with a key level.
This analysis is based on the Initiative Analysis (IA) method.
Hello traders and investors!
On the daily timeframe, the market is in a sideways range, and a false-break pattern of the lower boundary has formed.
We see a seller’s attack on volume at the level, followed by a bullish absorption of the attack candle.
There is one detail: during the formation of this pattern, the price stopped roughly 11 dollars short of the 50% level of the monthly trading range.
Even with this nuance, the long scenario remains valid.
The first target is 941.
Wishing you profitable trades!
QuantSignals V3 | Katy AI Contrarian MSTR Weekly PUT QuantSignals V3 Weekly Date: 2025-11-26
Current Price: $179.00
Weekly Momentum: Bullish (+4.27%)
Flow Intel: Bearish (PCR 6.20)
Trend: Mixed / Conflict
Trade Signal: PUT
Recommended Strike: $175.00
Entry Range: $1.91 – $2.05
Target 1: $3.50 (75% gain)
Target 2: $4.50 (125% gain)
Stop Loss: $1.20 (40% loss)
Confidence: 58%
Position Size: 2% of portfolio
Expiry: 2025-11-28 (2 days)
Analysis Summary:
Katy AI predicts a bearish trajectory (-1.32%) with 168-point prediction series showing consistent downside momentum.
Overbought RSI at 81.6 and 86% of weekly range high suggest potential reversal.
Contradiction exists: Weekly momentum bullish but Katy AI and extreme PCR indicate bearish pressure.
Options flow shows heavy institutional put buying (PCR 6.20).
Risk level: Medium-High due to conflicting signals.
Key Notes:
Tight 2-day expiry limits time decay risk.
Conservative stop protects against unexpected bullish breaks above $181.68.
High-risk trade—use small position size due to uncertainty.

NetApp (NASDAQ: $NTAP) Stock: Q3 Beat, Shares SlideNetApp Inc. (NASDAQ: NASDAQ:NTAP ) fell over 4% in early trading despite posting Q3 CY2025 results that exceeded expectations. Shares opened at $108.92 as investors focused on softer forward revenue guidance rather than the quarter’s operational strength. While the company delivered solid margin performance and raised full-year EPS guidance, growth signals remain modest, creating a mixed reaction.
Q3 revenue grew 2.8% year over year to $1.71 billion, beating estimates by 1.1%. Adjusted EPS reached $2.05, up from $1.87 last year and an 8.8% beat against consensus. Management reaffirmed full-year revenue expectations of $6.75 billion and lifted full-year EPS guidance to $7.90 at the midpoint. Operating margin expanded to 23.4%, improving 2.6 percentage points and reflecting tight cost controls. Free cash flow margin held steady at 4.6%, reinforcing stability.
NetApp’s previous Q2 GAAP results also showed progress. GAAP EPS rose to $1.51 from $1.42, while revenue climbed 2.8% to $1.705 billion. For the upcoming quarter, the company guided revenue to $1.615–$1.765 billion and EPS to $2.01–$2.11, slightly below market expectations. Full-year projections call for revenue between $6.625 and $6.875 billion and EPS between $7.75 and $8.05.
Long-term trends highlight consistency rather than acceleration. NetApp delivered a 3.7% revenue CAGR over five years and 4.3% over the past two years. Analysts expect 4.4% growth next year, signaling stability but limited upside. However, profitability remains a clear strength. The company averaged 19.3% operating margin over five years and continues to improve efficiency.
EPS growth remains robust, with a five-year CAGR of 12.5% and two-year growth of 14.9%. NetApp’s disciplined execution supports strong earnings even as revenue growth stays modest.
Technical Outlook:
NTAP is testing key support at $108. A breakdown and close below this zone could open room toward the $84 ascending trendline. Resistance sits at $135, where bullish momentum must reclaim control.

Deere & Company (NYSE: $DE) Stock: Q3 Drop After Earnings Deere & Company (NYSE: NYSE:DE ) traded sharply lower after releasing Q3 CY2025 results that showed strong revenue growth but weakening margins and softer forward guidance. The stock closed at $498.13 and dropped more than 5% after market open, falling to $478.78 pre-market. Management cut full-year earnings expectations, signaling continued pressure across agriculture and construction markets.
Revenue for Q3 reached $12.39 billion, beating estimates and rising 33.6% year over year. EPS of $3.93 also topped expectations but declined from $4.55 last year, highlighting ongoing cost pressures. Deere reduced its FY25 earnings outlook to $4.00–$4.75 billion, well below the market’s $5 billion expectation. Executives cited slow demand, elevated inventory levels, and weakness in large-equipment spending.
Long-term trends show deceleration. Revenue grew at 5.4% annually over the last five years, but the past two years saw declines of 14.4% annually. All segments—Production & Precision Agriculture, Construction & Forestry, and Small Agriculture & Turf—posted year-on-year revenue drops. Despite this, the latest quarter showed a recovery in activity, and analysts expect 14% revenue growth next year.
Margins remain a concern. Deere’s five-year average operating margin of 19.9% narrowed significantly. Q3 margin fell to 10.9%, down from 15.6% a year ago. Free-cash-flow margin also tightened sharply, falling from 47.4% to 14.3%. While buybacks helped EPS growth over the past decade, earnings have weakened for two consecutive years.
Management expects FY26 to mark the bottom of the agriculture cycle, projecting net income of $4.00–$4.75 billion. Markets reacted cautiously as guidance cut overshadowed the Q3 beat.
Technically, DE trades around $471 near an ascending trendline. Key support sits at $413, while major resistance remains at $533. A breakout above $533 would confirm recovery momentum.

QuantSignals V3 | SPY Speculative Call SetupSPY QuantSignals Katy 1M Prediction 2025-11-26
Current Price: $681.33
Target: $685–688 (short-term, based on recent resistance & trend)
Stop Loss: $678 (below immediate support)
Time Horizon: 1–3 days (since Katy AI shows low confidence and small expected move)
Rationale:
Katy AI shows NEUTRAL with low confidence (46.4%), meaning the AI isn’t strongly bearish—so a small bullish bias could play out.
Overall market sentiment (VIX ~20) suggests low-moderate volatility.
Small position sizing recommended due to low conviction.
⚠️ Risk Warning:
Low predicted movement means the probability of hitting your target is modest.
Short expiry or small move can result in quick losses if SPY dips even slightly.
Only allocate a small portion of your portfolio to this speculative call.

Beautiful HH HL. ICL
Closed at 148.84 (26-11-2025)
Beautiful HH HL.
Bearish Divergence has dragged the price down.
However, if 137 is not broken, we may witness
another upside; initially 160 then 170.

ANDNZD WILL FALL|SHORT|
✅AUDNZD has broken down from the higher-timeframe supply with strong displacement, confirming bearish order-flow. A shallow corrective retrace may form before algos drive price toward the next sell-side liquidity target below. Time Frame 3H.
SHORT🔥
✅Like and subscribe to never miss a new idea!✅

USDCAD Expected Growth! BUY!
My dear friends,
USDCAD looks like it will make a good move, and here are the details:
The market is trading on 1.4039 pivot level.
Bias - Bullish
Technical Indicators: Supper Trend generates a clear long signal while Pivot Point HL is currently determining the overall Bullish trend of the market.
Goal - 1.4080
About Used Indicators:
Pivot points are a great way to identify areas of support and resistance, but they work best when combined with other kinds of technical analysis
Disclosure: I am part of Trade Nation's Influencer program and receive a monthly fee for using their TradingView charts in my analysis.
———————————
WISH YOU ALL LUCK
