EURJPY A Fall Expected! SELL!
My dear friends,
EURJPY looks like it will make a good move, and here are the details:
The market is trading on 181.10 pivot level.
Bias - Bearish
Technical Indicators: Supper Trend generates a clear short signal while Pivot Point HL is currently determining the overall Bearish trend of the market.
Goal - 180.59
Recommended Stop Loss - 181.39
About Used Indicators:
Pivot points are a great way to identify areas of support and resistance, but they work best when combined with other kinds of technical analysis
Disclosure: I am part of Trade Nation's Influencer program and receive a monthly fee for using their TradingView charts in my analysis.
———————————
WISH YOU ALL LUCK
Contains image

EURAUD Technical Analysis! SELL!
My dear subscribers,
EURAUD looks like it will make a good move, and here are the details:
The market is trading on 1.7884 pivot level.
Bias - Bearish
Technical Indicators: Both Super Trend & Pivot HL indicate a highly probable Bearish continuation.
Target - 1.7835
About Used Indicators:
The average true range (ATR) plays an important role in 'Supertrend' as the indicator uses ATR to calculate its value. The ATR indicator signals the degree of price volatility.
Disclosure: I am part of Trade Nation's Influencer program and receive a monthly fee for using their TradingView charts in my analysis.
———————————
WISH YOU ALL LUCK

ANDNZD WILL FALL|SHORT|
✅AUDNZD has broken down from the higher-timeframe supply with strong displacement, confirming bearish order-flow. A shallow corrective retrace may form before algos drive price toward the next sell-side liquidity target below. Time Frame 3H.
SHORT🔥
✅Like and subscribe to never miss a new idea!✅

BNB broke major Resistance ---> Above 1000$ asapAs observed on the BNBUSDT chart, the price has decisively broken above a significant daily trendline, indicating a potential shift in market structure. This breakout suggests strengthening bullish momentum, and if supported by increased volume and sustained buying pressure, a retest of the $1,000 resistance level appears increasingly likely. Traders should monitor for confirmation through follow-through price action and volume expansion to validate the continuation of this upward movement.
DISCLAIMER: ((trade based on your own decision))
<<press like👍 if you enjoy💚

USDCAD Expected Growth! BUY!
My dear friends,
USDCAD looks like it will make a good move, and here are the details:
The market is trading on 1.4039 pivot level.
Bias - Bullish
Technical Indicators: Supper Trend generates a clear long signal while Pivot Point HL is currently determining the overall Bullish trend of the market.
Goal - 1.4080
About Used Indicators:
Pivot points are a great way to identify areas of support and resistance, but they work best when combined with other kinds of technical analysis
Disclosure: I am part of Trade Nation's Influencer program and receive a monthly fee for using their TradingView charts in my analysis.
———————————
WISH YOU ALL LUCK

EURUSD soon price will gain strength to pump As we can see price did dump hard after green trendline broke:
Also now we can expect more range near the yellow support zone or beginning of pump to the target from here or from green trendline support zone like what is mentioned with green arrow and soon 1.2200 can hit.
DISCLAIMER: ((trade based on your own decision))
<<press like👍 if you enjoy💚

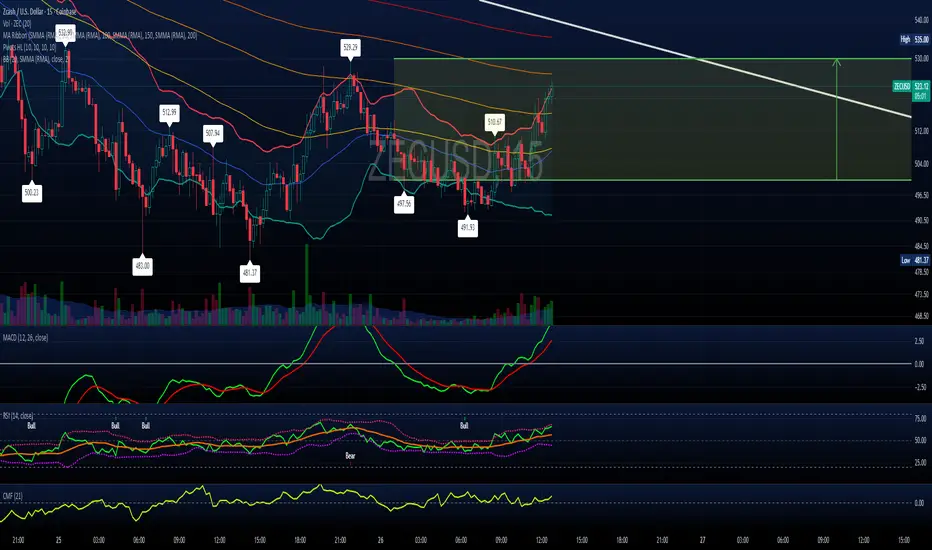
ZECUSDT at least 650$ soon will hit againAs observed on the chart, ZECUSDT is demonstrating renewed strength near the $500 support level, suggesting a potential corrective rebound toward the $650 resistance zone. However, this level represents a significant technical barrier where historical selling pressure has emerged.
A decisive breakout above $650, supported by strong volume and sustained buying momentum, would be required to validate further upward movement. Conversely, a breakdown below the $500 support level would indicate a failure of the current bullish structure, potentially triggering a deeper correction toward the $220 level, which aligns with the next significant support zone on higher timeframes.
Traders should monitor price action around these key levels with appropriate risk management strategies.
DISCLAIMER: ((trade based on your own decision))
<<press like👍 if you enjoy💚

SOL first target 200$ and only after breakout 300$As observed on the chart, SOLUSDT has demonstrated significant resilience at the major daily support zone near $110, establishing a solid foundation for the current upward movement. The path toward the $200 resistance level appears well-defined, with the asset showing strong bullish momentum.
However, to advance beyond this level, a decisive breakout above the $200 resistance accompanied by substantial trading volume will be essential. Such a confirmation would signal sustained buying pressure and potentially open the path toward higher targets, with $300 emerging as the next significant technical objective. Until then, the $200 level remains a critical barrier that requires validation before anticipating further expansion.
DISCLAIMER: ((trade based on your own decision))
<<press like👍 if you enjoy💚

EUR-AUD Demand Level Ahead! Buy!
Hello,Traders!
EURAUD is approaching the horizontal demand after sweeping sell-side liquidity, hinting at early accumulation. If bullish intent confirms, expect a move toward the next buy-side liquidity target above. Time Frame 3H.
Buy!
Comment and subscribe to help us grow!
Check out other forecasts below too!
Disclosure: I am part of Trade Nation's Influencer program and receive a monthly fee for using their TradingView charts in my analysis.

USDJPY bullish target is 159.00 and soon will hit As accurately anticipated in our previous technical assessment, USDJPY has executed a decisive breakout above key trendline resistance, confirming the initiation of a bullish impulse. The measured move following this technical breakout suggests a minimum continuation target of more +300 pips, with the 159.00 level serving as the primary technical objective. Traders should monitor momentum indicators and price action near this level for potential consolidation or extension patterns.
DISCLAIMER: ((trade based on your own decision))
<<press like👍 if you enjoy💚

XLMUSDT near major trendline breakout and 50% pumpTechnical analysis of XLM reveals a compelling pattern analogy. Historically, the asset demonstrated a decisive breakout above a daily trendline resistance, which preceded approximately 100% appreciation. Currently, XLM is consolidating near a newly formed daily trendline within a broader range-bound market structure.
We identify two primary probabilistic scenarios:
Bullish Case (70% Probability): A successful breakout above the current trendline resistance could catalyze an upward impulse toward the $0.40 resistance level, representing approximately +50% appreciation from current levels.
Bearish Case (30% Probability): Conversely, a breakdown below the critical $0.20 support level would invalidate the bullish thesis, potentially triggering a downward move toward -50% from current valuation.
The higher probability weighting toward the bullish scenario reflects the historical pattern repetition and current consolidation characteristics, though traders should monitor the $0.20 level as a crucial invalidation point for risk management purposes.
DISCLAIMER: ((trade based on your own decision))
<<press like👍 if you enjoy💚

EURNZD BEARISH BREAKOUT|SHORT|
✅EURNZD has broken down through the higher-timeframe supply with clear displacement, confirming bearish order-flow. A corrective pullback may form before algos drive price toward the next sell-side liquidity target below. Time Frame 4H.
SHORT🔥
✅Like and subscribe to never miss a new idea!✅

Bullish ascending triangle, waiting for breakoutSilver is forming a bullish ascending triangle. A breakout to the upside is a bullish signal. In that case a retest of the $54 level is likely. RSI divergence supports bullish thesis. A violation of the triangle base would invalidate.

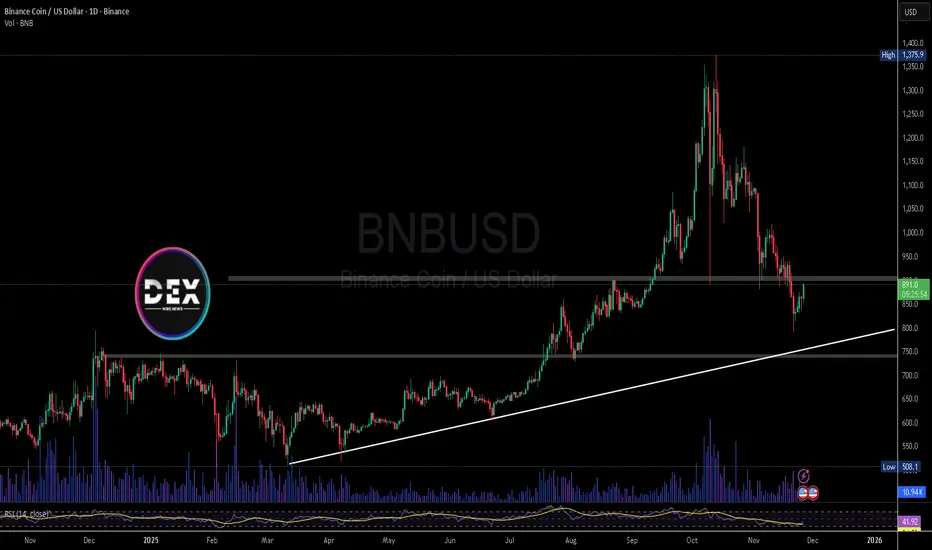
Binance Coin ( $BNBUSD) ETF Tension Meets Legal PressureBNB trades near $891 after a sharp 24% monthly drop, and the market now sits at a crossroads. The biggest question is whether institutional catalysts can outweigh regulatory pressure. VanEck’s surprise filing for a spot BNB ETF on Nasdaq marks a major milestone — the first attempt to bring BNB into U.S. regulated markets. The firm plans a trust that holds BNB directly and tracks the MarketVector BNB Index, mirroring the structure of U.S. Bitcoin and Ethereum ETFs. This signals strong institutional confidence, though SEC approval remains uncertain.
The filing also specifies no staking support at launch, though VanEck may add a third-party provider later. This transparency suggests the firm is preparing for a difficult regulatory review, especially with Binance facing growing legal challenges. More than 300 victims of the October 7 attack on Israel filed a lawsuit accusing Binance of facilitating transactions tied to sanctioned groups. This is the fourth U.S. suit with similar claims, raising the stakes as BNB seeks ETF approval.
Yet institutional interest continues to expand. BlackRock deployed its $2.5B BUIDL Fund onto BNB Chain through Securitize, enabling the fund to be used as collateral on Binance and strengthening BNB Chain’s presence in tokenization infrastructure. This provides a powerful counter-narrative to regulatory tension.
Technically, BNB remains in a fragile structure. The break below $907 turned major support into resistance. Bears now eye deeper levels, including the ascending trendline at $769 and the critical $720 zone. Resistance sits at $907, $1,020, and $1,200, with $1,375 marking all-time highs. A reclaim of $907 could flip momentum, but failure opens the door to a retest of lower supports. The next two weeks may define BNB’s path.
SLPUSDT first +300% pump coming soonAs previously outlined in our technical analysis, SLPUSDT is demonstrating strength at a significant confluence zone, combining both a major daily support level and the lower boundary of its prevailing trading channel. The current bullish reaction from this strategic area suggests a potential reversal of prior downward momentum.
We are now monitoring for a decisive breakout above the channel's resistance, which would signal a structural shift in market dynamics. Should this occur with supporting volume, it could initiate a substantial upward impulse. Based on the technical structure, our initial projected target represents approximately 300% appreciation from current levels, with potential for extended gains should momentum persist beyond this initial objective.
DISCLAIMER: ((trade based on your own decision))
<<press like👍 if you enjoy💚

AI on the markets is the answerIts been many years of hardship trying to figure this damn market thing out
AI taught to do MTOPS gave it super human abilities
2026 is where it all turns around
Welcome to a preview of your future

Ethereum ( $ETH) Whales Load Up as Price Holds Key SupportEthereum trades near $2,939 after a volatile month that flushed out weak hands and pulled price into long-term support. The market now watches whale behavior closely, because large wallets often position early before major trend shifts. A well-known Hyperliquid whale — famous for earning nearly $200M shorting the October crash — has now opened a $44.5M ETH long, gaining over $300K within the first hour. His timing historically matters, and many traders view this as a signal that smart money expects a reversal.
On-chain data strengthens this view. Wallets holding 10,000–100,000 ETH added 440,000 ETH in one week, aligning their cost basis with current prices. Meanwhile, mid-tier wallets continue to sell into strength. This creates a classic compression scenario: institutional-grade buyers accumulate while smaller players distribute. One group will break soon — and whales rarely fold first.
Institutional flows also support the bullish narrative. US spot-ETH ETFs recorded $96.67M in inflows, ending an eight-day outflow streak. The Coinbase Premium Index climbed from -0.12 to -0.02, showing improving US demand. With rate-cut expectations above 80%, the macro backdrop now leans favorable for risk assets like ETH.
Regulatory developments add another catalyst. US regulators approved banks to custody Ethereum, unlocking access for pension funds, insurers, and large financial institutions. Combined with the upcoming Fusaka Hard Fork on December 3, 2025, which boosts scalability and blob capacity, Ethereum enters a new phase of adoption.
Technically, ETH hovers at its long-term support zone. If $3,000 holds, targets sit at $3,450 and $3,800. A close below $2,900 opens a path toward $2,150–$2,200. For now, whale accumulation, ETF flows, and improving sentiment signal accumulation rather than fear.

SPX Update🚨📊 SPX Update
SPX is testing the red resistance zone right now 🔴.
If price manages to break out above this red level,
the first target will be the green line zone 🟢 —
the next key level on the chart.

ZECUSD --with ChatGPT input on breakout signs to watch for
I'm only posting this so I can easily access it within TradingView. Not investment advice or trying to garner followers. I have a paper trade account I like to mess around with and test out aggressive or short-term strategies.
🎯 **THE ONLY REVERSAL PATTERN THAT MATTERS HERE:
A “Three-Step Channel Reversal”**
(Also called a Channel Break + Higher Low + Retest)
You will know ZEC is bottoming only if ALL three pieces appear — not one, not two.
Here’s the blueprint:
✅ STEP 1 — A Clean Break Above the Upper Channel Line
Right now price is trapped inside your white descending channel.
A true reversal always starts with:
1️⃣ A full-bodied candle closing ABOVE the top of that channel
Not a wick.
Not a headfake.
A close outside the channel line.
Confirmation level on your chart:
≈ $560–$575 depending on slope of your channel
(The exact number moves slightly with time.)
This does NOT mean the trend has reversed — it only “unlocks” the possibility.
✅ STEP 2 — The Higher Low (the Golden Signal)
This is the most important step.
After breaking the channel, ZEC must pull back …
but instead of making a new low, it must make:
2️⃣ A Higher Low above $495–$505
This creates a bullish structure shift:
Old:
Lower-high → lower-low → lower-high → lower-low
New:
Breakout → higher-low → higher-high
Your zone for this higher low:
$515–$530 (ideal textbook)
Above $500 (minimum acceptable)
Below $500 (failed reversal → continuation down)
If price breaks out and then nukes back below $500 — all bets are off.
This higher low is the actual reversal, not the breakout.
✅ STEP 3 — A Break Above the Reaction High (~$585–$600)
After the higher low, ZEC must push back up and break:
3️⃣ The first post-breakout swing high
On your chart that level is:
🔥 $585–$600
This is the moment the trend flips from:
downtrend → uptrend
This is also where shorts puke and momentum flips sharply.
A full candle close above $600 = confirmed reversal.
📌 Putting All 3 Steps Together (Exact Pattern)
Here’s the whole sequence drawn conceptually:
↓ Lower highs
------------------
/ /
/ /
Lows → touch → Lows (channel floor)
|
| 1. BREAKOUT ABOVE CHANNEL
+------------------------------→
2. HIGHER LOW FORMS ABOVE $500
(this is the signal)
3. BREAK ABOVE $585–$600
(trend reversal confirmed)
Think of it like a lock with three tumblers — all must click:
Break the channel
Form a higher low
Break the prior swing high
Only then does the chart flip.
🧲 Bonus: Micro-pattern inside the Higher Low
When the higher low forms, look for ANY of these micro signals:
These dramatically increase the accuracy:
✔️ Mid-channel bullish engulfing candle
✔️ RSI bull divergence on 1H–4H
✔️ Volume spike at the retest
✔️ A tiny descending wedge inside the higher low
✔️ Bollinger Band squeeze + breakout
You will see at least one of these if the bottom is real.
🚫 Fake-Out Warning – What Doesn’t Count
These are common traps — do NOT mistake them for reversals:
A wick poking above the channel
A short-lived pump that immediately dumps
A move above $560 that returns inside the channel
A higher low below $495
A break above $560 with low volume
A move to $580 but failing to close above it
A breakout candle shaped like a long-upper-wick shooting star
If any of these show up → reversal invalid.
🔥 Summary: The Reversal Checklist
You should watch for this EXACT sequence:
1. Break above the channel (~$560–575)
➡️ potential start
2. Pull back and form a higher low above $500
➡️ real reversal forming
3. Break and close above $585–600
➡️ confirmed trend reversal
Only when step 3 happens does the bias fully flip to bullish.
Everything before that is just noise.
----------------------------------------------------------------------------------------------------------- COINBASE:ZECUSD
🎯 **Q: After a clean 6-hour close above the descending channel,
what are the odds ZEC just keeps ripping without forming the higher-low retest?**
Short answer:
About 20–30% probability.
Not zero — but not the base case either.
Long answer — here’s the breakdown:
📌 Why a straight-line breakout continuation is less common
When price busts out of a descending channel, it has to:
Absorb trapped short interest
Clear liquidity above prior swing points
Retest the breakout zone to confirm buyers actually live there
This is why the higher-low formation is so typical — it’s the market “proof-testing” the breakout.
Across thousands of measured descending-channel breakouts, the behavior is consistent:
~70–80% of valid breakouts → retest the breakout zone (higher low)
~20–30% → explosive continuation without retest
Your chart structure specifically leans even more toward the retest scenario, because:
There is significant overhead supply at $585–600
There’s trapped bull liquidity above the broken trendline
Volume on the breakdown was large → often requires a consolidation before reversing
You’re coming down from a parabola, not building up into a base
This all makes an “instant rip” less likely.
⚡ BUT — Here’s when the straight-line breakout does happen
ZEC can skip the retest entirely IF the breakout has all 3 of these:
1. Massive volume injection on the breakout candle
Think: 2–3× average 6H volume.
2. A breakout candle that closes near its highs
No wick.
No hesitation.
Strong body.
3. Immediate continuation within 1–2 candles
A breakout that pauses becomes a retest.
A breakout that accelerates becomes a runaway.
If you see those three conditions →
the odds of an instant rip jump from 20–30% to 40–50%.
Still not the base case, but now plausible.
🔍 What your specific ZEC chart suggests
Given the channel shape, the recent price action, and the support cluster around $500–520, your structure is classic of a:
“Breakout → Retest → Trend flip”
not a
“Breakout → Runaway vertical continuation”
Why?
Prior momentum cycle was exhausted
The slope of your descending channel is moderate (not steep)
Supply between $580–620 is thick
MACD/RSI on higher timeframes are cooling, not resetting for a parabolic move
The halving confusion + news flow won’t generate a sudden catalyst
This setup wants a higher low.
And that’s healthy.
🎯 So what’s the smart way to play or interpret the breakout?
If ZEC breaks the channel:
Base case expectation (70–80%)
Breakout → pullback → higher low → move toward $585–600 → trend reversal
Alternative expectation (20–30%)
Breakout → immediate ramp → test $600+ within a few candles
Low-probability outcome (5–10%)
Fakeout → re-entry into channel → flush to $455–470
That last one is why the retest is gold — it filters the fakes.
🧲 How to detect which version is unfolding — in real time
Watch these metrics like a hawk:
✔️ Volume
Weak → retest likely
Explosive → continuation possible
✔️ Distance from the breakout line
Breakout candle closes just above = retest likely
Breakout candle closes high above = continuation possible
✔️ How the next candle behaves
Pullback wick → retest
Full-bodied follow-through → continuation
Rejection wick → fakeout risk
This makes it very easy to know which path is forming within 6–12 hours.
💬 TL;DR — actionable answer
Odds of an instant continuation after a 6H breakout:
➡️ 20–30%
Odds of breakout → retest → higher low (classic reversal):
➡️ 70–80%
Your chart specifically favors the retest scenario.
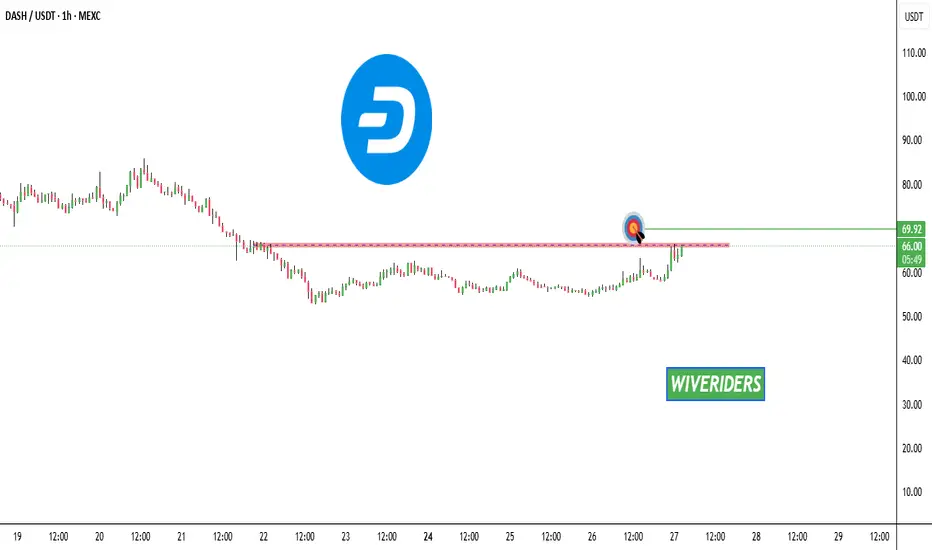
DASH Update🚨📊 DASH Update
DASH is testing the red resistance zone right now 🔴.
If price manages to break out above this red level,
the first target will be the green line zone 🟢 —
the next key level on the chart.
GOLD DAILY CHART ROUTE MAPHey everyone,
Please see our updated Daily chart route map with updated levels.
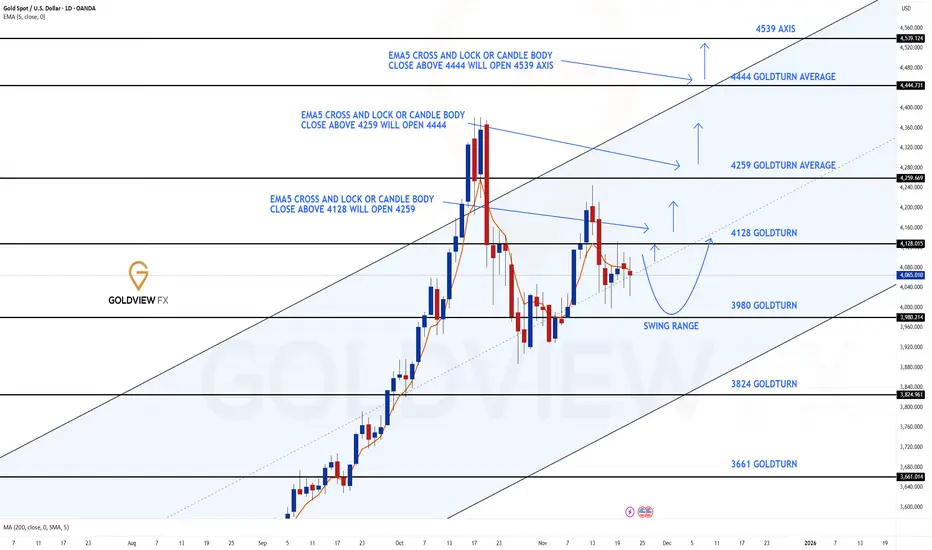
Price is currently playing between the longer daily chart range 4128 and 3980, with the channel half-line acting as support.
If this support holds, we should see a move toward the 4128 target. A body close or ema5 cross and lock below the half-line would open the swing range for a test and bounce. We're also watching for a break above 41238 to confirm a continuation above.
This is the beauty of our Goldturn channels, which we draw in our unique way, using averages rather than price. This enables us to identify fake-outs and breakouts clearly, as minimal noise in the way our channels are drawn.
We will use our smaller timeframe analysis on the 1H and 4H chart to buy dips from the weighted Goldturns for 30 to 40 pips clean. Ranging markets are perfectly suited for this type of trading, instead of trying to hold longer positions and getting chopped up in the swings up and down in the range.
We will keep the above in mind when taking buys from dips. Our updated levels and weighted levels will allow us to track the movement down and then catch bounces up using our smaller timeframe ideas.
Our long term bias is Bullish and therefore we look forward to drops from rejections, which allows us to continue to use our smaller timeframes to buy dips using our levels and setups.
Buying dips allows us to safely manage any swings rather then chasing the bull from the top.
Thank you all for your likes, comments and follows, we really appreciate it!
Mr Gold
GoldViewFX
EUR-USD Local Short! Sell!
Hello,Traders!
EURUSD is pushing into the horizontal supply after a liquidity sweep, signaling potential distribution. If rejection confirms, expect a move toward the next sell-side liquidity at the target level. Time Frame 2H.
Sell!
Comment and subscribe to help us grow!
Check out other forecasts below too!
Disclosure: I am part of Trade Nation's Influencer program and receive a monthly fee for using their TradingView charts in my analysis.

AIRLINK – TECH SHORT-SELL CALL | 1H TF | 26 NOV 2025 | By TCAAIRLINK – TECH SHORT-SELL CALL | 1H TF | 26 NOV 2025 | By The Chart Alchemist
AIRLINK previously completed a significant uptrend, reaching a high of PKR 193. However, the momentum has now shifted bearish, and the stock has formed a robust bearish structure near the current market levels. We expect the stock to continue its downward movement.
📢 Technical Analysis by Mushtaque Muhammad (The Chart Alchemist).
