CAD/JPY GOING LONG! BUT FOR HOW LONG? I want to document this possible direction because from what I am seeing this looks very probable.
When it comes to this pair we have seen a great push to the upside that looked very steady until the disaster of 10/10 but I believe we will bounce long! but for how long is the good question, I would pay attention to this pair due to the fact that there is no real impactful news this week for either pair! Meaning some good foundational trades should be possible but again we follow price action and then move a long side! My theory is-
Price will push down to .786 or .619 level and then bounce back up for a pullback or correction! (for my ICC) this is where I will be looking to do longs if I see HH N HL on smaller time frames up until critical prices like 108.497 and 108.962 and above! one of these key levels will either hold and push down even further or it will be broken and price will continue!
tell me your feed back and thoughts on this trading idea.
Contains IO script

#BTC Update | 12.10.2025🚨 #BTC Update | 12.10.2025 🚨
Bitcoin had a massive drop, making a deep wick near the 100K zone — a true disaster day for many traders with huge liquidations across the market 😬💥
As I mentioned in my previous analysis, once BTC lost the support at Arrow #1 and #2, the bullish momentum weakened, opening the door for a deeper retracement on the weekly timeframe.
📉 The weekly retracement zone was marked around 104,669, and guess what? — on Friday’s wick, price tapped it perfectly. 🎯
Now, the focus shifts to Arrow #3 and #4 — once the price breaks above these levels, we can look to re-enter buy positions confidently. ✅
Remember, on the bigger timeframes, the overall structure remains bullish, so this pullback could just be a healthy correction before the next leg up. 🚀
I expect a strong recovery move after Monday, which could confirm the breakout.
Next up 👉 I’ll post the #BTC.D and #ETH analysis, so stay connected, stay patient, and trade smart! 💪🔥
#Bitcoin #Crypto #Trading #BTCAnalysis #SwingTrade

MSTR Is CookedRegardless of what happens with BTC, MSTR is done. Way too many signals for MSTR. Unfortunately, the present MSTR situation gives me pause about BTC's next few weeks to months. As always, time will tell.
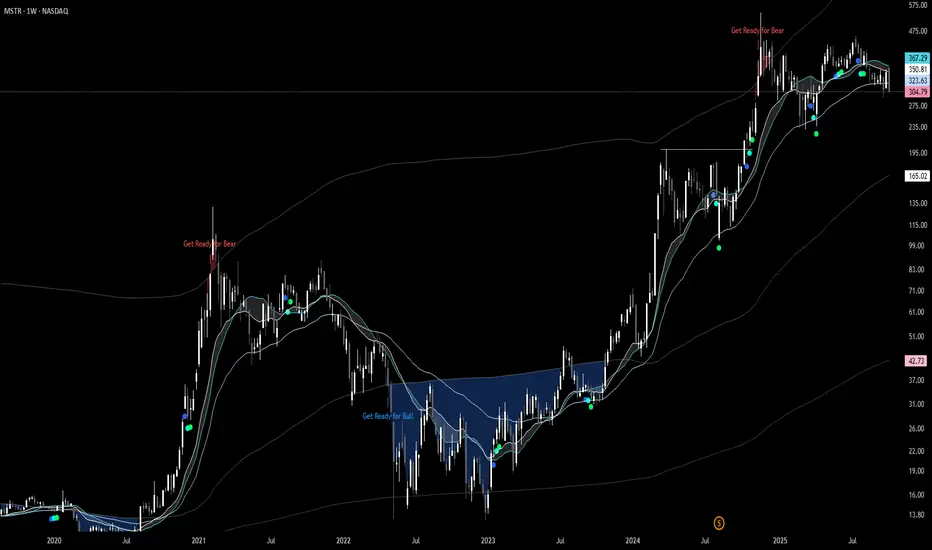
Dumptober 10 days in.
Good afternoon Traders,
For those of you who follow crypto and have been around for a while know, Leverage can be dangerous. Its been a little over 24 hours from the black swan event where almost $10B was liquidated from peoples hands. In the event that took place, users of certain exchanges using leverage at the time suffered the most.
In this case, because the price fell so fast, no stop loss or limit order would have triggered. Locking you into the trade. Folks, with a large enough drawdown like yesterday, erases your whole account. You may have intended to risk 1% like a responsible trader...but that wasn't the outcome. There was no protection. No liability. That is the risk no body wants to talk about.
Crypto is still not fully regulated. Crypto is still the wild west. Your money is the main tool you use to survive. Protect your assets by any means. Cold wallet, gold, stocks, beanie babies...its your call. But understand the risks involved.
This was a panful reminder. Some may never bounce back, ever.
So stay safe, i wish you the best.
Cheers,
Uni.

BHVNBiohaven Ltd. is a clinical-stage biopharmaceutical company focused on developing therapies for neurological and neuropsychiatric disorders, including migraine treatments and rare diseases. It's a high-risk, high-reward biotech play, with volatility tied to clinical trial results and pipeline advancements, but facing cash burn pressures in a tough funding environment.
Recent Performance & Fundamentals:
Current Price: $15.80 (as of Oct 10, 2025 close, down ~8.3% that day amid liquidity concerns and selling pressure).
Market Cap: $1.67B.
52-Week Range: $12.79–$54.98 (near the bottom after a sharp YTD decline of ~60%, reflecting broader biotech weakness).
Key Metrics: Trailing P/E N/A (unprofitable), EPS (TTM) -$7.46. Cash burn accelerated 33% YoY, leaving ~8 months runway, raising dilution risks.
News/Outlook: Shares swung wildly last week—up 7% to $16.36 on Oct 9, then plunged to a new 2025 low on Oct 10. Q3 earnings due Nov 10; focus on pipeline updates for troriluzole (ALS) and migraine assets. Bearish short-term forecast, but long-term growth from neurology focus.
Buy, Hold, or Sell?
Strong Buy. Analyst consensus is bullish—62% Strong Buy, 31% Buy, 8% Hold, with no Sells; average ABR 1.32. Price targets average $47.42–$49.23 (~200% upside), ranging $19–$75. Recent initiations like Citigroup's Buy at $28 reinforce momentum, but monitor cash runway—ideal for aggressive growth investors.

ZEC: intraday tradingWithin a day, you can trade from local zones. The indicator shows the direction of priority trades well.


BTC: bullish impulseOn September 29, Bitcoin initiated a confident upward move from $113,705.5 on the 4-hour chart. The price traversed all four partial-take stages and reached $122,358.9 — nearly $8,600 per coin. Trading with 10x leverage made the move notably dynamic.
I followed my proprietary strategy. When the structure is clear, the market becomes much calmer. From here, there is a nontrivial probability of a pullback; it makes sense to prepare for a potential bearish signal.
Net effect: the upside potential was substantial — and those who acted systematically could capture the bulk of the move. Moments like these highlight the importance of analytics and discipline. In markets, winners aren’t guessers; they are traders who execute a plan.

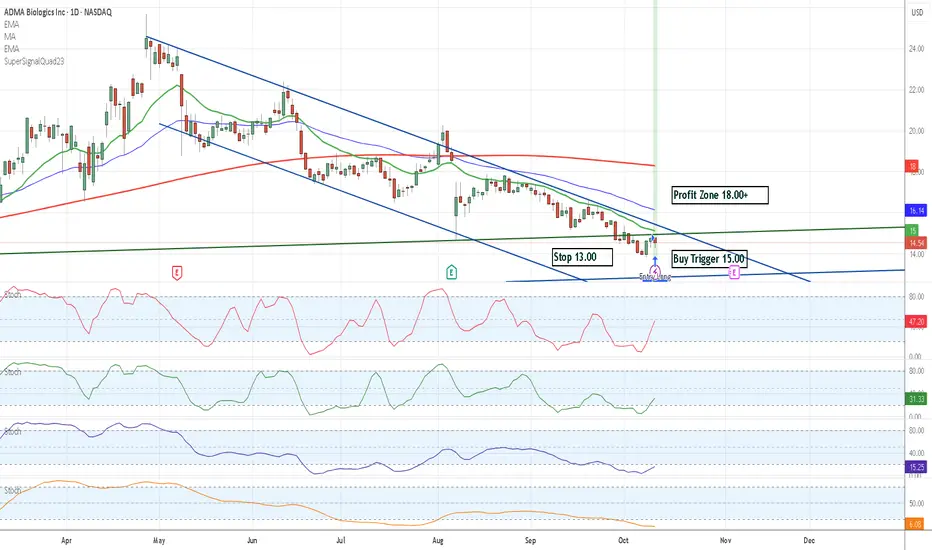
ADMAWhat is ADMA & its business profile
ADMA Biologics is a biopharmaceutical company that develops, manufactures, and markets specialty plasma-derived biologics.
Yahoo Finance
+2
Admabiologics
+2
Its key products include BIVIGAM (an IVIG product for primary humoral immunodeficiency) and ASCENIV (another immunoglobulin therapy).
Yahoo Finance
+2
Admabiologics
+2
The company also operates plasma collection facilities to supply parts of its product pipeline.
Yahoo Finance
+2
Admabiologics
+2
In 2024, they reported strong growth: revenues up ~65% year over year, and Adjusted EBITDA up ~309%.
Admabiologics
In Q1 2025, ADMA reported revenue growth of 40% YoY and EBITDA growth of ~81% YoY.
Admabiologics
In Q2 2025: revenue $122.0 million (14% YoY increase), and GAAP net income of $34.2 million.
Admabiologics
A key development: in April 2025, ADMA received U.S. FDA approval for a yield enhancement process in their immunoglobulin (IG) production, which is expected to boost output (they estimate ~20% increase in output from the same plasma volume) and improve margins.
Admabiologics
+3
Admabiologics
+3
Admabiologics
+3
Strengths & positives
Growth trajectory & profitability
Many biotech companies operate at losses, but ADMA is generating profits and expanding margins, which is a relatively rare and favorable position in the biotech space.
Admabiologics
+4
Investors
+4
Admabiologics
+4
Operational leverage from yield improvements
The FDA-approved yield enhancement means they can get more output from the same plasma inputs, which should help with scaling revenue and improving margins (assuming demand, stability, and regulatory risk are managed).
Admabiologics
+3
Admabiologics
+3
Admabiologics
+3
Analyst sentiment & upside estimates
Several recent analyses point to potential upside. For instance, one source places average target prices in the $20.96 to $35.00 range (implying ~40-60% upside depending on current price) with “Buy” and “Hold” ratings, and no present “Sell” ratings.
Directors Talk Interviews
+2
Directors Talk Interviews
+2
Also, ADMA was spotlighted after its yield process approval: the stock jumped ~12% on the news.
ALTs: So you turned bearish?$20 Billion liquidation move
Fear racing through their veins
Is this the Covid crash from 2020 all over?
Current TOTAL3 15MIN => 3 candles
2020 BTC Weekly => 3 candles
They are oddly similar. What can we learn from this? Cycle is massively shortened. weekly -> 15min.
To confirm we are bullish we need to take out the TOTAL3 High.
We are again at the 21 Weekly MA + uptrend + horizontal support
I don't like the bearish divergence on my Oscillator.
So holding that 1 Trillion on TOTAL3
If we do go higher, what coins should you hold? Not every one will perform.
Breaking that 1Trillion mark and losing 21 Weekly here and other coins like BTC, ETH etc would be very bearish.

ETH : good short!On October 9, the indicator showed a short signal, after which the price fell by 20%

BTC: Prepare for 2026Following the 4 year cycle, The Top is almost in.
Tapping an uptrend and sitting at 111K the 21 Weekly MA. Holding this level i find very important. Although i believe an we will see higher prices in Q4, the top could also be in.
Following the 4 year cycle, after the TOP comes "Crypto Winter". Everything cools off. Emotionally, many will reach the state off Despair and Capitulation. You should not be in that state because at that time you have "Zero" holdings in crypto (at the end off Q1 2026 you should have close to zero crypto exposure) , probably sooner.
We can extrapolate when the next BUY TIME is. We don't know the exact price, hence the big range. But we do know +- the Time. Currently marked 28 september - 21 December. Wherever the price is there, is probably a good Longer Term investment, for that next cycle.
While the last hands are selling there crypto, we will slowly start buying them. setting up the stage for the next 4-year cycle.
Price wise i'm looking at 73K is the minimum target and 35K is the maximum target. There was huge institutional buying between 30K and 70K. If there are many institutional outflow in the coming year, then lower targets are probable. If they keep their holdings, they'll want to protect the rice and create a floor somewhere..
So yeah. 73K - 55K - 42K - 35K

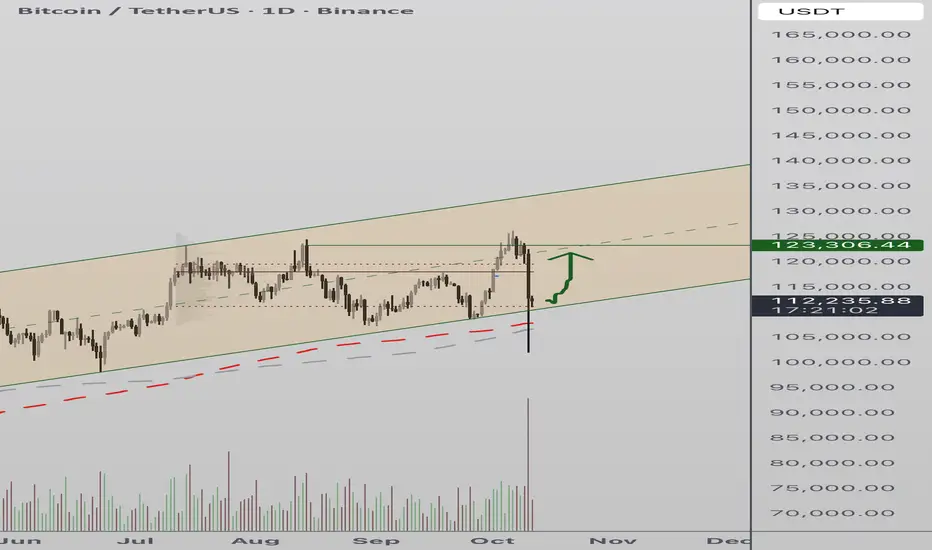
Bitcoin Reclaims Channel Support After Sharp Liquidity CascadeBitcoin recently experienced a sharp correction, sweeping through major swing lows in a widespread liquidity cascade. Despite the heavy drawdown, the market has shown early signs of recovery, with price action reclaiming the lower boundary of the trading channel. This development could set the stage for a short-term relief rally — provided the reclaimed level holds as support.
Key Technical Points:
- Channel Reclaim: Price has recovered the lower boundary of the trading channel after a liquidity sweep.
- Fresh Structure: The current rebound remains early-stage and requires further confirmation through consolidation.
- Relief Rally Potential: Sustained support above the channel low could lead to a bullish rotation toward higher levels.
Following the liquidation-driven drop, Bitcoin has stabilized above the channel’s lower limit — a critical technical threshold for directional bias. This region now acts as a pivot between continuation lower or recovery toward the mid-range. Market structure suggests that post-liquidation consolidations often trigger countertrend rallies as selling pressure exhausts and new buyers step in.
For this scenario to unfold, Bitcoin must continue closing candles above the reclaimed level while volume and momentum gradually improve. A sustained defense of this area could push price action higher into mid-range targets, signaling the beginning of a broader recovery. However, if the market fails to maintain this base, another sweep of recent lows could follow before a more stable reversal forms.
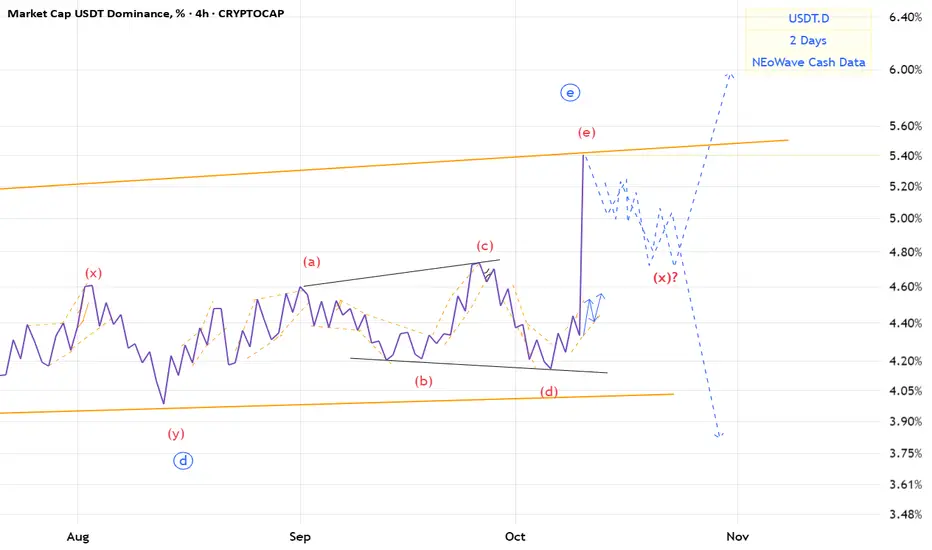
USDT.D(based on NEo wave)The e wave that I wanted made a descending triangle.
we should wait for it becouse it may make an x wave or a post pattern.
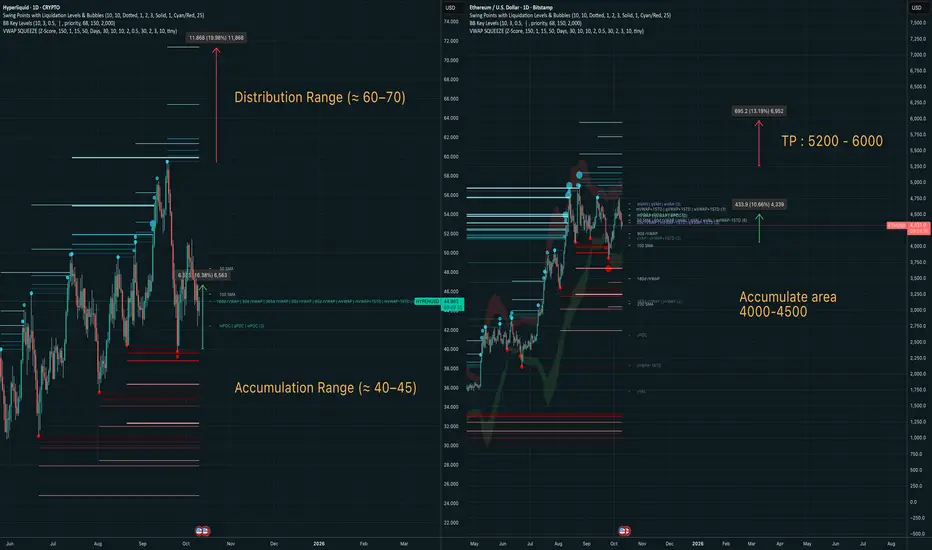
Ethereum + Hyperliquid | Macro Accumulation → Distribution FrameSpot Strategy | 0xPareto Thesis
This chart visualizes the ongoing macro accumulation phase across both Ethereum and Hyperliquid, aligning with cyclical VWAP structure and liquidity maps.
Ethereum (Right):
Accumulation area: $4,000–$4,500
Target: $5,200–$6,000
Hyperliquid (Left):
Accumulation range: $40–$45
Distribution range: $60–$70
Mean reversion setup with high confluence on 180d VWAP and prior liquidity clusters.


Cardano (ADA) Holds Key Support, Eyes Move Toward 0.92Cardano’s price action is holding firm above the high-time-frame support at 0.766, a critical zone that continues to underpin the broader bullish structure. This level has acted as a strong demand region, with buyers stepping in to defend it multiple times — signaling sustained confidence from market participants. The formation of consecutive higher highs and higher lows further confirms that the prevailing trend remains bullish on both the mid and higher time frames.
From a technical standpoint, the 1.618 Fibonacci extension has been respected throughout the recent rally, suggesting that ADA is following a well-defined harmonic rhythm. The confluence of rising moving averages and volume support also reinforces the bullish narrative, indicating that any minor pullbacks may serve as healthy retracements within the uptrend.
As long as the 0.766 support level continues to hold, the next key objective for buyers lies around 0.927, where a potential reaction or short-term consolidation could occur. Overall, Cardano maintains a structurally bullish outlook, with the current setup favoring a continuation toward higher targets as momentum and trend alignment stay intact.

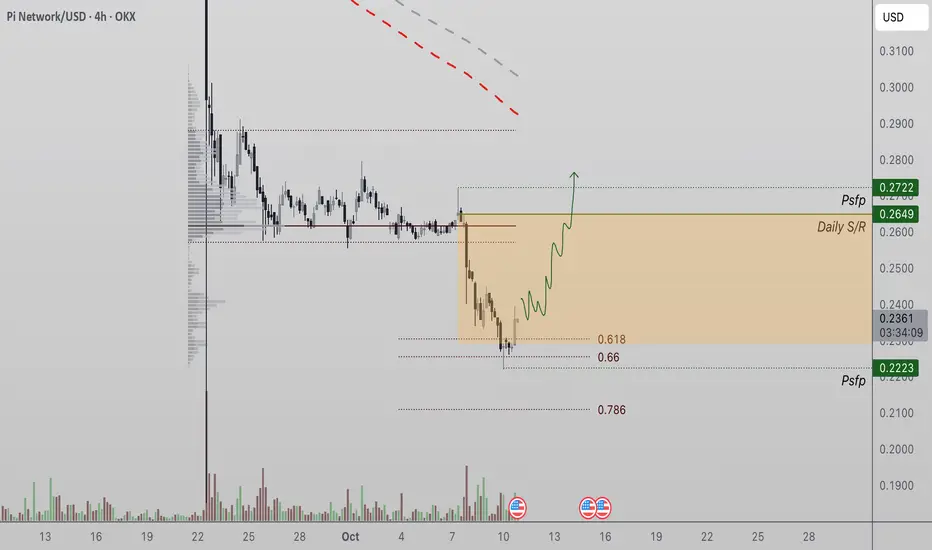
Pi Network Rebounds from Golden Pocket — Is a Reversal Brewing?Pi Network (PI) is showing early signs of strength after rebounding from the 0.618 Fibonacci retracement level, accompanied by a bullish engulfing candle on the 4H chart. This confluence zone marks a crucial turning point where buyers are beginning to re-enter the market following an extended phase of selling pressure.
If the 0.618 golden pocket continues to act as reliable support over the next few sessions, the probability of a rotational move toward $0.26 increases significantly. This level not only aligns with short-term liquidity zones but also serves as the next logical target in the current structure.
From a technical standpoint, Pi Network remains within a tight consolidation range, but momentum indicators are gradually shifting in favor of the bulls. Sustained closes above this region would reinforce the likelihood of a trend reversal and potentially spark renewed upside continuation.
GBPUSD Harmonic Analysis – Bullish OutlookOn the 1H timeframe, GBPUSD has completed a Deep Crab harmonic pattern, reaching the extended 2.000 Fibonacci leg – a strong reversal zone within the pattern structure.
Price has reacted at the potential XA completion point, showing early signs of accumulation around 1.3297 support.
With both T1 (1.3377) and T2 (1.3432) lining up as harmonic targets, bullish momentum could develop as the market transitions from the markdown to the markup phase.
If buyers maintain structure above the recent low, a recovery towards these targets remains in play.
Bias: Bullish
Targets:
T1: 1.3377
T2: 1.3432
Invalidation: A clean break below 1.3270 would invalidate the pattern and shift bias back to bearish.

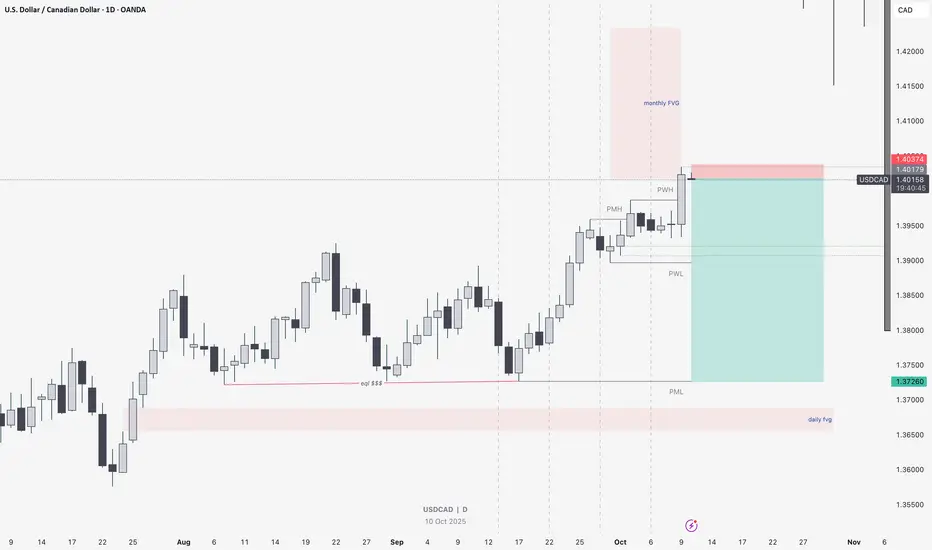
USD/CAD Short Setup from Monthly Fair Value Gap RejectionPrice has tapped into the monthly FVG (Fair Value Gap) around the 1.4050 area, aligning with a potential liquidity sweep above the previous week’s high (PWH).
If lower timeframes (H4 or H1) confirm a bearish shift in market structure or displacement, I’ll be looking for short entries targeting the previous monthly low (PML) at 1.3726, which also aligns with equal lows and a daily FVG resting below.
The setup idea follows the premise that the market has reached a premium level after engineering liquidity above the highs and is likely to rebalance towards the discount zone where liquidity and inefficiencies remain unfilled.
Confluence:
• Monthly FVG tapped
• Liquidity sweep above previous week’s high
• Potential bearish structure shift on lower timeframe
• Untapped daily FVG below at 1.37 zone
If price fails to show bearish confirmation and breaks cleanly above the monthly FVG, this idea becomes invalid.
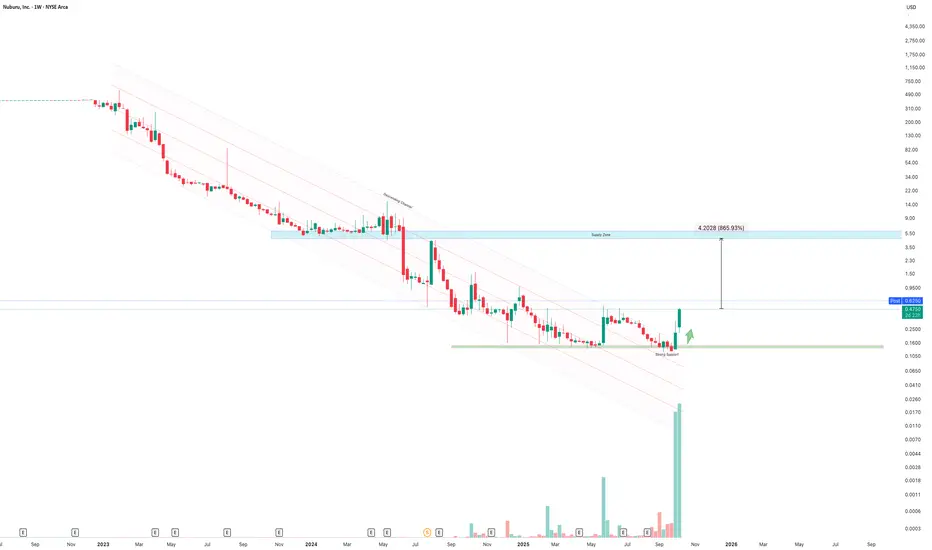
Buru to $5.00 NearTerm?!The chart illustrates a confirmed breakout from a long-term descending channel following an extended period of accumulation near strong support around $0.16–$0.20. A powerful volume surge — the largest in the stock’s history — confirms strong momentum and potential trend reversal.
Price has now closed above the upper boundary of the downtrend channel, signaling a shift from distribution to expansion. The highlighted supply zone between $3.70 and $5.00 represents the next major liquidity target, aligning with a potential 886% measured move from the current breakout level near $0.47.
If price holds above the new support ($0.25 region), this setup favors continuation toward the $5.00 zone in the short term, where previous heavy trading activity and historical resistance converge.
The breakout marks the early phase of what could develop into a full revaluation cycle, contingent on sustained volume and follow-through.