Master Correlation Strategies in Financial MarketsIntroduction
In the dynamic world of financial trading and global markets, mastering correlation strategies is a cornerstone of risk management, portfolio diversification, and strategic profit-making. Correlation — the statistical relationship between two or more assets — reveals how price movements are interconnected. Understanding these relationships enables traders, investors, and portfolio managers to forecast market behavior, hedge risks, and enhance returns. In an era dominated by algorithmic trading, quantitative analysis, and global interdependence, mastering correlation strategies has become an indispensable skill for professionals in finance.
1. The Concept of Correlation in Financial Markets
Correlation measures the degree to which two securities move in relation to one another. It is expressed as a correlation coefficient ranging from -1 to +1:
+1 (Perfect Positive Correlation): The two assets move in the same direction. For example, the S&P 500 Index and a major U.S. technology ETF often exhibit a high positive correlation.
-1 (Perfect Negative Correlation): The two assets move in opposite directions. For instance, gold and the U.S. dollar often show a negative correlation.
0 (No Correlation): The movements of the two assets are unrelated.
By analyzing correlations, traders can understand how assets behave under varying market conditions — bullish, bearish, or volatile.
2. Importance of Correlation in Trading and Investment
Mastering correlation allows investors to build robust portfolios that can withstand market shocks. The importance of correlation can be summarized as follows:
Risk Management:
Correlation analysis helps identify how portfolio components interact. High correlations among holdings increase risk exposure, while low correlations enhance stability.
Diversification:
Diversification reduces unsystematic risk. By combining assets that are not highly correlated, investors minimize losses if one segment of the portfolio declines.
Hedging:
Traders can use negatively correlated assets as hedges. For example, when equity markets fall, investors may shift funds to bonds or gold.
Macro Market Analysis:
Correlation helps identify inter-market relationships — such as between currencies, commodities, and equities — offering insights into global economic trends.
Algorithmic Strategy Development:
Quantitative traders use correlation matrices to design algorithmic models that exploit patterns and mean-reversion opportunities between correlated assets.
3. Types of Correlation in Financial Markets
There are multiple forms of correlation that traders must understand:
Static Correlation:
The traditional correlation coefficient that remains constant over a fixed time period.
Dynamic or Rolling Correlation:
Correlations are not stable; they change over time due to macroeconomic events, liquidity shifts, and investor sentiment. Rolling correlation examines relationships across moving time windows (e.g., 30-day or 90-day).
Cross-Asset Correlation:
Measures how different asset classes — such as equities, bonds, and commodities — interact. For example, bond yields often have an inverse correlation with stock prices.
Intermarket Correlation:
Tracks relationships across international markets. For example, the performance of the U.S. dollar influences emerging market equities and commodities.
Sectoral Correlation:
Within equities, correlations can vary by sector. Technology and consumer discretionary sectors may rise together during economic booms but diverge in recessions.
Lagged Correlation:
Sometimes one asset’s price movement precedes another. For instance, movements in crude oil prices often precede those in airline stocks due to cost impacts.
4. Building Correlation-Based Strategies
Mastering correlation requires applying the concept in strategic, data-driven ways. Below are several powerful correlation-based trading and investment approaches.
A. Pair Trading (Statistical Arbitrage)
Pair trading is one of the most common correlation strategies. It involves identifying two historically correlated assets. When their correlation temporarily diverges — one asset becomes undervalued while the other is overvalued — traders short the outperforming asset and go long on the underperforming one, betting that prices will converge again.
Example:
Suppose Coca-Cola (KO) and PepsiCo (PEP) typically move together.
If KO rises 5% while PEP remains flat, traders might buy PEP and short KO, expecting their prices to realign.
This strategy is market-neutral, meaning profits can be generated regardless of market direction, as long as the correlation reverts.
B. Cross-Asset Hedging
Traders often hedge exposure by using correlated assets. For instance:
A trader long on the NASDAQ 100 might short S&P 500 futures to offset systemic risk.
Commodity traders hedge oil exposure through correlated instruments like energy-sector ETFs or refining stocks.
This technique reduces portfolio volatility by offsetting correlated risks.
C. Intermarket Analysis
Correlation helps traders interpret how different markets influence each other. Examples:
A strengthening U.S. dollar often leads to falling commodity prices.
Rising Treasury yields may indicate future stock market corrections.
Increasing oil prices can signal inflationary pressures affecting currency values.
By monitoring these correlations, traders anticipate market moves before they occur.
D. Portfolio Diversification Optimization
Portfolio managers use correlation matrices to identify assets that provide maximum diversification benefits.
For instance, combining U.S. equities with gold, real estate, and bonds reduces overall portfolio variance because these assets have historically low or negative correlations with one another.
E. Volatility and Correlation Trading
In derivative markets, correlation strategies are applied using correlation swaps or dispersion trades:
A correlation swap allows traders to speculate directly on the average correlation between assets in an index.
Dispersion trading involves buying options on individual stocks while selling options on an index, profiting from the difference between implied and realized correlation.
These advanced techniques are primarily used by institutional traders and hedge funds.
5. Tools and Methods to Measure Correlation
Mastering correlation requires analytical tools and quantitative methods:
Correlation Coefficient (Pearson’s r):
A standard measure ranging from -1 to +1, used to identify the strength and direction of a linear relationship.
Spearman Rank Correlation:
Measures monotonic relationships (useful when data is not normally distributed).
Rolling Correlation Analysis:
Using statistical software or trading platforms, traders compute rolling correlations to observe how relationships evolve.
Heatmaps and Correlation Matrices:
Visual tools that show correlations between multiple assets simultaneously, allowing easy identification of diversification opportunities.
Regression Analysis:
Used to model dependencies and predict how one asset’s returns affect another’s.
Machine Learning Techniques:
Advanced models like Principal Component Analysis (PCA) or clustering algorithms help detect non-linear correlations across large datasets.
6. Challenges in Applying Correlation Strategies
While correlation is a powerful concept, it is not without limitations:
Correlation is Not Causation:
A high correlation doesn’t necessarily imply one asset influences another. Spurious correlations may lead to false signals.
Dynamic Market Behavior:
Correlations fluctuate due to macroeconomic shifts, policy changes, or crises. For example, during global recessions, correlations across assets tend to rise sharply, reducing diversification benefits.
Tail Risk and Black Swan Events:
Extreme market events often break historical correlations. During the 2008 financial crisis, previously uncorrelated assets suddenly moved together.
Overfitting in Quant Models:
Excessive reliance on historical data can lead to models that fail under real-world conditions.
Liquidity and Execution Risks:
In pair or correlation trades, slippage and liquidity constraints can erode profitability.
7. Correlation Dynamics in Different Market Environments
Understanding how correlations evolve under various conditions is key to mastering this strategy.
Bull Markets:
Equity correlations tend to decrease as investors pursue diverse risk assets.
Diversification benefits are more visible, and pair trading strategies perform well.
Bear Markets:
Correlations across asset classes often increase as investors move to safe havens.
Portfolio diversification becomes less effective, and hedging becomes essential.
Volatile or Uncertain Markets:
Dynamic correlation tracking helps traders detect sudden changes in market relationships.
Correlation-based hedging and volatility arbitrage strategies become valuable.
8. Role of Correlation in Algorithmic and Quantitative Trading
Quantitative funds and algorithmic trading systems rely heavily on correlation analysis:
High-Frequency Trading (HFT): Algorithms detect microsecond-level correlation changes to exploit arbitrage opportunities.
Machine Learning Models: Predictive models use multi-asset correlation patterns to forecast market direction.
Portfolio Optimization Algorithms: Quant funds use correlation matrices to rebalance holdings dynamically.
Correlation Arbitrage: Institutional players identify mispriced assets using multi-dimensional correlation structures.
9. Case Studies: Correlation in Action
A. Gold and U.S. Dollar
Historically, gold and the U.S. dollar exhibit strong inverse correlation. When the dollar weakens due to inflation or monetary easing, gold tends to rise as investors seek protection against currency devaluation.
B. Crude Oil and Equity Markets
Oil prices often move in tandem with equity markets in growth periods but diverge during inflationary shocks or geopolitical disruptions.
C. Bitcoin and Tech Stocks
Recent data show Bitcoin increasingly correlated with technology equities, reflecting its risk-on asset behavior in global liquidity cycles.
10. The Future of Correlation Strategies
The future of correlation strategies is shaped by technology, globalization, and behavioral finance.
Machine learning, big data analytics, and artificial intelligence are enabling real-time correlation tracking across vast datasets, enhancing predictive power. Cross-asset and inter-market relationships are becoming increasingly complex due to algorithmic participation and geopolitical dynamics.
Moreover, deglobalization trends, supply chain shifts, and digital assets are creating new correlation structures that traders must monitor closely. As financial systems evolve, mastering dynamic, adaptive correlation strategies will remain a decisive advantage.
Conclusion
Mastering correlation strategies is not merely a technical skill; it is a comprehensive approach to understanding market interconnectivity, risk, and opportunity. By studying how assets move in relation to one another, traders and investors can craft resilient portfolios, design profitable arbitrage models, and navigate volatility with confidence.
In essence, correlation is the language of relationships within global finance. The true mastery lies in not only recognizing those relationships but also anticipating when they will shift — turning statistical insight into strategic foresight.
Correlation
Master Correlation StrategiesUnlocking the Power of Inter-Market Relationships in Trading.
1. Understanding Correlation in Trading
Correlation refers to the statistical relationship between two or more financial instruments — how their prices move relative to each other. It is expressed through a correlation coefficient ranging from -1 to +1.
Positive Correlation (+1): When two assets move in the same direction. For example, crude oil and energy sector stocks often rise and fall together.
Negative Correlation (-1): When two assets move in opposite directions. For instance, the U.S. dollar and gold often have an inverse relationship — when one rises, the other tends to fall.
Zero Correlation (0): Indicates no consistent relationship between two assets.
Understanding these relationships helps traders predict how one market might respond based on the movement of another, enhancing decision-making and portfolio design.
2. Why Correlation Matters
In modern financial markets, where globalization links commodities, equities, currencies, and bonds, no asset class operates in isolation. Correlation strategies allow traders to see the “bigger picture” — understanding how shifts in one area of the market ripple across others.
Some key reasons why correlation is vital include:
Risk Management: Diversification is only effective when assets are uncorrelated. If all your holdings move together, your portfolio is not truly diversified.
Predictive Analysis: Monitoring correlated assets helps anticipate price moves. For example, a rally in crude oil might foreshadow gains in oil-dependent currencies like the Canadian Dollar (CAD).
Hedging Opportunities: Traders can offset risks by holding negatively correlated assets. For instance, pairing long stock positions with short positions in an inverse ETF.
Market Confirmation: Correlations can validate or contradict signals. If gold rises while the dollar weakens, the move is more credible than when both rise together, which is rare.
3. Core Types of Correlations in Markets
a. Intermarket Correlation
This examines how different asset classes relate — such as the link between commodities, bonds, currencies, and equities. For example:
Rising interest rates typically strengthen the domestic currency but pressure stock prices.
Falling bond yields often boost equity markets.
b. Intra-market Correlation
This focuses on assets within the same category. For example:
Technology sector stocks often move together based on broader industry trends.
Gold and silver tend to share similar price patterns.
c. Cross-Asset Correlation
This involves analyzing relationships between assets of different types, such as:
Gold vs. U.S. Dollar
Crude Oil vs. Inflation Expectations
Bitcoin vs. NASDAQ Index
d. Temporal Correlation
Certain correlations shift over time. For instance, the correlation between equities and bonds may be positive during economic growth and negative during recessions.
4. Tools and Techniques to Measure Correlation
Correlation is not merely an observation—it’s a quantifiable concept. Several statistical tools help traders measure and monitor it accurately.
a. Pearson Correlation Coefficient
This is the most widely used formula to calculate linear correlation between two data sets. A reading close to +1 or -1 shows a strong relationship, while values near 0 indicate weak correlation.
b. Rolling Correlation
Markets evolve constantly, so rolling correlation (using moving windows) helps identify how relationships shift over time. For example, a 30-day rolling correlation between gold and the USD can show whether their inverse relationship is strengthening or weakening.
c. Correlation Matrices
These are tables showing the correlation coefficients between multiple assets at once. Portfolio managers use them to construct diversified portfolios and reduce overlapping exposures.
d. Software Tools
Platforms like Bloomberg Terminal, TradingView, MetaTrader, and Python-based tools (like pandas and NumPy libraries) allow traders to calculate and visualize correlation efficiently.
5. Applying Correlation Strategies in Trading
a. Pair Trading
Pair trading is a market-neutral strategy that exploits temporary deviations between two historically correlated assets.
Example:
If Coca-Cola and Pepsi usually move together, but Pepsi lags temporarily, traders may go long Pepsi and short Coca-Cola, betting the relationship will revert.
b. Hedging with Negative Correlations
Traders can use negatively correlated instruments to offset risk. For instance:
Long positions in the stock market can be hedged by taking positions in safe-haven assets like gold or the Japanese Yen.
c. Sector Rotation and ETF Strategies
Investors track sector correlations with broader indices to identify leading and lagging sectors.
For example:
If financial stocks start outperforming the S&P 500, this could signal a shift in the economic cycle.
d. Currency and Commodity Correlations
Currencies are deeply linked to commodities:
The Canadian Dollar (CAD) often correlates positively with crude oil prices.
The Australian Dollar (AUD) correlates with gold and iron ore prices.
The Swiss Franc (CHF) is often inversely correlated with global risk sentiment, acting as a safe haven.
Traders can exploit these relationships for cross-market opportunities.
6. Case Studies of Correlation in Action
a. Gold and the U.S. Dollar
Gold is priced in dollars; therefore, when the USD strengthens, gold usually weakens as it becomes more expensive for other currency holders.
During 2020’s pandemic uncertainty, both assets briefly rose together — a rare situation showing correlation can shift temporarily under stress.
b. Oil Prices and Inflation
Oil serves as a barometer for inflation expectations. When crude prices rise, inflation fears grow, prompting central banks to tighten policies.
Traders who monitor this relationship can anticipate policy shifts and market reactions.
c. Bitcoin and Tech Stocks
In recent years, Bitcoin has shown increasing correlation with high-growth technology stocks. This suggests that cryptocurrency markets are influenced by risk sentiment similar to the equity market.
7. Benefits of Mastering Correlation Strategies
Enhanced Market Insight: Understanding inter-market dynamics reveals the underlying forces driving price movements.
Stronger Portfolio Construction: Diversify effectively by choosing assets that truly offset one another.
Smarter Risk Control: Correlation analysis highlights hidden exposures across asset classes.
Improved Trade Timing: Correlation signals help confirm or challenge technical and fundamental setups.
Global Perspective: By studying correlations, traders gain insight into how global events ripple through interconnected markets.
8. Challenges and Limitations
Despite its power, correlation analysis is not foolproof. Traders must be aware of its limitations:
Changing Relationships: Correlations evolve over time due to policy changes, crises, or shifting investor sentiment.
False Correlation: Sometimes two assets appear correlated by coincidence without a fundamental link.
Lag Effect: Correlation may not capture time delays between cause and effect across markets.
Overreliance: Correlation is one tool among many; combining it with technical, fundamental, and sentiment analysis produces more reliable outcomes.
9. Advanced Correlation Techniques
a. Cointegration
While correlation measures relationships at a moment in time, cointegration identifies long-term equilibrium relationships between two non-stationary price series.
For example, even if short-term correlation fluctuates, two assets can remain cointegrated over the long run — useful in statistical arbitrage.
b. Partial Correlation
This method isolates the relationship between two variables while controlling for others. It’s particularly helpful in complex portfolios involving multiple correlated instruments.
c. Dynamic Conditional Correlation (DCC) Models
These advanced econometric models (used in quantitative finance) measure time-varying correlations — essential for modern algorithmic trading systems.
10. Building a Correlation-Based Trading System
A professional correlation strategy can be structured as follows:
Data Collection: Gather historical price data for multiple assets.
Statistical Analysis: Calculate correlations and rolling relationships using software tools.
Strategy Design: Develop pair trades, hedges, or intermarket signals based on correlation thresholds.
Backtesting: Validate the system across different market phases to ensure robustness.
Execution and Monitoring: Continuously update correlation data and adjust positions as relationships evolve.
Risk Control: Implement stop-loss rules and diversification limits to prevent overexposure to correlated positions.
11. The Future of Correlation Strategies
In an era of high-frequency trading, AI-driven analytics, and global macro interconnectedness, correlation strategies are evolving rapidly. Machine learning models now identify non-linear and hidden correlations that traditional statistics might miss.
Furthermore, as markets integrate further — with crypto, ESG assets, and alternative data sources entering the scene — understanding these new correlations will be crucial for maintaining an edge in trading.
12. Final Thoughts
Mastering correlation strategies isn’t just about mathematics — it’s about understanding the language of global markets. Every movement in commodities, currencies, and indices tells a story about how capital flows across the world.
A trader who comprehends these relationships gains not only analytical power but also strategic foresight. By mastering correlation analysis, you move beyond isolated price charts and see the interconnected web that drives the global financial ecosystem.
In essence, correlation strategies are the bridge between micro-level technical trades and macro-level economic understanding. Those who can navigate this bridge with confidence stand at the forefront of modern trading excellence — armed with knowledge, precision, and an unshakable sense of market direction.
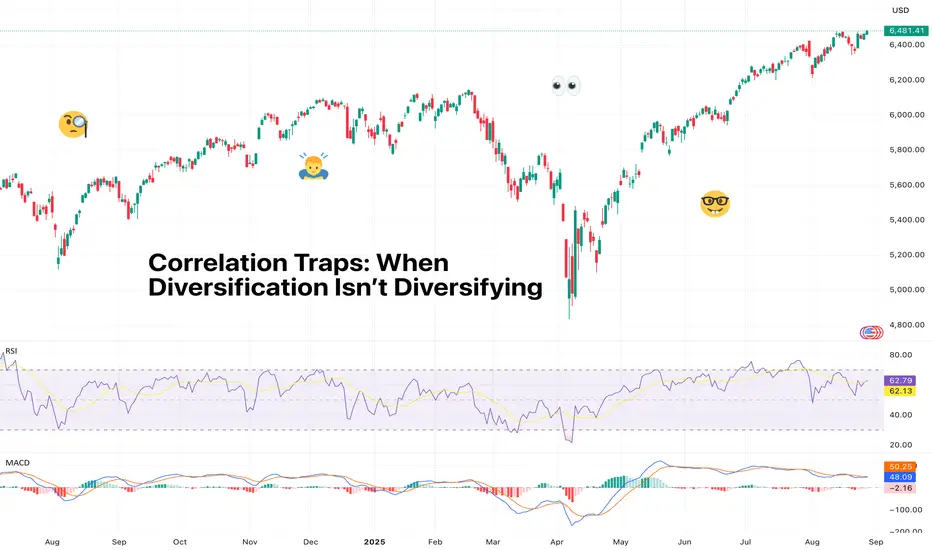
Correlation Traps: When Diversification Isn’t DiversifyingYou thought you were diversified. You had tech, energy, crypto, gold — a little bit of everything. Then a single headline nuked your entire portfolio in one day. Welcome to the sneaky world of correlation traps.
🧩 The Diversification Myth
Everyone loves to brag about their diversified portfolio. Some Tesla NASDAQ:TSLA here, Rocket Lab NASDAQ:RKLB there, maybe sprinkle in some Solana COINBASE:SOLUSD “for balance.”
But if your carefully curated mix of assets moves in the same direction every time Powell says “Good afternoon” at a Fed event… are you really diversified? Or are you just collecting different-shaped eggs in the same basket?
This is the correlation trap — the illusion of safety when your assets are secretly plotting against you. On paper, your portfolio says “hedged.” In practice, one bad CPI ECONOMICS:USCPI print, a tariff tweet, or an AI bubble hiccup can torch your entire P&L statement for the month.
And it works both ways. When Powell signals cuts, everything rallies: stocks, crypto, commodities, even meme ETFs. Suddenly, your “balanced” portfolio becomes a leveraged bet on a single narrative.
📉 Positive Correlation = Double Trouble
Correlation measures how two assets move relative to each other. Positive correlation means they tend to move together. That sounds fine on the upside — everyone’s a genius in bull markets. But when the markets get stressed, it doesn’t really matter if you’re holding traditional stocks or crypto assets.
Here's an example. March 2020. The S&P 500 SP:SPX cratered. Bitcoin BITSTAMP:BTCUSD lost more than half of its value in a week. Gold OANDA:XAUUSD dipped. Even safe-haven treasury ETFs had a panic moment. When markets really go risk-off, assets that are usually uncorrelated can suddenly drop in sync.
Why does this happen? Herd behavior, mostly. When traders, funds, and algos all unwind positions at once, correlations spike. In times of panic, cash is king.
🛡️ Negative Correlation = Your Actual Friend
True diversification comes from mixing assets with low or negative correlation. Historically, think equities vs. treasuries, or stocks vs. gold. When risk assets like stocks get wrecked, safe-haven assets like gold often move up to soften the blow.
But even these aren’t bulletproof anymore. Rising inflation, aggressive tariff broadside, and geopolitical headlines can disrupt traditional correlations. Traders relying on “old rules” learn quickly that markets evolve, and yesterday’s safe havens don’t always save you today.
Traders often assume “low correlation” equals “zero risk” or “perfect hedge.” Not really. Low correlation can vanish during high-volatility events — exactly when you need it the most.
Correlation creep is real — and unless you check, you could be risking more than you think.
🧠 Trading Psychology Meets Correlation
Correlation traps aren’t just technical — they can mess with your thinking. Traders often overestimate how diversified they are, which breeds overconfidence. You assume your downside is limited… until a risk event wipes you out across positions you thought were independent.
The result? Revenge trading . Over-sizing. Ignoring stop-losses. The correlation trap becomes a psychological spiral if you don’t plan your true exposure correctly.
🛠️ Avoiding the Trap: Practical Moves That Work
Run the numbers. You’ve built out a perfect portfolio? Check where your picks are coming from and where they fit using the TradingView Heatmaps and Screeners .
Diversify by driver, not ticker. If multiple assets react to the same narrative, you’re likely not truly diversified.
Add true hedges. Bonds, gold, cash, and volatility products can help — but only if you size them correctly.
Watch cross-asset flows. Use correlations between equities, commodities, FX, and crypto to spot when risk is clustering.
The key takeaway? Diversification isn’t about owning “a little of everything.” It’s about owning different risk exposures.
👉 Bottom Line
Diversification fails when you mistake quantity for quality. Five correlated trades don’t make you hedged; they make you levered without you knowing it.
Correlation traps creep up quietly, especially during euphoric rallies when every chart goes up together. But when sentiment flips — and it does flip — you find out real quickly what’s actually diversified and what isn’t.
Next time someone brags about holding “uncorrelated” assets, ask them one question: “Did they all move the same way on the last CPI print ?” If the answer’s yes, maybe it’s time to rethink what diversification really means.
Off to you : How do you balance your portfolio? Or maybe you’re not after diversification and instead you’re chasing concentration? Share your approach in the comments!
Decoding the BTC-ES Correlation During FOMC Meetings1. Introduction
The Federal Open Market Committee (FOMC) meetings are pivotal events that significantly impact global financial markets. Traders across asset classes closely monitor these meetings for insights into the Federal Reserve’s stance on monetary policy, interest rates, and economic outlook.
In this article, we delve into the correlation between Bitcoin futures (BTC) and E-mini S&P 500 futures (ES) during FOMC meetings. Focusing on the window from one day prior to one day after each meeting, our findings reveal that BTC and ES exhibit a positive correlation 63% of the time. This relationship offers valuable insights for traders navigating these volatile periods.
2. The Significance of Correlations in Market Analysis
Correlation is a vital tool in market analysis, representing the relationship between two assets. A positive correlation indicates that two assets move in the same direction, while a negative correlation implies they move in opposite directions.
BTC and ES are particularly intriguing to study due to their distinct market segments—cryptocurrency and traditional equities. Observing how these two assets interact during FOMC meetings provides a window into macroeconomic forces that affect both markets.
The key finding: BTC and ES are positively correlated 63% of the time around FOMC meetings. This suggests that, despite their differences, both markets often react similarly to macroeconomic developments during these critical periods.
3. Methodology and Data Overview
To analyze the BTC-ES correlation, we focused on a specific timeframe: one day before to one day after each FOMC meeting. Daily closing prices for both assets were used to calculate correlations, providing a clear view of their relationship during these events.
The analysis includes data from multiple FOMC meetings spanning several years. The accompanying charts—such as the correlation heatmap, table of BTC-ES correlations, and line chart—help visualize these findings, highlighting the periods of positive and negative correlation.
Contract Specifications:
o E-mini S&P 500 Futures (ES):
Contract Size: $50 x S&P 500 Index.
Minimum Tick: 0.25 points, equivalent to $12.50.
Initial Margin Requirement: Approximately $15,500 (subject to change).
o Bitcoin Futures (BTC):
Contract Size: 5 Bitcoin.
Minimum Tick: $5 per Bitcoin, equivalent to $25 per tick.
Initial Margin Requirement: Approximately $112,000 (subject to change).
These specifications highlight the differences in notional value and margin requirements, underscoring the distinct characteristics of each contract.
4. Findings: BTC and ES Correlations During FOMC Meetings
The analysis reveals several noteworthy trends:
Positive Correlations (63% of the time): During these periods, BTC and ES tend to move in the same direction, reflecting shared sensitivity to macroeconomic themes such as interest rate adjustments or economic projections.
Negative Correlations: These occur sporadically, suggesting that, in certain scenarios, BTC and ES respond differently to FOMC announcements.
5. Interpretation: Why Do BTC and ES Correlate?
The observed correlation between Bitcoin futures (BTC) and E-mini S&P 500 futures (ES) around FOMC meetings can be attributed to several factors:
Macro Sensitivity: Both BTC and ES are heavily influenced by macroeconomic variables such as interest rate decisions, inflation expectations, and liquidity changes. The FOMC meetings, being central to these narratives, often create synchronized market reactions.
Institutional Adoption: The increasing participation of institutional investors in Bitcoin trading aligns its performance more closely with traditional risk assets like equities. This is evident during FOMC events, where institutional sentiment towards risk assets tends to align.
Market Liquidity: FOMC meetings often drive liquidity shifts across asset classes. This can lead to aligned movement in BTC and ES as traders adjust their portfolios in response to policy announcements.
This correlation provides traders with actionable insights into how these assets might react during future FOMC windows.
6. Forward-Looking Implications
Understanding the historical correlation between BTC and ES during FOMC meetings offers a strategic edge for traders:
Hedging Opportunities: Traders can use the BTC-ES relationship to construct hedging strategies, such as using one asset to offset potential adverse moves in the other.
Volatility Exploitation: Positive correlation periods may signal opportunities for trend-following strategies, while negative correlation phases could favor pairs trading strategies.
Risk-On/Risk-Off Cues: The alignment or divergence of BTC and ES can act as a barometer for market-wide sentiment, aiding decision-making in other correlated assets.
Future FOMC events could present similar dynamics, and traders can leverage this data to refine their approach.
7. Risk Management Considerations
While correlations provide valuable insights, they are not guaranteed to persist. Effective risk management is crucial, particularly during volatile periods like FOMC meetings:
Stop-Loss Orders: Ensure every trade is equipped with a stop-loss to cap potential losses.
Position Sizing: Adjust position sizes based on volatility and margin requirements for BTC and ES.
Diversification: Avoid over-concentration in highly correlated assets to reduce portfolio risk.
Monitoring Correlations: Regularly assess whether the BTC-ES correlation holds true during future events, as changing market conditions could alter these relationships.
A disciplined approach to risk management enhances the probability of navigating FOMC volatility successfully.
8. Conclusion
The correlation between Bitcoin futures (BTC) and E-mini S&P 500 futures (ES) around FOMC meetings highlights the interconnected nature of modern financial markets. With 63% of these events showing positive correlation, traders can glean actionable insights into how these assets react to macroeconomic shifts.
While the relationship between BTC and ES may fluctuate, understanding its drivers and implications equips traders with tools to navigate market volatility effectively. By combining historical analysis with proactive risk management, traders can make informed decisions during future FOMC windows.
When charting futures, the data provided could be delayed. Traders working with the ticker symbols discussed in this idea may prefer to use CME Group real-time data plan on TradingView: www.tradingview.com - This consideration is particularly important for shorter-term traders, whereas it may be less critical for those focused on longer-term trading strategies.
General Disclaimer:
The trade ideas presented herein are solely for illustrative purposes forming a part of a case study intended to demonstrate key principles in risk management within the context of the specific market scenarios discussed. These ideas are not to be interpreted as investment recommendations or financial advice. They do not endorse or promote any specific trading strategies, financial products, or services. The information provided is based on data believed to be reliable; however, its accuracy or completeness cannot be guaranteed. Trading in financial markets involves risks, including the potential loss of principal. Each individual should conduct their own research and consult with professional financial advisors before making any investment decisions. The author or publisher of this content bears no responsibility for any actions taken based on the information provided or for any resultant financial or other losses.

Understanding Forex CorrelationA Comprehensive Guide to Forex Pair Correlation Strategies
Forex correlation is a powerful tool that can help traders understand how currency pairs move in relation to each other. It’s an essential concept that, when used correctly, can improve risk management, enhance profits, and provide valuable insights into the behavior of different currency pairs.
The image you've provided breaks down key aspects of forex pair correlation, including positive correlation, negative correlation, and hedging strategies. In this article, we’ll dive deeper into what forex correlation is, how it works, and how you can use it to your advantage in your trading strategies.
What Is Forex Correlation?
Forex correlation refers to the relationship between the movements of two different currency pairs. When two currency pairs move in tandem or in opposite directions, they are said to be correlated. Correlation can be positive, where both pairs move in the same direction, or negative, where the pairs move in opposite directions.
Traders use correlation data to understand potential risks and opportunities. Understanding the relationships between currency pairs allows you to diversify your trades, hedge positions, or double down on strategies based on the expected movements of correlated pairs.
Types of Forex Correlations
1. Positive Correlation
When two currency pairs move in the same direction, they are said to have a positive correlation. For example, EUR/USD and GBP/USD often have a positive correlation because both pairs share the USD as the base currency, and they tend to respond similarly to events affecting the U.S. dollar.
Example of Positive Correlation: If EUR/USD is rising, GBP/USD is also likely to rise due to the influence of the U.S. dollar.
Strategy for Positive Correlation: Traders can use positive correlation to open the same-direction positions in both pairs to amplify gains. However, keep in mind that a highly correlated pair will also double your risk if the market moves against you.
2. Negative Correlation
When two currency pairs move in opposite directions, they are said to have a negative correlation. For instance, USD/JPY and EUR/USD often have a negative correlation. When the U.S. dollar strengthens against the Japanese yen (USD/JPY), it may weaken against the euro (EUR/USD).
Example of Negative Correlation: If EUR/USD is rising, USD/JPY may be falling due to changes in the strength of the U.S. dollar.
Strategy for Negative Correlation: Traders can open opposite-direction positions in negatively correlated pairs to offset potential losses. For example, if you are long on USD/JPY and the trade turns against you, holding a short position in EUR/USD can help balance the loss.
How to Calculate Correlation
Correlation is typically measured on a scale from -1 to +1:
+1 means that two currency pairs are perfectly positively correlated. This means they will move in exactly the same direction at all times.
-1 means that two currency pairs are perfectly negatively correlated. This means they will always move in opposite directions.
0 means no correlation exists, meaning the pairs move independently of each other.
Many trading platforms provide correlation matrices or tools to help you understand the correlation between different pairs. These can be updated in real time or calculated over different time frames (daily, weekly, or monthly).
Why Forex Correlation Matters for Traders
Understanding forex correlation is crucial for several reasons:
1. Risk Management
By using correlation strategies, you can manage your risk more effectively. For example, if you have two highly correlated positions, you're effectively doubling your exposure to the same market conditions, which can increase risk. On the other hand, trading negatively correlated pairs can help reduce exposure to one-sided market movements.
2. Diversification
Forex correlation helps you diversify your portfolio by balancing positively and negatively correlated pairs. Proper diversification ensures that you aren’t overly exposed to one currency or market, providing better protection against volatile market movements.
3. Hedging Opportunities
As shown in the image, hedging with correlations allows traders to use correlated pairs to balance risk and protect investments. If one pair moves against you, a correlated position in another pair can help minimize the loss. This is a strategy that advanced traders often use during periods of high market uncertainty.
Using Forex Correlation Strategies
1. Hedging with Correlations
A popular strategy involves using negatively correlated pairs to hedge positions. Let’s say you have a long position in EUR/USD. You might take a short position in USD/CHF to reduce exposure to potential USD weakness. If the U.S. dollar weakens, your EUR/USD trade may incur a loss, but the short USD/CHF position can offset that loss.
2. Trading Positively Correlated Pairs
When trading positively correlated pairs, you can open same-direction positions to amplify gains. For instance, if you anticipate the U.S. dollar weakening and are bullish on both the euro and the British pound, you might go long on EUR/USD and GBP/USD. In this case, your profits could multiply if both trades move in your favor. However, this strategy also increases risk since losses would be compounded if the U.S. dollar strengthens instead.
3. Avoiding Over-Exposure
While correlation strategies can help increase profits or hedge risks, they can also lead to overexposure if not carefully managed. For example, trading multiple highly correlated pairs (e.g., EUR/USD, GBP/USD, AUD/USD) simultaneously can result in taking on too much risk in a single direction, especially if the market turns against you.
To avoid overexposure:
Check correlation matrices regularly to understand current correlations.
Adjust trade sizes based on the degree of correlation between pairs.
Avoid trading multiple pairs that have a perfect or near-perfect correlation unless you are intentionally doubling down on a strategy.
When to Use Forex Correlation Strategies
During High Volatility: Correlation strategies are particularly useful when the market is volatile, and you want to either reduce your risk through hedging or amplify your profits by trading positively correlated pairs.
Economic News Events: Major news events often affect several currency pairs simultaneously. By understanding the correlations between pairs, you can plan for potential reactions and adjust your strategy accordingly.
Portfolio Balancing: Long-term traders can use forex correlations to balance their portfolios, ensuring they are not overly exposed to any single currency or market condition.
Conclusion
Forex correlation is an essential concept for traders seeking to manage risk, diversify portfolios, and maximize profits. By understanding how different currency pairs relate to each other, traders can build more robust strategies that leverage both positive and negative correlations.
Whether you're looking to hedge your positions, amplify your gains, or simply protect your investments, correlation strategies offer valuable tools for navigating the complex forex market. Be sure to incorporate correlation analysis into your overall trading plan to enhance your decision-making process and boost your chances of success in the forex market.
Happy trading!

Why Gold and DXY Rise Together in Times of UncertaintyIn times of market uncertainty, investors often seek refuge in assets considered safe havens, such as gold and the US Dollar Index (DXY). While traditionally these two assets exhibit a negative correlation, meaning when one rises, the other tends to fall, their simultaneous ascent during periods of uncertainty might seem counterintuitive at first glance. However, a deeper understanding reveals the underlying dynamics driving this phenomenon.
Firstly, let's explore gold's role as a safe haven asset. Gold has long been revered as a store of value and a hedge against economic instability and geopolitical turmoil. During times of uncertainty, investors flock to gold as a reliable store of wealth, driving up its price. This demand surge can outweigh any negative impact from a stronger US dollar, leading to both gold and DXY rising concurrently.
On the other hand, the US Dollar Index (DXY) also garners safe haven status during times of uncertainty. The US dollar is widely considered the world's reserve currency and is backed by the largest and most stable economy globally. Consequently, investors often seek refuge in the US dollar during periods of market turmoil, further boosting its value.
Moreover, the correlation between gold and the US dollar is not solely determined by economic factors but also influenced by investor sentiment and market dynamics. During times of heightened uncertainty, investor behavior can drive unusual correlations as market participants prioritize capital preservation over traditional market relationships.
Furthermore, it's crucial to consider the broader macroeconomic landscape. Factors such as central bank policies, geopolitical tensions, and global economic outlook play significant roles in shaping investor sentiment and asset prices. Changes in these factors can lead to shifts in the relationship between gold and the US dollar, especially during times of uncertainty when market participants reassess risk and allocate capital accordingly.
In conclusion, while gold and the US dollar may traditionally exhibit a negative correlation, their simultaneous rise during times of uncertainty underscores their status as safe haven assets. Understanding the complex interplay of economic fundamentals, investor sentiment, and market dynamics is essential for comprehending the nuances of asset relationships, particularly during turbulent times in the financial markets.

Negative Correlation Between Gold & USDJPYThere is a -94% correlation on the weekly timeframe (also known as negative correlation) between Gold & the Japanese Yen.
GOLD📉
=
USDJPY📈
When one market moves up, there is a high probability the other market will move down. Knowing this allows you to mitigate your risks, by not opening similar positions in both markets.

The top Forex Market correlations1-Gold (XAU/USD) and AUD/USD: Gold prices often exhibit a positive correlation with the Australian dollar (AUD/USD). Australia is a major producer of gold, and the Australian dollar is sensitive to changes in gold prices. When gold prices rise, AUD/USD tends to appreciate, and when gold prices fall, AUD/USD tends to weaken.
2-Gold (XAU/USD) and USD Index (DXY): Gold prices tend to have a negative correlation with the US Dollar Index (DXY). When the DXY strengthens, gold prices often weaken, and when the DXY weakens, gold prices tend to strengthen. This inverse relationship is because gold is priced in US dollars, and a stronger dollar makes gold more expensive for holders of other currencies.
3-S&P 500 Index and USD/JPY: The USD/JPY currency pair often exhibits a positive correlation with the S&P 500 Index. When the S&P 500 Index rises, USD/JPY tends to appreciate, and when the index falls, USD/JPY tends to weaken. This correlation is because both assets are seen as risk-on indicators, meaning they tend to move in the same direction in response to changes in market sentiment.
4-Crude Oil (WTI) and CAD/JPY: Crude oil prices, particularly West Texas Intermediate (WTI) crude, often have a positive correlation with the Canadian dollar/Japanese yen (CAD/JPY) currency pair. Canada is a major exporter of oil, and the Canadian dollar is sensitive to changes in oil prices. When oil prices rise, CAD/JPY tends to appreciate, and when oil prices fall, CAD/JPY tends to weaken.

Negative Correlations in Trading: FULL GUIDEEmbarking on a journey in the world of trading demands a profound understanding of market intricacies. One often-overlooked yet powerful aspect is the domain of negative correlations — the intricate dance where the movement of one asset influences another inversely. This guide aims to be your compass in navigating these complex waters, exploring real-world examples, and providing strategies to harness this knowledge for astute and strategic trading.
Section 1: Unraveling the DXY-BTC Dynamic: Understanding Dollar-Bitcoin Connections
1. The Dance of DXY and BTC:
Delve into the intricate relationship between the U.S. Dollar Index (DXY) and Bitcoin.
Grasp the nuances of how a strengthening DXY tends to exert a weakening influence on Bitcoin and vice versa.
2. Leveraging the DXY-BTC Correlation:
Explore scenarios where the correlations of DXY and Bitcoin align.
Discuss long-term trading strategies that arise from discerning the interconnectedness of these two prominent assets.
Section 2: Discorrelation RSI: Decoding Signals Amidst Market Chaos
1. Understanding Discorrelation RSI:
Introduce the concept of discorrelation RSI, where RSI signals diverge from price action.
Emphasize the significance of recognizing when RSI provides a more accurate reflection of market sentiment.
2. Trading Wisdom with RSI Signals:
Analyze real-world examples where RSI forms a higher low while the price chart indicates a lower low.
Illuminate actionable strategies for entering long positions based on RSI signals during instances of price divergence.
Section 3: Structural Manipulation: Navigating Opportunities Amidst Deceptive Markets
1. OP Case Study: Structural Manipulation vs. RSI Insights:
Explore the dynamics of the OP token, where structural lows are seemingly updated on the price chart.
Unveil instances where RSI provides a more accurate representation of market conditions, presenting buying opportunities during purported oversold conditions.
2. Seizing Opportunities in Manipulation:
Discuss the art of discerning manipulation from genuine market conditions.
Explore how negative correlations can guide traders to capitalize on opportunities created by market manipulation.
Section 4: Crafting Your Strategy: Navigating the Complexities of Negative Correlations
1. Building a Trading Plan:
Outline the essential components of a comprehensive trading plan that incorporates insights from negative correlations.
Emphasize the need for adaptability and ongoing analysis to refine trading strategies.
2. Risk Management in Negative Correlation Trading:
Discuss advanced risk management strategies tailored to the nuances of negative correlations.
Highlight the importance of position sizing and the judicious use of stop-loss orders.
Conclusion: Orchestrating Success in Market Dynamics
As you conclude this profound exploration of negative correlations in trading, envision the market as a symphony of interconnected instruments. The ability to recognize and leverage negative correlations adds a powerful melody to your trading strategy. Regularly revisit and refine your approach, staying attuned to evolving market conditions, and use negative correlations as a guiding force in your trading journey.
💡 Deciphering Negative Correlations | 🔄 DXY-BTC Symphony | 📊 RSI Discorrelation Strategies | 🎭 Unmasking Structural Manipulation
💬 Engage in the discourse: Share your experiences in trading based on negative correlations, pose thoughtful questions, and connect with a community dedicated to mastering the dynamic nuances of the market. 🌐✨

Domination of USDT + USDC and lows/maxims of BTC. CorrelationIn the graph, combined into one graph of the dominance of such stablecoins as USDT and USDC.
Orange color—chart of the bitcoin price against the dollar.
The time interval is 1 week. The graph is logarithmic.
The same chart and the same parameters on the candlestick chart .
All BTC price lows and highs are specially shown. Compare what the capitalization of stablecoins was at the time.
At an earlier time, the dominant stablecoin was one USDT, later USDC was added. They occupy a significant capitalization. BUSD and DAI are less capitalized. They too can be added to this “indicator” of the Pumps/Dumps market.
I think the dominance history and the bitcoin overlay chart illustrate well which market phase and in which areas to buy and sell bitcoins and other speculative crypto coins.
Centralized Stablecoin capitalization of a decentralized market .
Sounds crazy, doesn't it? The dominance of centralized in a decentralized market. The 3rd,4th,6th places are naturally occupied by centralized stablecoins such as: #USDT #USDC #BUSD.
This kind of decentralized cryptocurrency financial world (freedom from the dictatorship of banks, power states, and so on) did you imagine, for example, in 2015-2017? Is it good or bad? What will happen after a while? What trend will develop further after the community bait has been swallowed?
3rd place . USDT ( .... "Reds" .... )
$67,562,687,657
4th place . USDC (Circle, Coinbase, JPMorgan, Blackrock .... )
$51,726,419,583
6th place . BUSD (Binance)
$20,003,320,692
13th place DAI ETH (!)
BTC and ETH dominance.
Continuing on this “democracy” theme of crypto sandbox capitalization. Today 14 09 2022.
Market Cap: $989,560,104,72
Dominance:
#BTC: 38.9%
#ETH: 19.9%
Total 2 assets: 58,7%
Also add 3,4,6,13 top stablecoins to this.
Stablecoins over 20%.
Almost 60% of the market is 2 assets.
Over 80% of the market is 6 assets.
So much for the true mythology of decentralization ))).
How to look for a “live chart” for yourself and combine the dominance of USDT and USDC:
1) Look for the MARKET CAP USDT DOMINANCE, %
2) On the right side of the chart in the search field, press the + button
3) Write MARKET CAP USDC DOMINANCE, %.
For the analysis, it will also be useful to track at the same time:
1) BTC dominance
2) US dollar index (DXY, USDX)
BTC dominance
BTC to altcoin dominance. Stablecoin dominance and market pamp.
US Dollar Index (Fed)with prices of BTC lows/maxims. Correlation of assets.
DXY and PampDump BTCMarkets Cycles.
This is what it looks like on a line chart to illustrate simple correlation things.
Preparedness for force majeure.
I would also like to say that all stabelcoins are focused on the "stability" of the U.S. dollar. Think about what would happen if, for some reason, that stability were to be undermined in the blink of an eye. Then you are faced with a very difficult choice.
What to do? Sell/buy cryptocurrency/shares? Just think ahead "What do you do" if, purely hypothetically, for some fantastic, hard-to-imagine reasons this happens. Think ahead in today's calm time (are you sure it's not calm now?), so you won't be caught off guard in a turbulent time.

Correlation between different assetsCorrelation is a measure that establishes the degree of relationship between different assets. It is measured on a scale of +100% to -100%.
In the case of a +100% correlation (perfect positive correlation), both assets move in an identical manner in the market. Conversely, if the correlation is -100% (perfect negative correlation), we are talking about two assets that move in an exactly opposite manner.
Correlation is a crucial measure to consider because not being aware of the correlations between assets could inadvertently increase our risk. For example, if we open a sell position in NDJPY and another with the same lot size in NZDUSD based on an analysis conducted on the 4H timeframe, we would be multiplying our risk by 2 due to the high correlation between both assets in that timeframe (88%). The correct way to handle this situation may be to either reduce the risk of both trades by half or only trade the pair with a clearer scenario in your analysis.

Educational: Balancing your watchlist Let's imagine it is Sunday, and you're preparing your watchlist for the week.
You use the market scanner to create your watchlist. You can learn about the market scanner here:
📊Your list contains:
PEPPERSTONE:EURUSD PEPPERSTONE:GBPJPY PEPPERSTONE:GBPUSD PEPPERSTONE:NZDJPY PEPPERSTONE:XAUUSD PEPPERSTONE:USDJPY
It's now Monday, and you start to trade. At the end of the week, you check your results and you have about a 50% win rate. For every win that you got, you experienced a loss, and your trades were very close in time to each other. What has likely happened here is that you did not balance your watchlist before the start of the trading week.
📊 What is correlation :
In trading, pair correlation refers to the statistical measure of the relationship or association between two or more financial instruments, typically stocks or other securities. It quantifies how the prices of these instruments move in relation to each other over a given period.
Pair correlation analysis helps traders and investors identify and exploit potential trading opportunities. By studying the historical price movements of two instruments, traders can gain insights into their relationship and make informed decisions.
The pair correlation coefficient is a common measure used to assess the degree of correlation between two instruments. It ranges from -1 to +1. A correlation coefficient of +1 indicates a perfect positive correlation, meaning that the prices of the two instruments move in the same direction. Conversely, a correlation coefficient of -1 indicates a perfect negative correlation, where the prices move in opposite directions. A correlation coefficient of 0 signifies no correlation, indicating that the prices of the two instruments are unrelated. (note that some programs might use a different scale to determine correlation but these are industry standards)
📊 How it affected your trades:
If you are experiencing a phenomenon where your setups/trades are being triggered around the same time, and it often happens that one trade runs in profit while the other does not, you are likely experiencing a negative correlation between the pairs in your watchlist.
If you are opening buy positions on two pairs, but one is negatively correlated with the other, you are very likely to experience a loss in one of those trades.
As we can see in the image, if you had entered a buy position on both pairs, one would end up being a losing position due to the negative correlation.
📊 How to combat this issue:
🔹When creating your watchlist, it is a good idea to note the correlation between all the pairs and create a subsection marked for negative and positive correlation. This way, if you get a buy signal on two pairs that are currently negatively correlated, you can determine which signal has a higher chance of being accurate and execute the trade only on that pair. Usually, the pair with the most confluence for the buy or sell position has a higher chance of being correct.
🔹Execute trades with a risk-to-reward ratio of more than 1:1. This way, even if you execute both trades and one goes against you, you can still make a profit overall. Please refer to the diagram below.
📊 How to check pair asset correlation:
There are several ways to check the correlation between assets. I won't recommend any specific third-party websites here, but you can search for "forex correlation" on a search engine to find various websites that offer this feature. Alternatively, you can search for an indicator on TradingView that provides correlation analysis.
One being, Script by :@LeviathanCapital

3 Key Entry Rules to Boost Your Trading PerformanceToday I want to share with you this topic: the 3 Entry Rules to Boost Your Trading Performance.
Over the 20,000 traders that we have coached over the time via conferences and talks we’ve done all over the world, we have found one of the challenges that traders have is that they find themselves locked into a trade and then being stopped out when they enter into trade. So their entries are not really optimized or they are not getting the right timing for their entries. Sometimes they come during a coaching session; they say ‘Thiru, I need some help with my entry.’ So this topic, the 3 Entry Rules, can actually help you optimize your entry and overall improve your strategy performance. This is what we’re going to be looking at today in this video.
The first one is what we call “ Time Frame Correlation ,” the short form abbreviation TFC. In TFC one thing you do have to remember when you’re correlating the different time frames is that you’ve got to remember three times. Some of you may be wondering ‘What do you mean by three times?’ What I mean is that for example if you are an intra-day trader trading on a shorter time frame, like a one hour time frame, then you need to be looking at three time frames at least altogether, so the one hour and each of the time frames has to be three times the one that you are trading on, three times or four times. Now let me explain by way of an example: If you are trading on a one hour time frame, then we are looking at maybe three to four hours (1 x 4 = 4 hours) and then after that, you want four times that, approximately that is a daily time frame, 16 hours is a daily time frame.
What we’re looking at is to correlate the times frames before we take the trade. We are usually looking at three time frames and each time frame is three times each other. For example, if you are an end of day trader and you want to enter your position onto a four hour time frame then you can start to look at daily time frame and then three to four times that would be a weekly time frame as well that you’re looking at.
Let me explain why this is important. For example, imagine this – you would have probably experienced this – in a one hour time frame it looks like it’s going down and you are thinking it is looking like a very good short sell as the direction is going further down. You put your entry over here and let’s say you put your stop loss over here and you’re good to go. Let’s say your target is somewhere around there. In the next hour the trade then triggers you in and starts to go towards your target, everything is well and rosy. You are happy, you’re in profit and you are thinking ‘it is only a matter of time before I reach my target.’ Then what happens? You know the usual thing, you would have experienced it if you have traded or if you are trading at the moment as well, it will start to reverse and where your stop loss is – let’s say other traders have their stop loss here as well – suddenly the market reverses and shoots up and takes up all the stops. I’m sure you have experienced this.
Now why does that happen? It is because, if you imagine this is the one hour time frame, if you didn’t correlate between the other time frames – the four hour and the daily time frame – and let’s say the four hour and the daily time frame are in an up-trend, if that is the case, then what happens is that the orders that are inside the daily time frame are being filled by the brokers and therefore the market is reversing to fill them up on a higher time frame. This is what is happening and this is why sometimes you get these sharp reversal moves in the market. It is very critical that you correlate the time frames before you start to take your position on the one hour time frame. In fact, in the last live trading we did where we were teaching a strategy that we called “stops to cash,” what we usually do is we take contrarian move on a one hour time frame where it looks like a perfect short, where beginners and even intermediates are getting into short position, but we are looking at a contrarian position in terms of the one hour time frame but when you align it to the higher time frames, it’s just in line with the trend. That’s all we’re doing here. What we’re saying is when everybody’s stops are being taken out, we are actually converting it to cash according to this time frame correlation. I believe that concept is well clear and nice now. Definitely do consider putting that into your entry rules.
The second entry rule we’re looking at is “ Indicators .” This is quite a critical one that you can put into your entry rules also to optimize your strategy performance. In terms of indicators, the usual common ones that we are looking at are Stochastic, RSI and for example CCI as well. These are familiar names, you have all heard of them. There are thousands of indicators, but the important thing is don’t just pick an indicator and just slam it onto the screen, but ask yourself what are you looking to achieve, what is the objective of your strategy? Then pick and choose your tools. For example, let’s say you’re driving your car and it starts to break down, you can’t just choose any old hammer or spanner. You have to analyze the problem first before choosing the tool that you want to use to repair the mistake or the fault on the car. It is the same thing here, as we are looking to optimize our strategy, we have to ask ourselves what is going to be the most efficient indicator to help me optimize my strategy performance and towards what objective? That is how you actually choose the indicator that you want to have on the screen in your strategy.
The last one we are looking at is “ Price Action .” Price Action is very critical because most of our strategies use price action. It is the fastest of them all. Some things the price won’t be able to tell you and that’s when we use indicators because it involves a lot of calculations. With price actions you notice some really powerful bar patterns that give you an edge in the market and then using all these three factors together that can give you a very strong edge against all the other 99% traders. For example, price action patterns can start to look like the low test bar starts to come up over here and it’s starting to show a reversal pattern. Or even things on a daily time frame where we are looking at something like a down trend and it is starting to reverse – all those critical price action patterns that can give you and edge.
So these three rules that’s I’ve just gone through with you right now can be so important to improving your whole strategy and your trading performance.
On a final note, what I want you to remember is that just using them by themselves is not enough as Traders. But using them in a cumulative manner strengthens your edge so strongly in the market and also optimizes and maximizes your trading performance for consistent profits.
I believe this has been very useful for you all and as we always say, til the next time stay disciplined, follow your trading plan and keep Trading like a Maste r.

Unlocking The Power Of Correlation In Forex Trading.What Is Correlation In Forex Trading?
Understanding the role of correlation is of paramount importance in the world of forex trading as it offers valuable insights into the intricate relationships between currency pairs. By delving into the depths of correlations, traders gain the ability to make well-informed decisions and effectively manage their risk. This comprehensive article aims to delve into the concept of correlation within forex trading, shedding light on crucial aspects such as the correlation coefficient, commonly observed correlation pairs, and practical examples of currency correlation strategies.
In forex trading, correlation refers to the statistical measure of how two currency pairs move in relation to each other. It helps traders identify patterns and trends by studying the historical relationship between pairs, which can be instrumental in forecasting future price movements. The correlation coefficient, often denoted as "r," ranges between -1 and +1. A correlation of +1 signifies a perfect positive correlation, where the pairs move in the same direction, while a correlation of -1 denotes a perfect negative correlation, implying that the pairs move in opposite directions. A correlation close to zero suggests a weak or non-existent relationship between the pairs.
Certain currency pairs are well-known for exhibiting strong correlations. For instance, the EUR/USD and GBP/USD pairs tend to show a positive correlation due to their close economic ties and geographical proximity. Conversely, the USD/JPY and EUR/JPY pairs often demonstrate a negative correlation as they are influenced by different factors such as monetary policies and economic indicators.
Traders can capitalize on currency correlations by implementing various strategies. One such strategy is the hedging approach, where traders open positions in positively correlated pairs to mitigate risk. Another strategy involves trading divergences, wherein traders identify situations where the correlation between pairs deviates from its typical pattern, potentially indicating an opportunity for profit.
Correlation Coefficient:
The correlation coefficient is a statistical measure that provides insights into the strength and direction of the linear relationship between two variables. Denoted by the symbol "r," it ranges from -1 to +1, representing different levels of correlation.
A correlation coefficient of +1 indicates a perfect positive correlation, meaning that the two variables move in the same direction with a strong linear relationship. For example, if variable A increases, variable B also increases proportionally.
Conversely, a correlation coefficient of -1 represents a perfect negative correlation, where the two variables move in opposite directions with a strong linear relationship. In this case, as variable A increases, variable B decreases proportionally.
A correlation coefficient of 0 suggests no linear relationship between the variables, indicating that changes in one variable do not consistently impact the other variable.
The magnitude of the correlation coefficient reflects the strength of the relationship. Values closer to +1 or -1 indicate a stronger correlation, while values closer to 0 suggest a weaker correlation.
It is important to understand that the correlation coefficient measures only linear relationships and does not capture non-linear associations between variables. Additionally, correlation does not imply causation, meaning that a high correlation between two variables does not necessarily imply that changes in one variable cause changes in the other variable.
What is it Positive Correlation:
Positive correlation refers to the relationship between two variables where they tend to move in the same direction. In forex trading, there are currency pairs that often exhibit a strong positive correlation. Here are a couple of examples:
EUR/USD and GBP/USD: These currency pairs commonly display a positive correlation. Both EUR/USD and GBP/USD are major currency pairs, and they are influenced by similar factors such as economic data from the Eurozone and the United States. When one pair experiences an upward or downward movement, the other pair tends to follow a similar pattern.
AUD/USD and NZD/USD: The Australian dollar (AUD) and New Zealand dollar (NZD) are both commodity currencies, meaning their value is closely tied to commodity prices. These two currency pairs often exhibit a positive correlation due to their geographical proximity and similar economic ties. When commodity prices rise or fall, it can affect both the AUD/USD and NZD/USD in a similar manner.
...And What is it Negative Correlation:
Negative correlation refers to the relationship between two variables where they tend to move in opposite directions. In forex trading, there are currency pairs that often exhibit a strong negative correlation. Here are a couple of examples:
USD/JPY and EUR/JPY: Both USD/JPY and EUR/JPY pairs tend to have a negative correlation. The Japanese yen (JPY) is considered a safe-haven currency, meaning that during times of increased risk aversion in the market, investors tend to seek the safety of the yen, causing it to strengthen. As a result, both USD/JPY and EUR/JPY pairs typically decrease in value, leading to a negative correlation between these pairs.
USD/JPY and Gold: Gold is also considered a safe-haven asset. When there is market uncertainty or increased risk aversion, investors often flock to both gold and the Japanese yen as safe-haven investments. This can result in a negative correlation between USD/JPY and the price of gold. If the price of gold increases, indicating heightened risk aversion, USD/JPY often decreases as the yen strengthens.
It's important to note that correlations can vary over time and are not static. Traders should regularly assess and monitor correlations to understand the current relationship between currency pairs. Additionally, it's essential to consider other factors and conduct thorough analysis before making trading decisions based on correlations.
No Correlation:
There are currency pairs in forex trading that do not exhibit a significant correlation, meaning their price movements do not show a consistent relationship. Here are a couple of examples:
USD/CHF and GBP/JPY: USD/CHF involves the US dollar (USD) and the Swiss franc (CHF), while GBP/JPY involves the British pound (GBP) and the Japanese yen (JPY). These pairs usually have different fundamental factors influencing their exchange rates, such as economic indicators, monetary policies, and geopolitical factors. As a result, they often do not demonstrate a significant correlation.
USD/CAD and EUR/GBP: USD/CAD involves the USD and the Canadian dollar (CAD), while EUR/GBP involves the euro (EUR) and the British pound (GBP). These currency pairs represent different combinations with unique economic drivers. The factors affecting the USD/CAD pair, such as oil prices and economic conditions in Canada and the US, may differ from those influencing the EUR/GBP pair, which is influenced by factors related to the eurozone and the UK. Therefore, these pairs often exhibit little correlation.
Here are some examples of currency correlation strategies that traders may employ in forex trading:
Hedging Strategy: Traders can utilize currency correlation to hedge their positions. For instance, if a trader is long on EUR/USD (anticipating it to rise) but also observes a strong negative correlation between EUR/USD and USD/CHF, they can take a short position on USD/CHF to hedge their risk. This way, if EUR/USD moves against their initial position, the potential losses can be offset or minimized by the gains in the short USD/CHF position.
Diversification Strategy: Currency correlation can aid in portfolio diversification. By identifying currency pairs with low or negative correlations, traders can spread their risk across different currency pairs and decrease their exposure to any single currency. For example, if a trader is bullish on EUR/USD, they may seek currency pairs with a negative correlation to EUR/USD, such as USD/JPY or USD/CHF, to diversify their positions.
Correlation Breakout Strategy: Traders may look for periods when the correlation between two currency pairs breaks down or significantly deviates from its historical norm. When a strong correlation breaks, it can present trading opportunities. For instance, if a historically positive correlation between EUR/USD and GBP/USD weakens or turns negative, a trader might consider taking opposite positions on the two pairs, expecting them to converge or revert to their usual correlation.
Carry Trade Strategy: Carry trade involves borrowing in a low-interest-rate currency and investing in a high-interest-rate currency to capitalize on the interest rate differential. Correlation analysis can assist traders in selecting currency pairs for carry trades. For example, if a trader identifies currency pairs with positive correlation and implements a carry trade on one of the pairs, they can potentially reduce risk by avoiding carry trades on correlated pairs to prevent overexposure.
How To Trade Forex Correlation Pairs:
To effectively trade forex correlation pairs, follow these steps:
Conduct market analysis: Stay informed about the currency pairs you are interested in trading and the factors that affect their correlation. Stay updated on economic indicators, central bank policies, geopolitical events, and other relevant news that impact currency markets.
Identify correlation opportunities: Analyze the correlation between currency pairs to find trading opportunities. Use correlation coefficients, historical data, and technical analysis tools to identify pairs with high or low correlations.
Develop a trading strategy: Based on your analysis, develop a trading strategy that aligns with your risk tolerance and goals. Decide whether you want to engage in hedging, pairs trading, or other correlation-based strategies. Create a trading plan that includes entry and exit points, risk management techniques, and position sizing guidelines.
Implement risk management: Prioritize risk management to protect your capital. Set stop-loss orders to limit potential losses and take-profit orders to secure profits. Consider your risk-reward ratio and position size to manage risk effectively.
Execute trades: When the conditions align with your trading plan, execute your trades through your trading platform. Monitor the market closely, and make adjustments or exit trades if the correlation dynamics change.
Regularly review and adapt: Continuously evaluate the performance of your correlation-based trading strategy. Adjust your approach as needed based on market conditions, correlation changes, and the results of your trades. Keep learning and improving your skills as a forex trader.
Conclusion:
In conclusion, correlation analysis is a valuable tool for forex traders to gain insights into the relationships between currency pairs and make more informed trading decisions. By understanding the correlations, traders can effectively hedge their positions, diversify their portfolios, identify breakout opportunities, and implement carry trades. However, it's crucial to recognize that correlations are not fixed and can evolve over time, requiring traders to regularly monitor and adjust their strategies. By incorporating correlation analysis into their trading approach, forex traders can enhance their understanding of market dynamics and potentially improve their trading outcomes.

Understanding Forex Correlation 📈📉Hello Traders! 😃 In this education idea, we are going to cover Forex Correlation and how you can use this information to help you make wise decisions in the market. Let's get started on this important topic...
What is Currency Correlation?
A currency correlation in forex is a positive or negative relationship between two separate currency pairs. A positive correlation means that two currency pairs move in tandem, and a negative correlation means that they move in opposite directions. Correlations can provide opportunities to realize a greater profit, or they can be used to hedge your forex positions and exposure to risk. If you can be certain that one currency pair will move alongside or against another, then you can either open another position to maximize your profits, or you could open another position to hedge your current exposure in case volatility increases in the market. However, if your forecasts are wrong when trading currency correlations, or if the markets move in an unexpected way, you could incur a steeper loss, or your hedge could be less effective than anticipated.
What is the Correlation Coefficient?
The correlation coefficient measures the correlation between different assets – in this case, currency pairs. It ranges from one number to another representing a perfect or negative correlation. For example, Mataf - www.mataf.net uses a correlation coefficient above 80 and positive to indicate that currencies move in the same way. It also uses a correlation coefficient above 80 and negative to show that the currencies move in the opposite way.
Why is it Important to Know if Currency Pairs are Positive or Negatively Correlated?
Currency correlation is important for traders to understand because it can have a direct impact on forex trading results, often without the trader’s awareness. As an example, assume that a trader buys two different currency pairs that are negatively correlated. The gains in one may be offset by losses in the other, which is often used as a hedging strategy. Meanwhile, buying two correlated pairs may double the risk and profit potential, since both trades will result in a loss or profit. They are not fully independent since the pairs move in the same direction.
What Are the Most Highly Correlated Currency Pairs?
The most highly correlated currency pairs are usually those with close economic ties. For example, EUR/USD and GBP/USD are often positively correlated because of the close relationship between the euro and the British pound – including their geographic proximity, and their status as two of the world’s most widely-held reserve currencies.
How to Trade Forex Pair Correlations?
You can trade forex pair correlations by identifying which currency pairs have a positive or negative correlation to each other. In the conventional sense, you would open two of the same positions if the correlation was positive, or two opposing positions if the correlation was negative. This is because if there was a perfect negative correlation between USD/CAD and AUD/USD having a long position on both pairs would effectively cancel each other out since the pairs would be assumed to move in opposing directions. But, if the correlation was perfectly positive, separate long positions on different pairs might help to increase your profits – or it could increase your losses if your forecasts are incorrect.
Final Thoughts
Before entering a trade with multiple positions, refer to a currency correlation chart to ensure that the pairs are positive or negatively correlated. It's important not to assume because some currency pairs may appear to move the same due to have the same base currency, but that is not always the case.
Traders, if you liked this idea and would like to see more education topics, please let me know in the comments! I'd love to hear your opinion! 😉

CORRELATION IN TRADINGHave you ever noticed a time when a certain product went up and another similar product went down at around the same time? Or when that product went down and another product also went down at the same time? If the answer is yes, then what you noticed was 'product correlation' in action.
What exactly is product correlation? In the financial markets, correlation is a statistical measure of how two products move in relation to each other. Product correlation tells us whether two products tend to move in the same or opposite direction or whether they move completely independently of each other without any discernible pairing pattern over a specific period of time.
Let us look at an example from a Forex (currency pair) trade (visual chart examples further below): If EURUSD goes up and USDJPY goes down, this is called a NEGATIVE correlation and if GBPUSD goes down and AUDUSD also goes down, this is called a POSITIVE correlation. When trading forex in particular, it is vital to remember that since currencies are traded in pairs, no one currency pair is ever totally isolated. Therefore, if you plan on trading more than one currency pair at a time, it is very important to understand how different currency pairs move in relation to each other. Correlation also applies to other types of products such as gold, silver, stocks and indices.
Let us take a more detailed look at how correlation is worked out. Correlation is computed into a number known as the "correlation coefficient". This number ranges between -1 and +1:
•Perfect negative correlation (an exact correlation coefficient of -1) means that the two respective products will move in the opposite direction 100% of the time.
•Perfect positive correlation (an exact correlation coefficient of +1) implies that the two respective products will move in the same direction 100% of the time.
•If the correlation is 0, the movements between the two respective products are said to have no correlation and their movements are completely independent from each other. In other words, there is no way to predict how one product will move in relation to the other.
POSITIVE CORRELATION
NEGATIVE CORRELATION
PLEASE NOTE!!! Although correlation exists in the financial markets, it is NOT set in stone as a guarantee. Firstly, the correlation coefficient between products in the financial markets is rarely, if ever, at +1 and -1. Secondly and more importantly, every individual product has its own UNIQUE supply and demand measures and also has buyers and sellers that have their own UNIQUE motivations and goals in relation to that specific product. When a product goes up or down, this does NOT necessarily mean that it will always follow in line or go the opposite way to another product.
Trade safely and responsibly!
BluetonaFX

"Tag, You're It: Understanding Forex Correlations in Simple TermForex correlation is like a game of tag. You know how when you're playing tag with your friends, you all run in different directions and some of you end up running together while others run in opposite directions? Well, in forex trading, currency pairs are like friends running around in different directions.
Sometimes, two currency pairs move in the same direction, like when you and your friend are both running towards the same goal. This is called a positive correlation. Other times, two currency pairs move in opposite directions, like when you and your friend are running in opposite directions. This is called a negative correlation.
Just like how you can tag your friend to switch positions, forex traders can use correlations to help them trade better. If two currency pairs have a positive correlation, a trader might buy one currency pair and sell the other, hoping to make a profit when both pairs go up. If two currency pairs have a negative correlation, a trader might buy one and sell the other to manage their risk.
Remember, just like in tag, the way currency pairs move around can change depending on what's going on. So traders need to keep an eye on the news and be ready to change their strategies if needed.

CURRENCY CORRELATION HEAT MAPCurrency correlation is important to understand in forex trading because it could impact your trading results often without you even knowing it.
In this post, I will share some information about correlations in forex trading and how you are able to use it to your advantage to avoid unnecessary losses. Throughout my journey as a beginner trader, I have bought or sold 2 different currency pairs many times without knowing they are negatively correlated just to let the gains be offset by
the other pair.
My aim in this short post is to bring awareness about the positive and negative correlations between the currencies, specifically the most traded major pairs in the forex market.
What is correlation in forex trading?
A foreign exchange correlation is the connection between 2 different currency pairs. There is a positive correlation when 2 pairs move in the same direction, a negative correlation when they move in opposite direction, and no correlation if the pairs move with no relationship. In order to understand the relationship between 2 currencies, you must know the correlation coefficient and how it relates.
What is correlation coefficient?
A correlation coefficient represents how strong or weak a correlation is between 2 forex pairs. They are expressed in values and range from -100 to 100 or -1 to 1, with the decimal representing the coefficient. The higher the value of the correlation coefficient will largely reflect the movement of the other pair.
See Figure 1. Correlation Heat Map
For example, If the reading is -70 and above 70, it is considered to have strong correlation between the two. Readings anywhere between -70 to 70 means that the pairs are less correlated. With coefficients near the 0 mark, means little or no relationship with one or another. As traders, implementing risk management in our trading plan also reflects to correlations as you may think its a good ides to buy 2 highly correlated pairs thinking you will double your profits when in reality you may lose double the money as both trades could end up in a loss as you're doubling your risk.
Figure 2 . Positive Correlation: EURUSD / AUDUSD
As we can see on this line chart between EURUSD / AUDUSD, both pairs have a strong correlation coefficient as they are moving in almost the same direction. The correlation coefficient is valued at 75 as noted on the heat map. For example, if you place a buy order EURUSD and place a sell order on AUDUSD, expect a win and a loss in most cases.
Figure 3. Negative Correlation: EURGBP / GBPUSD
On this line chart, we can see that both of these parts are moving in opposite directions which are showing a negative correction between the two which in fact is also known as an inverted correction. The correlation coefficient is valued at -90 on the heat map which means if you place a buy order on EURGBP and a place a sell order on GBPUSD you may double your profits, but again you're doubling your risk.
Figure 4. No Correlation: GBPJPY / USDJPY
This line chart shows that both of these pairs move in the same direction with a correlation coefficient of -9 which has almost no correlation. If you place a buy order on GBPJPY and place a sell order on USDJPY, one of these trades will most likely end up in a loss. The pairs that have no correlation usually have different and separate economic conditions therefore coefficient values tend to be lower.
In summary, understanding which pairs are correlated with one another will be able to help build your strategy and improve your trading results. Every trading strategy NEEDS to have Risk Management implemented in it as it is the key to sustainability for the long run.
Trading is a marathon NOT a sprint.
To learn more about forex correlations and their relationships, please see the following links.
References:
www.tradingview.com
ca.investing.com
If you felt this information was helpful, and hit the LIKE button and FOLLOW me for more educational
posts and analysis.
Feel free to leave a comment if you have any questions!
I appreciate all the feedback.
Thanks
Trade Safe

The correlation between US Interest Rates and The US Dollar (DXYInterest rates and USD strength are positively correlated.
An increase in US interest rates will typically result in a strengthening of the USD.
The reason is...
Foreign investors tend to flock to US assets, such as bonds and fixed bank rates for higher returns.
Higher demand for US assets drives up their price, and as a result, the USD strengthens.
As for the relationship between USD strength and US stock market prices, it is more complex and can have both positive and negative effects.
On one hand, a strong USD can make US exports less competitive, reducing demand and potentially leading to a decrease in corporate profits.
This can weigh on stock prices. On the other hand, a strong USD can attract foreign investment into US stocks, driving up demand and prices.
There are other reasons for the correlation such as:
Interest rate differentials
When interest rates in one country are higher than in another, capital tends to flow to the country with the higher interest rates.
This results in an increase in demand for the currency of the country with higher interest rates, strengthening its currency i.e US Dollar.
Inflation expectations
Interest rates are also closely linked to inflation expectations.
When interest rates rise, it is generally expected that inflation will rise too, which makes the currency more attractive to investors.
Trade flows
The USD is the currency used in most international trade transactions, and as a result, changes in trade flows can have a significant impact on the value of the USD.

Correlation between FX and Equities! (Chicken or the Egg?)Which came first, the chicken or the egg?
Traders all over the globe are constantly looking for an edge, something that's going to give them an extra indication on market directional movements prior to them unfolding. I know from personal experiences and from chatting people at the firm that many traders lean towards finding correlation between the equities market and the FX market. There are a lot of analysts out there that say the equities market is what moves the FX market, and in return there are a lot of people that say the FX market is what moves the equities market.
So, which one is it?
Reality is will never know. There have been many of times where the FX market and shows clear indication of direction and then about a day later or a few hours later we have the equities follow suit. For example the RBA's recent decision to hike interest rates by .25% instead of 0.5% sent the Aussie dollar down, but when you move over to the AUS200 or look at General Equities in the ASX, you'll see that they had their biggest day in 2.5 years.
Then there are times, and this is more into day trading, where the indices in the equities movements tend to correlate well moving into the FX markets.
So there is evidence to support both sides. Not ideal.
It goes without saying that correlation between equities and FX is slowly starting to fade as volumes kick up since we are in the technologically advanced era. But, what is or was the correlation and how does it work?
The basic theory (aged) is that when equity markets rise, confidence in that specific country grows well, leading to an inflow of funds from foreign investors. Therefore, equities go up, FX value goes up. It's simple supply and demand when you look at it. If the equities are going up and you're a foreign investor and you want to buy into those equities, it creates demand for holding, let's say, the US dollar if I wanted to buy into the S&P 500.
On the flip side, when the equity markets are falling. Then confidence falters, causing investors to convert their invested funds back to their own currencies outside of that country.
This is a general theory and I don't recommend basing any of your trading decisions on this, because if you actually have a look at the charts and the correlation, you'll notice that recently it's not been too hot. While you do get a general directional bias, one tends to move before the other and they tend to be quite random in which one goes first. If you have the ability or the skill to be able to work out when something is correlating and when something isn't, then for sure I think you'll be able to find an edge in the market trading some kind of correlation between equities and FX.
One correlation I have seen to be quiet useful in recent times is the S&P 500 And the Nikkei. Although in the Asian session the Nikkei is open in the S&P 500 isn't. Usually you see the S&P move and the Nikkei follow suit. Keep an eye on that correlation and tell me if you find any patterns.
As a whole, trading correlations can give you an edge in the market. It can provide you with valuable information when it comes to trading, whether you are trading FX or trading Equities. But it's not as simple as it seems. It will take more diving and understanding the markets on a deeper level to know when their correlating and to know when to ignore.
I hope you guys have enjoyed this article. If so, please give us a like leave and a comment. It does help the post a fair bit and I'll see you next week for some more content. Happy Trading!
-Jordon Mellor

Correlation of Different Markets with Forex: CheatsheetOne of the biggest things you should understand as a trader is prices don’t just go up and down (well, maybe on a really small timeframe they’re more chaotic). They’re usually backed by some actions, data and things happening in other markets. This all creates general economic tendencies. But how do we know what affects dollar/currency pair and how? Well, here is a quick cheat sheet for that case. More importantly with an explanation of why. 😊
USD and Gold (negative)
Investors prefer to abandon the dollar in favor of gold during times of economic uncertainty. Gold, unlike other assets, retains its inherent worth.
Gold and NZD/USD (positive)
New Zealand (number 25) is a major gold producer.
Gold and AUD/USD (positive)
Australia is the world's third-largest gold producer, exporting around $5 billion worth of gold each year.
Gold and USD/CAD (negative)
Canada is the world's fifth-largest gold producer. When the price of gold rises, the pair tends to fall (CAD is bought).
Gold and USD/CHF (negative)
Gold backs up more than a quarter of Switzerland's reserves. As gold prices rise, the pair falls (CHF is bought).
Oil and USD/CAD (negative)
Canada is one of the world's top five oil producers. It exports 5..5 million barrels of oil per day to the United States. As oil prices rise, the pair falls.
Bond Yields and USD (positive)
Higher bond returns attract greater investment to a country's economy. This makes its native currency more appealing than the currency of another economy, resulting in lower bond yields. Here it’s more about looking out for bond differences between countries. For instance, if bond difference between UK and United States goes down, this will cause GBPUSD fall as well.
Gold and EURUSD (positive)
Because gold and the euro are both considered "anti-dollars," if gold prices rise, the EUR/USD may rise as well.
USD and Stock Market (depends on the market situation, mostly positive)
So, here is a little weird one. Strong stock market is an indicator of a strong economy. So as company gets stronger -> stock price goes up -> attracting more international investors to step in, who have to get local currency in order to buy a local stock -> this cases dump of other currency in favor of the currency we’re intending to buy the stocks with (in our case USD). Seems easy? On the other side, people from the local economy dump their dollar/bond holdings to acquire more stocks weaking the currency itself. That’s why it’s a complicated love story. This correlation is quite different depending on the volumes for both cases.
Enjoy, family! But keep in mind that these tendencies change to some extent as the world economy shifts/develops. Make sure to always stay updated and observe on your own.

CORRELATION COEFFICIENTS on FOREXHello everybody!
Professionals have been aware of correlation for a long time and use it profitably. The essence of correlation is not difficult to understand and using it in trading can significantly increase your profit.
Correlation coefficient of currency pairs – what is it?
Correlation is a statistical relationship between two or more random variables.
The correlation coefficient is an index of the interdependence of quotations of different currency pairs.
Correlation of currency pairs is divided into two types: direct (positive) and inverse (mirror or negative).
A positive correlation is a similar movement of quotations of different currency pairs.
Inverse correlation is the reverse movement of the exchange rate of different currency pairs.
For example , EUR/USD and USD/CHF are in a mirror correlation because both European currencies are against the dollar. Any change in the euro affects the franc exchange rate and vice versa, on the chart, the price of the euro and the pound moves the other way around because in the EUR/USD pair, the dollar is in second place, and in USD/CHF in the first.
Method
Analysts have come up with a method that makes it easier to understand the correlation, it is called the correlation coefficient. Using it, you can understand in which range each pair is relative to the other, where +1 is a complete correlation, and -1 is the opposite. The stronger the link between the economies, the stronger the value tends to unity.
Let's consider the main ranges of coefficient values and their impact on the currency pair:
• 1 - Denotes the same movement of currency pairs.
* From 0.9 to 0.5 – High dependence of currency pairs among themselves.
* From 0.5 to 0.1 – There is a decrease in correlation.
* 0 – There is no correlation, the instruments do not depend on each other.
* From 0.1 to -0.5 - Characterized by a decrease in correlation.
* From 0.5 to -0.9 – An increase in correlation and a change in the direction of movement of currency pairs in the opposite direction.
* -1 – Inverse dependence of currency pairs. One price is going down, the other is going up.
Trading options
Novice traders often think that they reduce risks when they invest in different currency pairs, but at the same time they do not understand that a large number of pairs correlate with each other. Forgetting about the correlation, you can start getting double losses.
Correlations can be used to confirm signals.
For example , the analysis of the EUR/USD chart showed growth. To make sure that the forecast is correct, you need to get a reverse confirmation for USD/CHF.
Sometimes, to confirm trading signals, a comparison of three assets that are minimally related to each other is used. Take for example EUR/USD, USD/JPY and EUR/JPY.
• If EUR/USD is predicted to go up, then the forecast for the reverse currency pair USD/JPY should signal a fall. In the event that there is no signal for USD/JPY, then it is necessary to carefully study the behavior of EUR/JPY.
No matter what tactics a trader uses, you always need to remember about correlation and use several pairs with positive and negative correlation in the analysis to increase the accuracy of the forecast.
In addition, correlation helps to hedge transactions. Having decided to invest in one currency pair, you can divide the investment amount into two parts and invest the second part in a currency pair with
Time interval in correlation analysis
The correlation has the ability to change depending on time. It may be that the daily correlation = 0.6, but when switching to a monthly interval, this value increases and shows a strong correlation.
There may be an inverse situation, when the correlation drops relative to the selected interval. Pay attention to this when analyzing.
Traders, if you liked this idea or if you have your own opinion about it, write in the comments. I will be glad 👩💻

How do you trade with Correlation?How do you trade with Correlation?
You can trade on forex pair correlations by identifying which currency pairs have a positive or negative correlation to each other. I have identified above the 3 main correlation pairs which correlate best with each other. In the conventional sense, you would open two of the same positions if the correlation was positive, or two opposing positions if the correlation was negative, for example when OIL increases in value, the Canadian Dollar tends to increase in value. This is because Canada is among the top 5 oil producing and exporting countries making them directly correlate.
CHF & GOLD Correlation
Both the Swiss Franc (CHF) and physical gold have acted as reserve 'currencies' thereby establishing a relationship between the gold price and Swiss Franc . Despite some differences, the Swiss Franc and the gold price are correlated and the similarities shared by the two can be clearly identified. This the Swiss National Bank has a huge amount of Gold Reserves and is one of the largest possessors of gold reserves worldwide. This also gives the Swiss Franc direct correlation with gold as the government passed a legislation that the Swiss Franc must be backed by gold .
Why is it important
Correlation is important when trading your strategy as you can manipulate the market and gain more confluences to confirm your entries. For example if you are focusing on the Canadian Dollar and can see a bullish trend and an entry point, OIL must also be bullish due to the correlation and you can confirm your analogy as you have analysed 2 correlating pairs which are both bullish .
