EURUSD and USDPLN correlationNice correlation between EURUSD and USDPLN
Trading ideas in the related links
Let me know what your thoughts are in the comment section
Like and follow me for more content
Good Luck
Correlation

volume : main force behind major market moves Volume is one piece of information that is often neglected, however, learning to interpret volume brings many advantages and could be of tremendous help when it comes to analyzing the markets. In addition to technicians, fundamental investors also take notice of the numbers of shares traded for a given security.
Volume analysis can help to confirm the existence, or a continuation, of a trend - If trading volume increases, prices generally move in the same direction - or trend reversal - If there is no relationship between the trading volume and the price of a security, this signals weakness in the current trend and a possible reversal.
Essentially, trading volume can legitimize a security's price action, which can then aid an investor in their decision to either buy or sell that security.
So let’s begin by having a closer look at what volume is and how it can help traders!
What is Volume?
The volume represents all the recorded trades for a security that occurs in a given time interval. It is a measurement of the participation, enthusiasm, and interest in a given security. Think of volume as the force that drives the market. Volume substantiates, energizes, and empowers price. When volume increases, it confirms price direction; when volume decreases, it contradicts price direction.
In theory, increases in volume generally precede significant price movements. However, If the price is rising in an uptrend but the volume is reducing or unchanged, it may show that there’s little interest in the security, and the price may reverse.
A high volume usually indicates more interest in the security and the presence of institutional traders. However, a rapidly rising price in an uptrend accompanied by a huge volume may be a sign of exhaustion.
Traders usually look for breaks of support and resistance to enter positions. When security break critical levels without volume, you should consider the breakout suspect and prime for a reversal off the highs/lows
Volume spikes are often the result of news-driven events. Volume spike will often lead to sharp reversals since the moves are unsustainable due to the imbalance of supply and demand
Important note: there’s no centralized exchange where trades are recorded, so the volume data represents what happens at a particular exchange only
In most charting platforms, the volume indicator, one of the oldest market indicator, is presented as color-coded bars, green if the security closes up and red if the security closed lower, where the height of the bars show the amount of the recorded trades. Additionally, there are many custom studies, available on trading platforms as it is the case for @TradingView, where the volume information is presented with added additional insight, such as adding volume moving average, presenting relative volume with four colored histogram
What Else?
Apart from the volume itself, your ability to assess what volume is telling you in conjunction with price action can be a key factor in your ability to turn a profit in the market. It makes little sense to analyze the volume alone. To correctly interpret the volume data, it shall be seen in the light of what the price is doing. there are a lot of other indicators that are based on the volume data as well as price action. Analyzing those volume indicators has always helped traders and investors to better understand what is happening in the market. Here are some of the commonly used volume indicators:
• On Balance Volume
• Money Flow Index
• Chaikin Money Flow
Shortly;
On Balance Volume
The On Balance Volume indicator, is a technical analysis indicator that relates volume flow to changes in a security’s price. It uses a cumulative total of positive and negative trading volume to predict the direction of price. The OBV is a volume-based momentum oscillator, so it is a leading indicator — it changes direction before the price
Granville, creator of OBV, proposed the theory that changes in volume precede price movements in a measurable way. He believed that volume was the main force behind major market moves and thought of OBV’s prediction of price changes as a compressed spring that expands rapidly when released.
It is believed that the OBV shows the interactions between the institutional and retail traders in the market
If the price makes a new high, the OBV should also make a new high. If the OBV makes a lower high when the price makes a higher high, there’s a classical bearish divergence — indicating that only the retail traders are buying. Another type of bearish divergence occurs when the price remains relatively quiet and fails to make a higher high but the OBV soars higher than the previous high — indicating that the institutional traders are accumulating short positions. On the other hand, if the price makes a lower low and the OBV makes a higher low, there is a classical bullish divergence, showing that the institutional traders don’t believe in that move
Money Flow Index
The Money Flow Index indicator (MFI) is a tool used in technical analysis for measuring buying and selling pressure. This is done through analyzing both price and volume. When the MFI rises, this indicates an increase in buying pressure. When it falls, this indicates an increase in selling pressure. The Money Flow Index can generate several signals, most notably: overbought and oversold conditions, divergences, and failure swings
The MFI is essentially the RSI with the added aspect of volume
Chaikin Money Flow
The Chaikin Money Flow indicator (CMF) is a volume indicator that measures the money flow volume over a chosen period. The money flow volume is a measure of the volume and where the price closed relative to the trading session’s range. It comes from the idea that buying pressure is indicated by a rising volume and recurrent closes in the upper part of the session’s price range while selling pressure is demonstrated by an increasing volume and repeated closes in the lower part of the price range.
Both buying and selling pressures are accompanied by an increase in volume, but the location of the closing prices are in accordance with the direction of price
There are many others, that you may be interested to check further
• Price-Volume Trend (PVT)
• Volume Price Confirmation Indicator (VPCI), Dormeier’s awarded study
• Ease of movement
• Accumulation/distribution, base for Chaikin Money Flow
• Volume-Weighted Average Price
• Volume-Weighted Price Bars, present if price movements are supported by Volume
• …
Additional example custom studies to the one presented with the idea
Conclusion
Volume analysis is very important to traders and investors. There are numerous volume indicators out there, but we have discussed some of the commonest ones. Study them and add them to your analysis tools to improve your trading.

$DXY / $USD ~ Consolidation before legging up ($BTC decreases)looking for consolidation before breaking Sept.9th resistance & heading to $0.94 $USD. Once this happens it will confirm a bull trap on $BTC & send us back under $10,000 $USD. $SPX is barely hanging above a major (s/r) transition zone. (3350) $USD

DXY short - Supply Demand - h4Hello Traders!
On DXY I see it still going to the downside. We are right now at a daily Supply Zone. This Zone is a potential returning point in the market. If we have a look at the other timeframes. The Trend is downtrend. We can see this on all timeframes. Right now DXY made a correction to the upside. This is why a lot think that it will go back to the upside. But this is simply a correctional move. If we want to see the DXY going more to the upside than we need to break first the resistance that I market on the chart. Let's see what will happen.
That was my Idea and I hope you liked it. Please leave a LIKE if you like the content. In the comment section you can share your view and ask questions.
Thank you and we will see next time
- Darius.


The Big Scoop! Gold v US DollarFollowing up from my previous video on price of Gold, I show an startling inverse correlation between Gold and strength of the US Dollar (DXY).
Before February 2020, Dollar strength basically followed Gold. But after February - the world changed. Keep in mind this was when COVID struck, and the FED flooded the economy with basically 'air money'.
COVID popped the baloon that was expanded recklessly for about 11 years. The FED then put 'sellotape' on the balloond and did a fair job of reinflating it, with more 'air' of course.
The effect of panic-striken money printing was to cause a loss of strength in the US Dollar against other currencies. Other factors like trade and price of Oil also account for Dollar strength in part.
So post-COVID,around April to end of May 2020, the Dollar took on a decompensation pattern and crashed. It could get even worse, as today the FED re-affirmed it's commitment to doing 'whatever it takes'.
This is probably not good news for the Dollar, but it's good news for those seeking upside on Gold.
Disclaimers : This is not advice or encouragement to trade securities. No predictions and no guarantees supplied or implied. Heavy losses can be expected. Any previous advantageous performance shown in other scenarios, is not indicative of future performance. If you make decisions based on opinion expressed here or on my profile and you lose your money, or miss opportunity, kindly sue yourself.


EBAY VS AMZNA very simple and clear chart above, from which you can see a 89% correlation between NASDAQ:EBAY and NASDAQ:AMZN .
The built-in CC is used over a month period to look at possible correlation between the two, and well just as I expected. The future is online shopping.
Do with this info as you see fit, and hit like if you found this interesting !
Best Regards, Ev

BTC ETH CORRELATIONJust confirming my thoughts that ETH follows BTC like a puppy...
So if the bears are back in town for BTC, ETH is sure to follow.
Hit a like if you found this useful !
Thanks, Ev

🔔🔞 How Bitcoin Can Get You Your Heart's Desire 💖 BTC ETH LINKIntroduction:
💬 The weak dollar, DeFi hype, and tech boom during COVID have been great for crypto. This can be seen by looking at Bitcoin (BTC), Ethereum (ETH), and Chainlink (LINK). This doesn't mean we won't see a correction after the current consolidation period (something we are already seeing a bit with LINK), it just means overall things have been up-and-up and are still looking good. The more crypto booms, the more ground BTC, ETH, and Chainlink take. The more ground they take, the more crypto booms. That said, history and logic tell us we have to see a pullback at some point, let's take a look at these three leaders of crypto to get a sense of the current overall market conditions.
Hit that 👍 button to show support for the content!
Help the community grow by giving us a follow 🐣
-----
BTCUSD 4h:
BTC Support:
S1: The orderblock and previous S/R range at the bottom of the channel is likely to be the saving grace of crypto. Or at least this is the bull's best hope. As you'll see, the other cryptos will benefit from a show of strength here.
BTC Resistance:
R1: This range at the previous swing high which contains an orderblock is the first point of resistance for BTC. The bulls don't need to take this out right away, but a push above this range would be a great show of strength.
R2: The orderblock range at the top of the channel is the last hope for bears who want to ensure there is no chance of a retest of previous All-Time Highs. Meanwhile, a clean break of this level would signal it is game on for the bulls.
ETHUSDT 4h:
ETH Support:
S1: The support range at the previous S/R flip is a logical level for ETH to consolidate and run from. ETH has already tested this level twice, so technically it could just be up from here, although it would be far from uncommon to see another retest as we consolidate.
S2: The range at the S2 orderblock, where the bodies of the range low candles sit, makes sense as support if S1 can't hold. Below this ETH loses some bullish market structure. It sets ETH back a bit if we linger below S2, although after such an epic run any level of correction wouldn't be out of the norm.
ETH Resistance:
R1: The range at the previous swing high and orderblock is our first level of resistance. This level is bound to be reacted to as long as we consolidate.
R2: There is some resistance above, but for our purposes, this range is what the bears will need to defend and bulls will be looking to take out. A break above this level is very bullish for ETH.
LINKUSDT 4h:
LINK Support:
S1: The level created from the previous support found on the way up is a logical place to bounce from. However, after losing this much market structure it is doubtful the bulls will be able to quickly pull out of the tailspin.
S2: The S/R flip range here is a reasonable support level for LINK. There is a chance price goes lower once we get here, but on the plus side for bulls there is lots of support to start looking at starting at S2.
LINK Resistance:
R1: The most immediate threat to bull kind and the great hope of Zeus capital is the range at the R1 orderblock. A rejection here is key to the bearish ABC that takes us to S2 as shown on the chart.
R2: If the bulls can manage the retest the top, it'll be the bear's last chance at keeping LINK away from mind-melting highs. Retesting this could however be a long time out if bulls don't act quickly.
-----
Summary:
All eyes are likely on BTC to hold the channel. BTC holding will help ETH and Chainlink hold their support levels. Meanwhile, BTC pushing above the channel and R2 should help the other cryptos launch. Given the DeFi boom, it is also possible ETH or even LINK steps in to pull the rest of crypto along for the next leg of a bull run, but our money is on BTC holding up the market here.
With all of that said, bears will be ready to feast if the supports noted above start to fail... even if that feast is more temporary than we have seen over the past few years (as it tends to be in true crypto bull markets).
Resources:
www.coindesk.com
✨ Drop a comment letting us know what you think! ✨

DE CAT CorrelationCAT has begun to regroup as far as correlation goes and could be another option opportunity tomorrow. Keep an eye on both option flows!

ENPH or SEDG or TAN - Lockstep CorrelationSolar Edge stays on my buy list, but Enphase keeps a direct correlation to SEDG with similar P/E ratios, but at the quarter of the cost. Further correlation with the TAN of course, but if you want to track the two inverter companies, you can do so with TAN and at least get dividends :)

ETHERIUM & BITCOIN CORRELATION (retest then leg up)Good evening everyone.
Hit that like button for me (if you appreciate the visuals I've created here for you guys) 👍👍👍👍👍👍
I've been noticing correlation between ETH & BTC (it looks like Ethereum could actually be leading Bitcoin. When ETH topped out, so did BTC, and they both dropped and recovered around the same area's. (where the supply zones are at, after dropping from the demand area)
PRO TIP: It's okay to change the short term plan, but never change the short term GOAL. (and long term)
Enjoy your night.
Comment below if you want me to post more ALT coin charts? like ETH and others? I appreciate the feedback! 👍👍👍👍👍👍

EURUSD Cup and Handle,Correlation USDJPYHi again, hit that like/follow button to motivate me.
As we can see EURUSD is in a retracement phase(handle) confirmed downtrend.
Testing support and resistance. Respecting Fibonacci golden retracement levels at 50/61%.
By using confluence and pair correlation strategies, please refer to my linked USDJPY Idea to understand fully the resemblance here.
This is why it is important to compare and contrast pairs. In this case EURUSD and USDJPY will move similarly while USDCHF is expected to contrast them.

USDJPY Cup&Handle updateOANDA:USDJPY
Hit the like/follow button to show support my friends. This is just am update, please read the full analysis.
If you’re following along check my full analysis I’ll link it to this one, the handle is respecting the downtrend as you see it hit the 38% of the Fibonacci retracement level.
Lets see if this will aim for resistance or will give a deeper pullback.
List of my confirmations:
Price correlation is being respected: Nikkei; EURUSD; and USDCHF.
Confluence zones along: SMAs; Trendlines; Fibonacci; Pivot Standards; Candlesticks; Support and Resistance.

EURAUD Lagging correlation with EURNZDEURAUD seems to be positively correlated with EURNZD but lagging behind. EURAUD has printed a bullish flag on the 4hour time frame. look for buy entries
Price Correlation MapIf you're following along you will see that I have continued my Correlation research, hit the follow and like button to show support
Following the topic of Correlation here is a visual of what is going on lately, this along a few Forex pairs is a great way to compare and contrast the full list of correlation.
Also US Oil and DXY I didn't add those on this chart because it was not flowing with the image I wanted to show, those are good to make on a separate chart with less noise.

Potential USDCAD Setup Here is my idea for possible USDCAD short to restest the strong 4hr resistance zone. Potential entry w/ SL and TP are on the chart.
*This is subject to change*
Daily VIEW:
FOREXCOM:USDCAD

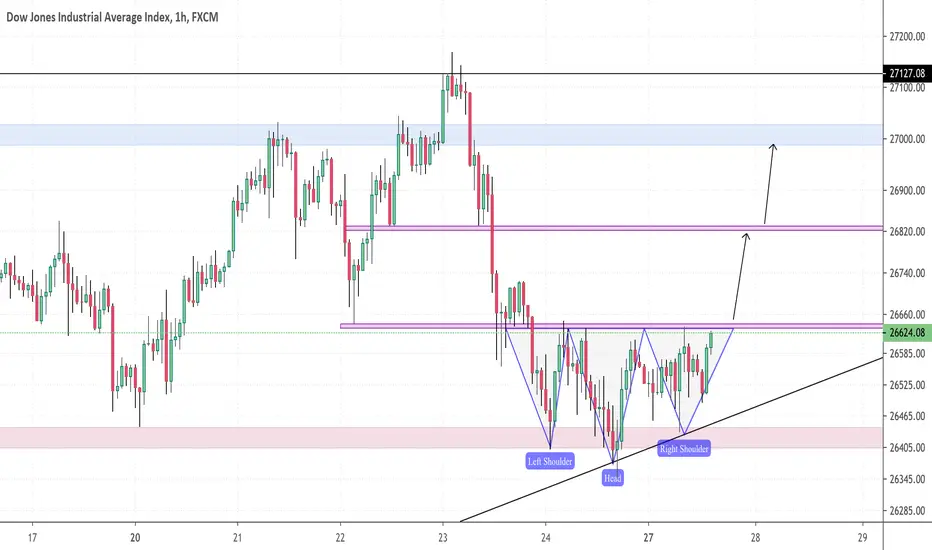
US30 H1Inverse head on shoulders formation, as price has rejected off support along with the ascending trendline. Will be looking for a break of the neckline for a continuation higher.
SUPPLY AND DEMANDpositive correlation between GbpJpy and EurJpy. check my previous idea for EURJPY analysis. Would be expecting the completion of a head and shoulder pattern on the 4hour time frame and a likely M formation on the 15mins Tf . you can place a sell limit when market opens but i will wait for the formation of reversal candlesticks. 339 pips down. SHARE YOUR THOUGHTS IN COMMENT SECTION. Enjoy!

US dollar - US Treasuries Divergence The US dollar correlates positively to US Treasuries.
Market participants needs US dollar when buying US Treasuries as investments or as collateral.
Now we see a pretty sharp diverence and break of that correlation.
One would anticiapte a return to mean of this relationship.
My base-case is that the dollar will follow bonds and get bid up.
In short, my reasoning is as follows:
If liquidity continues to be tight, as low interest rates and central banks going crazy are signaling, the dollar will catch a bid as it's still the world reserve currency.
Regardless of my bias: when macro correlations diverge, its time to pay attention.

Is Bitcoin Dominance Following the Dollar Index?The U.S. dollar has been sliding, with at least three major catalysts now weighing on the greenback:
1-Better economic numbers overseas, especially Chinese GDP last week
2-No QE boost from the European Central Bank last week, or the People’s Bank of China this week
3-A key stimulus deal by EU leaders this week
Meanwhile back in the U.S., politicians are pointing fingers and central bankers are considering more stimulus. This keeps DXY in focus into the next Fed meeting on July 29. Will the dollar break its March low of 94.65? This could be a big story to watch, especially now that buyers are piling into precious metals. Yesterday the iShares Silver ETF traded over 2 million options contracts, the most in nine years. It also had its biggest one-day gain (+9%) since late 2008.
This is classic risk-on behavior associated with a weak dollar.
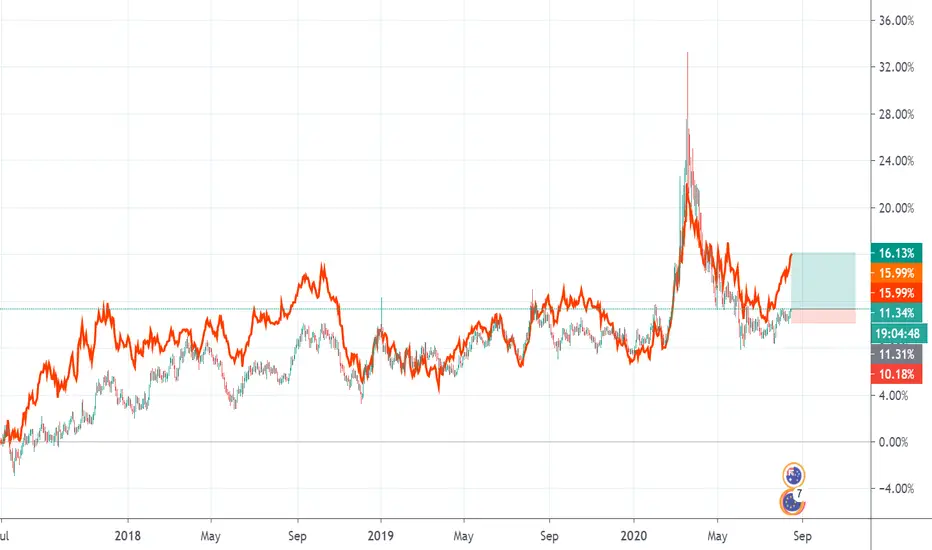
Interestingly, Bitcoin Dominance seems to be following a similar trajectory as the Dollar Index. Both are seen as “safe havens” that do well in times of volatility but slide when risk appetite increases. Last week, correlation between the two charts was the highest in 4+ years.
Notice on the chart how BTC.D had slid under 64 and failed to rebound. This resembles other consolidation phases like January 2020, April 2017 and April-June 2016. In each case, Bitcoin was gaining, but higher-velocity altcoins rose even quicker.
This decline of Bitcoin dominance comes as decentralized finance keeps spreading (up more than 100% in the last month according to DeFi Pulse). Crypto enthusiasts may want to keep an eye on this relationship – especially if the trend of dollar weakness continues. It’s potentially bullish for altcoins like Ethereum .

Bitcoin - Decoupled from SPXIt seems BTC finally decoupled from SPX, but, sadly, SPX broke resistance and went higher and BTC just stands motionless in the almost same place.
Hit the "LIKE" button and follow to support, thank you,
Information is just for educational purposes, never financial advice. Always do your own research.
