PUT CREDIT SPREAD on RUT📈 Thesis: Bullish Momentum Strategy on RUT Using Neural RSI and ADX Pro
This strategy identifies long trade opportunities on the Russell 2000 (RUT) using two core indicators:
Simple Neural Network RSI: When this indicator is green, it signals bullish momentum. Green means go—whether it’s a breakout, reversal, or continuation.
ADX Pro: When rising, it confirms that the directional move is gaining strength.
🎯 Trade Setup
A long trade is initiated when:
The Neural RSI is green, indicating bullish momentum.
ADX Pro is rising, confirming trend strength.
📊 Metrics (Simple Compounding Model)
Trade Duration: 2 days
Spread Width: $5
Net Credit: $47
Capital at Risk: $500
ROI per Trade: 9.4%
One of the most consistent ways to generate income in options trading is by selling premium in high-probability environments. That means structuring trades where the odds are tilted in your favor—not by prediction, but by placement.
When you position short strikes outside the expected move, you're essentially betting that price will stay within its statistically forecasted range. It’s not about being right—it’s about being on the right side of probability.
Pair that with short durations—like 2-day trades—and you’re working with accelerated time decay. A 9% return in that window might seem small, but when repeated with discipline, it adds up quickly. The key is keeping risk defined, staying mechanical, and letting the math do the heavy lifting.
Premium collection isn’t flashy. It’s methodical. And when done right, it becomes a reliable engine for compounding gains while keeping exposure tight.
Credit

Options Blueprint Series [Basic]: Gold Income or Bargain Entry?The Setup: A Pullback with a Plan
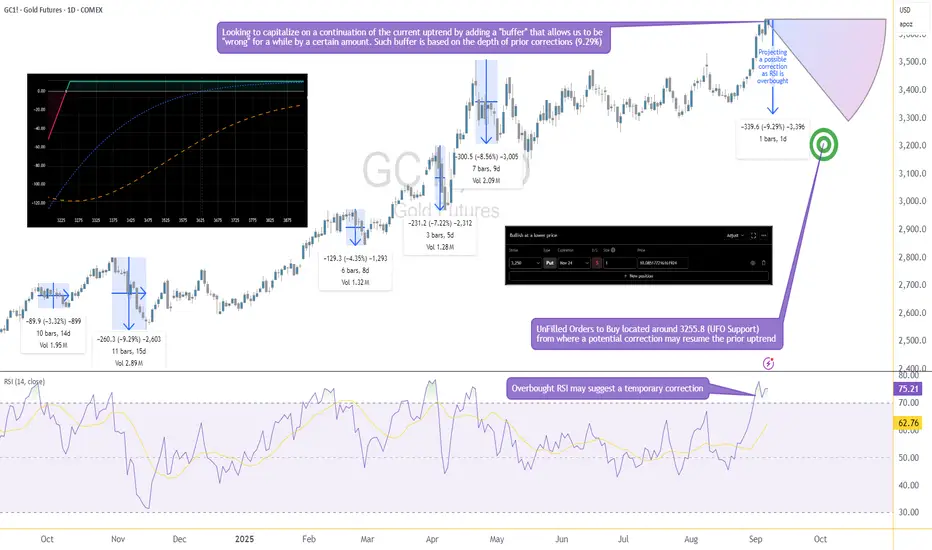
Gold has been riding a strong bullish wave, yet momentum indicators suggest it's time for a breather. RSI is now overbought, and if history repeats, we could see a healthy correction of up to 9.29%, in line with prior pullbacks. This projects price near 3255, where we also find a cluster of UnFilled Orders (UFOs) acting as a potentially relevant support. It’s a key price area where buyers may step in again.
Rather than try to perfectly time the correction or the bottom, we’re applying a more forgiving approach: selling a PUT far below current price—generating income while leaving room to be wrong by over 375 points.
This is not a hedge. This is a standalone income strategy that accepts risk but frames it intelligently using technical context and options structure.
The Strategy: Selling the 3250 PUT on GC
We're using a simple but powerful strategy—selling a naked PUT—which can generate income or result in ownership of Gold at a deep discount if price dips.
Underlying Asset: GCZ2025 – using Gold Futures Options (Nov 24 2025 Expiration)
Strategy: Sell 1x 3250 PUT
Premium Collected: 10.09 points ≈ $1,009
Breakeven Price: 3240
Max Profit: $1,009 (if Gold stays above 3250 until expiration)
Max Risk: Unlimited below breakeven
There are two possible outcomes here:
Gold stays above 3250 → we keep the full premium.
Gold drops below 3250 → we get assigned and become long GC at 3250. From there, we’re exposed to downside risk in Gold, with a breakeven at 3240.
The position benefits from time decay and stable to rising prices, but it does carry the full downside exposure of long Gold futures if the trade moves against us.
We want to be very clear here—this is a naked trade with undefined risk. That doesn’t make it reckless if done with sizing discipline and technical alignment, but it’s not a beginner-friendly strategy.
Gold Contract Specs
Understanding the size and risk of what you're trading is critical—especially with naked options.
✅ GC – Gold Futures (Full Size)
Symbol: GC
Contract Size: 100 troy ounces
Tick Size: 0.10 = $10
Point Value: 1 point = $100
Initial Margin (as of Sep 2025): ~$15,000 per contract (subject to change)
Underlying for the Option: GC Futures
✅ MGC – Micro Gold Futures
Symbol: MGC
Contract Size: 10 troy ounces
Tick Size: 0.10 = $1
Point Value: 1 point = $10
Initial Margin: ~$1,500 per contract (subject to change)
Why does this matter?
Because if GC collapses below 3250 and you're assigned long, you’ll be exposed to full-size futures. That’s $100 per point of movement. A 50-point drop? That's $5,000 in unrealized loss.
That’s where MGC becomes your best ally. Micro Gold futures offer a scalable way to hedge. If price begins moving down or breaks below the support zone, one could short MGC against the Short GC 3250 PUT to cap further losses or rebalance directional exposure with reduced size and margin impact.
The Technical Confluence: Where Structure Meets Strategy
The 3250 strike isn’t just a random number—it’s calculated. Historical RSI-based corrections in Gold have shown recent worse-case scenarios around 9.29%, and projecting that from recent highs lands us precisely near the 3255 zone. This level also aligns with a clear UFO support, where institutional buyers have likely left behind unfilled orders.
That confluence—statistical retracement, technical indicator, and order flow support—gives the 3250 strike an interesting probability structure. Selling a Put beneath it means we are placing our bet below the “floor” and getting paid while we wait.
If Gold never corrects that far, we profit.
If it does, we might get long near a historically meaningful level.
There’s no need to catch the top. There’s no need to nail the bottom.
Just structure the trade where the odds are already potentially skewed in your favor.
Trade Plan: Reward, Risk & Realism
This trade isn’t about precision entry or leveraged glory—it’s about risk-defined logic with a cash-flow twist. Here's the full breakdown:
🧠 Trade Parameters
Strategy: Sell 1x Gold Futures 3250 PUT Options
Premium Collected: 10.09 points = $1,009
Point Value (GC): $100/point
Breakeven Price: 3240 (3250 – 10)
Expiration: Nov 24, 2025
🟩 If Gold Stays Above 3250
You keep the full premium → $1,009 profit
🟥 If Gold Falls Below 3250
You may be assigned 1 GC contra<ct long at 3250
Unrealized losses begin below breakeven (3240)
Losses can be significant if Gold falls aggressively
⚠️ Reward-to-Risk?
Reward is capped at $1,009
Risk is unlimited below breakeven
The trade only makes sense if you're prepared to own Gold, or hedge dynamically via MGC or using any other technique
This isn’t a “set-and-forget” income play—it’s a calculated entry into a structured exposure with a fallback plan.
Risk Management: No Margin for Error
Selling naked options isn’t “free money.” It’s responsibility wrapped in premium. Here's what must be considered:
❗ Undefined Risk
When you sell a naked PUT, you're exposed to the full downside. If Gold drops $100 below your strike, that’s a $10,000 loss. Don’t sell naked options unless you’re ready—and capitalized—to buy the underlying or actively hedge it.
🔄 Use MGC to Hedge
If Gold breaks below 3250, using Micro Gold Futures (MGC) offers a surgical way to hedge risk without overleveraging. A simple short MGC can offset GC losses proportionally, depending on how aggressive the move becomes.
🧮 Precision Matters
Avoid entering trades too early or too large.
Place an “invalidation” point: if price violates the support zone with conviction, reduce or hedge exposure.
Never sell premium just because it’s “high”—sell where structure backs the trade.
📊 Discipline Trumps Direction
This strategy is valid only if risk is respected. The market doesn’t owe anyone consistency—but a structured, risk-controlled approach keeps you in the game long enough to see it.
When charting futures, the data provided could be delayed. Traders working with the ticker symbols discussed in this idea may prefer to use CME Group real-time data plan on TradingView: www.tradingview.com - This consideration is particularly important for shorter-term traders, whereas it may be less critical for those focused on longer-term trading strategies.
General Disclaimer:
The trade ideas presented herein are solely for illustrative purposes forming a part of a case study intended to demonstrate key principles in risk management within the context of the specific market scenarios discussed. These ideas are not to be interpreted as investment recommendations or financial advice. They do not endorse or promote any specific trading strategies, financial products, or services. The information provided is based on data believed to be reliable; however, its accuracy or completeness cannot be guaranteed. Trading in financial markets involves risks, including the potential loss of principal. Each individual should conduct their own research and consult with professional financial advisors before making any investment decisions. The author or publisher of this content bears no responsibility for any actions taken based on the information provided or for any resultant financial or other losses.
[b]No Panic Here – Quality Credit Says Relax[/b]No Panic Here – Quality Credit Says Relax
After watching leveraged loans ( AMEX:BKLN ) and junk bonds ( AMEX:HYG ) take heavy hits, we shift to the quiet giant in the credit space: AMEX:LQD .
What is AMEX:LQD ?
It’s the ETF for investment-grade corporate bonds — meaning bonds issued by highly rated, stable companies.
We’re talking about names like Apple, Johnson & Johnson, Microsoft, JPMorgan, ExxonMobil — the blue-chip elite.
These aren’t the bonds you dump in a panic — they’re the ones you rotate into when credit stress builds.
What’s happening now?
📌 Price just bounced off 103.81 , a key support zone that also held:
• During the 2020 Covid crash
• In the 2022 banking mini-crisis
• Now in 2025 – mid macro uncertainty
From 2003 to 2021, this chart trended upward with pressure on resistance. Since 2022, the pressure flipped — testing support. But structure is still being respected perfectly .
🟢 The ascending channel remains intact
🧱 Support at 103.81 is holding
🔄 No breakdown, no fear — just rotation
Zoomed-in 30m chart shows a clean technical bounce .
If we revisit 100.33, that could be a final test of the base — but unless that breaks, this still looks bullish on a macro timeline.
What it means:
This is not a market panic .
It’s a rotation into quality.
• Junk bonds = sold but found support
• Leveraged loans = stress but not panic, on support
• Investment grade = stable
• ** CRYPTOCAP:BTC 🟧 = crypto wildcard in this macro unwind**
Bottom Line:
LQD is holding up, following the rules, and quietly saying:
"Relax, we've been here before."
One Love,
The FXPROFESSOR 💙

Credit Stress Panic? No, at least not yet!Credit Stress Panic? No, at least not yet!
A friend shared a viral X post claiming we just saw the biggest exodus in the leveraged loan space — and they’re right on the numbers:
• $6.5 billion pulled from US leveraged-loan funds in just a week
• $1.4 billion from AMEX:BKLN alone — the largest outflow in its 13-year history
• $9.6 billion also left high-yield bond funds — the most in nearly two decades
But here’s the thing... dollar flows can be misleading without context.
What is AMEX:BKLN ?
AMEX:BKLN is the Invesco Senior Loan ETF. It tracks floating-rate loans made to riskier corporations — offering higher yields tied to interest rates. These are popular in rising-rate environments… until credit stress kicks in.
So what’s the chart saying?
Despite the outflows, price just bounced off a key historical support level: $20.31 .
This zone has been tested before:
• 2018: Fed tightening – sharp but contained
• 2020: Covid crash – full panic
• 2022: Banking mini-crisis – 💥 and Bitcoin pumped from here 💰🟧…
Now in 2025, we’re seeing the biggest dollar outflow… but not the worst price action.
Perspective check:
The fund is much larger now. $1.4B today ≠ $1.4B in 2018. This move isn’t the apocalypse — not yet.
Final Takeaway:
If $20.31 holds, this may be just another macro shakeout.
Break that, and we enter “panic mode” — but we’re not there yet. (Thank God that Tradingview alerts exist. It's ON)
Watchlist:
• AMEX:BKLN – key support zone
• AMEX:HYG / AMEX:JNK – junk bonds under pressure
• NASDAQ:TLT – treasuries getting love
• CRYPTOCAP:BTC – does it act as safe haven again?
One Love,
The FXPROFESSOR 💙

Revolving Credit Recession?YES! We are!
Revolving credit does not roll over like this unless people are scared! The question is are we already in a recession? We won't know until after the fact. But my guess would be YES!
My question is will we end up in a depression or not?
Click Boost, Follow, Subscribe, and let me help you navigate these crazy markets.

MULTIBAGGER Series - Stock 3Hello everyone!
I am back with 3rd company of the multibagger series.
The company is Zaggle Prepaid Ocean Services Ltd. Zaggle builds world-class financial solutions and products to manage the business expenses of corporates, SMEs, & Startups through automated and innovative workflows. It is at an intersection of SaaS (Software as a service) and Fintech. It has made strategic alliances with many other companies. The company has an esteemed list of corporates like Tata Capital, Inox, NSDL, DBMS, Wockhardt, Yes Bank, Greenply, etc. It has also made an agreement with VISA and the deal is valued at approximately $20 million over the next five year.
The company has shown more than 10x growth in both sales and profit made in the past 4 years. Last year sales was 776 cr and profit was 44 cr. The quarterly sales and profit is also continuously increasing and the company is expected to grow at a good pace from here. They have made visionary targets for the year 2025. Ace investor Ashish Kacholia has also invested in this company.
Investing in such companies will make our portfolio diverse and as they are smallcap company, chance of giving multibagger returns are more from such companies.
Investing in such companies bring a high risk factor so please do your own analysis before investing.
Hope you learned something new from this post.
Do like, share and follow me. Thank you!

Visa (V): Chart Analysis Update We hope you remember our previous analysis on Visa. The price reacted to our target area and has since increased following the latest drop. We now believe that Wave ((iv)) is complete and that we are currently in Wave ((v)). A level around $305 or even slightly higher should be possible for Visa before breaking the current local low at $253.
Once this Wave ((v)) is complete, concluding the overarching Wave 3, we plan to send out a limit for new entries.

AXP, THE PLATINUM CARD ISN'T ACTUALLY PLATINUMTrends and price targets marked.
Things are overextended
Potential to bounce back and catch more upside even with the overextension.
Guideline is more for backtracking, but it could potentially look something like this.
Follow trends and price targets rather than guideline, it is more to get an idea of what things could look like.
247 or so looks like a top to me especially with the trend formation
I would suggest watching a break on the lowest green support trend
and I would also suggest watching a rejection on the rejection trend.
Should we break out of rejection trend, probably 360.
Drop will be steep, but the most natural path would be the 247 drop to 80.
I would say, if you're looking to enter, wait and be patient. If there is more upside, you're not missing much. If downside is coming, there are still trend support lines that can see bounces in price, meaning, you'll likely be able to find a better entry that allows for less risk.

JPM, SOME UPSIDE AND A WHOLE LOTTA DOWNSIDEJPM might have a bad week?
Maybe bad Feb?
idk yet, however, from technicals, it seems like after 181 or so, and especially after $210, there isn't much upside showing.
Likely meaning, the risk far outweighs the reward at those levels.
IT could be big, and it could be fairly quick.
if you're shorting, yeah, these are great times to consider entering.
The downside shows all the way to $69 (nice)
Does that mean enter short right now this minute? nah
but be ready because things could really drop quickly in the coming month or so.
idk maybe this?

SLOOS Banking Lending Conditions- Released Monday 5th Feb 2024 Please review my prior post for a more detailed breakdown
Released quarterly, the Senior Loan Officer Opinion Survey on Bank Lending Practices (SLOOS) is a survey of up to 80 large domestic banks and 24 branches of international banks to gain insight into credit, lending and bank practices. The Federal Reserve issues and collates the voluntary surveys.
The surveys generally include 25 questions and a number of special questions about development in banking practices. They cover practices for the previous three months, but also deal with expectations for the coming quarter and year. While some queries are quantitative, most are qualitative.
The surveys have come to cover increasingly timely topics, for example, providing the Fed with insight into bank forbearance policies and trends in response to the 2020 economic crisis.
Let’s have a look at the culmination of the some of the more important data in chart form
The Chart
The blue line on the chart plots the results of the SLOOS survey – specifically, the net percentage of polled banks reporting that they’ve tightened their lending standards to commercial and industrial customers.
The other lines are specified on the chart and are self explanatory .
PUKA

MACRO MONDAY 32~The SLOOS~ Is Lending Increasing or decreasing?MACRO MONDAY 32 – The SLOOS
Released Monday 5th Feb 2024 (for Q4 2023)
Released quarterly, the Senior Loan Officer Opinion Survey on Bank Lending Practices (SLOOS) is a survey of up to 80 large domestic banks and 24 branches of international banks to gain insight into credit, lending standards and bank practices. The Federal Reserve issues and collates these voluntary surveys.
The surveys generally include 25 questions and a number of special questions about development in banking practices. They cover practices for the previous three months, but also deal with expectations for the coming quarter and year. While some queries are quantitative, most are qualitative.
The surveys have come to cover increasingly timely topics, for example, providing the Fed with insight into bank forbearance policies and trends in response to the 2020 economic crisis.
Let’s have a look at the culmination of the some of the more important data from the SLOOS in chart form
The Chart
The blue line on the chart plots the results of the SLOOS survey – specifically, the net percentage of polled banks reporting that they’ve tightened their lending standards to commercial and industrial customers.
I have combined the SLOOS Tightening Lending Standards on the chart with the Unemployment Rate. You can clearly see a pattern of the SLOOS leading the Unemployment Rate and also the broad correlation of their trends. Recessions are in grey.
The SLOOS Tightening Lending Standards
(blue line)
▫️ Lending standards tightened significantly prior to the onset of each of the last three recessions (See green lines and text on chart).
▫️ When lending conditions tightened by 54% or greater it coincided with the last four recessions. (Represented by the horizontal red dashed line on the chart and the red area at the top)
▫️ On two occasions the 54% level being breached would have been a pre-recession warning; prior to the 1990 recession and 2000 recession providing approx. 3 months advance warning.
▫️ When we breached the c.34% level in Jan 2008 it marked the beginning of that recession. We are currently at 33.9% (for Q3 2023) and were as high as 50% in the reading released in July (for Q2 2023). Above the 34% on the chart is the orange area, an area of increased recession risk but not guaranteed recession.
▫️ Interestingly, every recession ended close to when we exited back out below the 34% level. This makes the 34% level an incredibly useful level to watch for tomorrows release. If we break below the 34% level it would be a very good sign. We could speculate that it could be a sign of a soft landing being more probable and could suggest a soft recessionary period has already come and gone (based solely on this chart continuing on a downward trajectory under 34%). I emphasize “speculate”.
U.S. Unemployment Rate (Red Line)
▫️ I have included the U.S. Unemployment Rate in red as in the last three recessions you can see that the unemployment rate took a sudden turn up, just before recession. This is a real trigger warning for recession on the chart. Whilst we have had an uptick in recent months, it has not been to the same degree as these prior warning signals. These prior stark increases were an increases of approx. 0.8% over two to three quarters. Our current increase is not even half of this (3.4% to 3.7% from Jan 2023 to present, a 0.3% increase over 1 year). If we rise up to 4.2% or higher we can start getting a little concerned.
▫️ The Unemployment Rate either based or rose above 4.3% prior to the last three recessions onset. This is another important level to watch in conjunction with the 34% and 54% levels on the SLOOS. All these levels increase or decrease the probability of recession and should infer a more or less risk reductive strategy for markets.
In the above we covered the Net percentage of Banks Tightening Standards for Commercial and Industrial Loans to Large and mid-sized firms. The SLOOS provides a similar chart dataset for Tightening Standards for Small Firms, and another similar dataset for Consumer Loans and Credit Cards. I will share a chart in the comments that illustrates all three so that tomorrow we can update you with the new data released for all of them. You are now also better equipped to make your own judgement call based on the history and levels represented in the above chart, all of which is only a guide.
Remember all these charts are available on TradingView and you can press play and update yourself as to where we are in terms of zones or levels breached on the charts.
Thanks for coming along again
PUKA

US Government Bonds 2 YR Yield 📌💵💰Daily chart.
Resistance zone.
It remains to be seen the position of the FED, whether or not to lower the rate?
Make up your mind.

Credifi winding up for a higher perchCREDI 2hr higher bottoms are raging price towards resistance again and with a push on higher volume could breakout one of these next attempts On the breakout with little resistance ahead price could land around 0.011 to 0.013 for the next stop on CREDI recovery path

XAUUSD expected Bullish move next weekThe recent credit ratings downgrade on the USA and continuing geopolitical tension in the Middle East are factors that could potentially contribute to a bullish trend for gold in the coming week. Both of these events have historical correlations with an increase in demand for gold as a safe-haven asset.

The Bond Market is Pricing in a Collapse of The Yen Carry TradeThe spread between the US10Y and JP10Y has historically been a great leading indicator of contraction within the Yen Carry Trade and likely will be into the future.
If we were to apply TA to it, we can see that the spread appears to be Double Topping and has formed a Bearish Shark at this top as the RSI breaks down and the MACD Diverges. If we are to take this as a warning, then we should expect this spread to go down significantly, and that would be accompanied by the contraction of the Carry Trade, leading to lower liquidity and signfiicantly tighter credit conditions and ultimately a depreciation in market pricing.
I think we could see JPY and USD strength during this time but would avoid other currencies.

MTG: Confirmed Monthly Dark Cloud Cover at PCZ of Bearish ABCDA Dark Cloud Cover will be confirmed on the Monthly in about half an hour at the PCZ of a Bearish ABCD Pattern with MACD Bearish Divergence.

USD vs Foreign Currency Sets Up Black Swan/Credit Event 2028-29USD vs Foreign Currency Sets Up Black Swan/Credit Event – Pay Attention
This video will show why the US stock market continues to rally and the US Dollar continues to strengthen. It is all related to what is happening in China/Asia and much of the world.
The cheap US interest rates over the past 4+ years have allowed foreign borrowers to take advantage of localized demand for capital and the “Dollar Carry Trade.” When you can borrow USD for 2.5%, convert the USD capital into localized currencies, and use that capital to earn 20% or more – it’s easy to borrow as much as you can to make the extra 18% - right?
As long as there is no disruption in currency valuation levels and/or economic activities, it seems like a simple process for profits.
But when localized currencies collapse against the US Dollar, this sets up a very dangerous waterfall event. Now, the profitable USD carry trade is upside down from the start. It takes 25~35% more localized currency to repay the USD debt.
Additionally, consider that the performance of these borrowed funds may also be upside down related to profits. If the localized economy collapses and consumers are not buying, now you have additional downside pressure related to economic performance.
This is why the rush into USD-based assets and equities continues. The rally we see in the US indexes/stocks is almost “in the face” of the US Fed raising interest rates while trying to weaken inflation. It is almost as if the US Fed has acted in a predatory manner by raising interest rates – yet failed to understand the dynamics of the global markets.
The result will be a Black Swan type of credit event. Buckle up and prepare for it.
Follow my research and prepare for the biggest opportunity of your lifetime.

Higher for LongerUS inflation data in July 2023 provided mixed signals. While Consumer Price Index (CPI) is moving in the right direction, producer price inflation suggest pipeline pressures are picking up. Core CPI, which excludes often-volatile food and energy costs, rose only 0.2% for a second month in a row . However, US producer prices picked up in July, owing to increases in certain service categories. This likely buys more time for the Federal Reserve (Fed) to deliberate on the future path of monetary policy.
The flows into bond exchange traded funds (ETFs) have been volatile. Over the past year, investors were starting to embrace duration. Investors were positioned for recession, inflation crash, and Fed cuts - evident from $31.7bn inflows to Treasury bond ETFs on pace for a record year2. However, investors are starting to pull out of the biggest bond ETFs devoted to Treasuries. More than $1.8 billion came out of the $39 billion iShares 20+ Year Treasury Bond ETF last week, the most since March 20203. Sentiment toward long-dated Treasuries has soured over the past month amid growing conviction that the Fed will keep interest rates at elevated levels for an extended period. We expect rates to remain higher for longer and are unlikely to see the Fed cut rates until the Q1 of next year amidst a stronger US economy.
Don’t celebrate on disinflation just yet
Overall, the US economy continues to show extraordinary resilience despite monetary constraints and credit tightening. While inflation has shown encouraging signs of decline, we caution that the level remains high. Strong July retail sales raise the risk of a re-acceleration in inflation. The four biggest categories of the ex-auto’s component saw outsized gains: non-store retailers, restaurants & bars, groceries, and general merchandise. Amidst a tight US labour market, with unemployment at historic lows and wages continuing to rise, the downward pricing momentum in the service sector is likely to be at a slower rate. Commodity prices are also beginning to rebound from the weakness seen in Q2 2023. Energy prices have been rising on the back of Organisation of Petroleum Exporting Countries and its allies (OPEC+) production cuts. If commodity prices extend their recent momentum, it could pose upside risks to inflation.
Fed Officials remain divided
Messaging on a somewhat mixed inflation outlook from the Fed Officials remains a mixed bag. One faction remains of the view that rates hikes over the past year and a half has done its job while another group contends that pausing too soon could risk inflation re-accelerating. Fed governor’s Michelle Bowman and Christopher Waller remain in the hawkish camp, hinting at more rate increases being needed to get inflation on a path down to the 2% target.
Futures markets are assigning about a 11% chance of a 25-basis-point rate hike when the Fed next meets on 19 and 20 September4. Additionally, rate cuts have now been completely taken off the table until perhaps later in the Q1 2024. The latest Fed minutes reveal commentary from officials, including the hawks, such as Neel Kashkari, suggest a willingness to pause again in September, but to leave the door open for further hikes at the upcoming meetings5.
Opportunity for a yield seeking investor
It’s been an impressive turnaround since the pandemic when negative real yields became the norm. TINA- ‘There Is No Alternative’ to equities, is over now that evidence of the shift to a 5% world appears stronger than ever. Today investors have the opportunity to lock in one of the highest yields in decades, with US two-year yields paying close to 5% exceeding the yields at longer maturities without the volatility witnessed in the 10-year sector. A resilient US economy is likely to keep interest rates and bond yields higher for longer.
Sources
1 Bureau of Labour Statistics as of 10 July 2023
2 BofA ETF Research, Bloomberg as of 9 August 2022 - 9 August 2023
3 Bloomberg as of 14 August 2023
4 Bloomberg as of 17 August 2023
5 federalreserve.gov as of 16 August 2023
This material is prepared by WisdomTree and its affiliates and is not intended to be relied upon as a forecast, research or investment advice, and is not a recommendation, offer or solicitation to buy or sell any securities or to adopt any investment strategy. The opinions expressed are as of the date of production and may change as subsequent conditions vary. The information and opinions contained in this material are derived from proprietary and non-proprietary sources. As such, no warranty of accuracy or reliability is given and no responsibility arising in any other way for errors and omissions (including responsibility to any person by reason of negligence) is accepted by WisdomTree, nor any affiliate, nor any of their officers, employees or agents. Reliance upon information in this material is at the sole discretion of the reader. Past performance is not a reliable indicator of future performance.

Intervention - Fatal Flaw in Capital Markets?In the news today is the Japanese Yen, as it approaches critical resistance at the 146 level. The market has steadily been making new highs on the daily level this year, having just exceeded the July high. As seen in the chart above the market has moved quickly through levels of resistance, now breaking a downtrend line from the major Oct 22' high. See below a quarterly chart, the Yen is making new highs at significant timescales, possibly threatening a breakout as the historical ceiling is much higher than the modern perception might lead one to believe.
The need for intervention around the current price level has become a concern for the global investment community, since in September and October the Bank of Japan proceeded with heavy selling of US Dollars to support their currency at the 145 level. This was last reached in 1998, at the height of the infamous Nikkei bubble as equity market growth produced historic inflation. However there was no need, or thought for intervention then which begs the question of why it is seen as a necessity now.
This is largely due to the degradation of credit markets around the globe, and the inability of central banks to produce productive inflation, meaning real economic growth. In 1998 the yield for a 10 year bond was around 2%, whereas outside the US negative interest rates have become common. See below as the yield for 10-year Japanese Government bonds has pushed against, and exceeded the imposed 'ceiling' since moving from negative interest rates.
The attempts by central banks to "stimulate" investment by lowering bond yields has in fact had the opposite effect, since investors will naturally seek the highest return on investment .
In the modern economyc, bonds and government credit are treated as cash, so as central banks buy sovereign debt they are absorbing and concentrating capital which historically has circulated globally across currency and asset classes. This has the effect of domestically creating deflation, as capital is less free to circulate, but internationally will create inflation as (in this case) investors are not buying Yen-denominated debt , leading to the Yen losing strength in FX-markets.
So the level at which intervention is required to support currencies is slowly being drawn lower, as the Bank of Japan burns the candle at both ends. It is NOT possible in globalised, open markets to engage in both bond market and FX market intervention as one or the other must reflect the degradation of economic conditions. This issue cannot be resolved domestically as international capital dictates growth, and lowering yields is not a means to attract investment.
The Bank of Japan has resolved to loosen control on bond markets, by allowing 10- year yields to settle on a market-determined fair price. However, price discovery has not been a relevant dynamic in credit markets for nearly 30 years. With FX already at critical levels, it is important to be wary of volatility as capital flows shift with respect to war, credit and equity bubbles around the world and so on. Europe and China, among others should also be under the radar for engaging in this flawed logic without international support for their currency. So long as the United States, backed by foreign reserves of US dollars, pushes the bill on interest rates this intense pressure will continue to be reflected in global financial markets.

Increasing The DXY Profit Target to $154 From $103The DXY after catching a rally off a 4-Hour Bullish Butterfly, has reached my price target of $103, and if it gets above that zone, then I think the DXY will have plenty of room to make multi-decade highs due to The High Interest Rates, Tightening Credit Conditions, and The Deflation that is now being priced into the US Bond Market.
If things go as expected beyond the $103 zone, we will likely have entered into a Harmonic Wave Structure that should take us up to the Macro 0.886 Fibonacci Retrace which sits all the way up at $154
The RSI and PPO are both sitting at the mid point which is an area where it can often go just to reset before making higher highs in price.

Consumer Credit: Harmonically Set Up to Return Down To TrendConsumer Credit has recently risen to over $1 Trillion and this rise happens to align with a 2.618 Fibonacci Extension and the PCZ of a Bearish ABCD. If we view this based on the expectations of Harmonics and Fibonacci, we would expect that this is indeed the top and that we will now begin a retrace back down to trend, which could likely land us between the 50% and 61.8% retrace down at $600–$500 Billion as those retraces line up with the trend line we have formed.

🟨 RECESSION? - TIGHTER CREDIT CONDITIONSFED CHAIRMAN POWELL'S STATEMENT 🎙️
Chairman Powell remains flexible regarding future rate hikes, emphasizing that decisions will be taken on a meeting-by-meeting basis. Notably, the removal of the word "anticipates" indicates a decrease in urgency for additional rate increases. Furthermore, the absence of the phrase "sufficiently restrictive" suggests that current policy has reached the desired level.
LENDING AND CREDIT CONDITIONS 💳
The Federal Reserve is closely monitoring lending and credit conditions as tighter credit may replace some of the rate hikes that could have been necessary. The current approach can be described as a "hope and pray" policy, where the Fed relies on falling inflation and tighter credit conditions to achieve a sufficiently restrictive stance, while hoping no other issues arise.
POTENTIAL RECESSION ON THE HORIZON? 📉
Tighter credit conditions might lead to a recession. However, it is essential to determine how much of this possibility has already been factored into the market.

Quality is back in focus, amidst the banking turmoilHistory never repeats itself, but it often does rhyme. The recent collapse of Silicon Valley Bank (SVB) and Signature Bank in the US and the forced takeover of Credit Suisse by rival UBS have triggered concerns of contagion across the global financial system. The current stress in the banking sector is reminiscent of the 2008 financial crisis. However, unlike the 2008 financial crisis, uncertainty is not centred on the quality of assets on bank balance sheets but instead on the potential for deposit flight.
Tough ride for Banks ahead
US regional banks have witnessed significant deposit outflows which, combined with unrealised losses on their security holdings, have seen banks consuming their liquid assets as a very fast pace. In turn, sentiment towards European banks has deteriorated. This is evident in the widening of debt risk premia, making it more expensive for banks to fund their operations. It’s important to note that banks were already tightening lending standards prior to recent events. So, lending conditions are likely to tighten further as deposits shrink at small and regional US banks and regulators respond to the new risk environment. The turn of events in the banking sector have led to higher uncertainty which is likely to be reflected in higher volatility in credit markets. So far, the impact on other sectors has been fairly contained, but a further deterioration of bank credit quality could drag other industries lower as well. We are still in the early innings, so the range of repercussions remains wide.
Traditional defensive sectors offer more protection in prior weakening credit cycles
On analysing the impact of a further rise (by 200Bps) in credit spreads on US and European debt (highlighted by the dark blue bars) we found that not all equity sectors will be impacted equally on the downside. In fact, traditional defensive sectors like utilities, consumer staples and healthcare could offer some protection in comparison to cyclical sectors such as banks, energy and real estate.
Since March 8, 2023, the steepest price corrections have been centred around the banking and commodity related sectors such as energy and materials, while technology, healthcare, consumer staples and utilities have managed to escape the rout illustrated by the grey bars. The historical sector performance (in the light blue bars) during Eurozone debt crisis (the second half of 2011), confirm a similar pattern whereby the traditional defensive sectors tend to shield investors when spreads widen.
Europe earnings hold forth despite the banking turmoil
Interestingly despite the recent banking turmoil, the global earnings revision ratio continued to show resilience in March. Europe stood out as the only region with more upgrades than downgrades. Earnings remain the key driver of equity market performance. Europe has clearly gotten off to a strong start and it will be interesting to see if European earnings expectations can hold up as credit conditions deteriorate.
Within Europe we analysed the sectors that were most exposed to the banking stress. By observing the beta of the sectors in the EuroStoxx 600 Index relative to regional banking spreads, we found that real estate, financials, industrials, materials, and energy were most exposed on the downside to the high banking stress. On the contrary, consumer staples, information technology, utilities and healthcare showed more resilience.
When the going gets tough, quality gets going
Investors should focus on companies with strong balance sheets which we often tend to find within the quality factor. Quality stocks, characterised by a higher earnings yield compared to its dividend yield alongside higher return on equity (ROE) and return on assets (ROA), would offer a higher margin of safety in periods of higher volatility.
Conclusion
While central banks in US, Europe and UK continued their hawkish stance at their most recent policy-setting meetings, the evolving banking crisis could alter the path for monetary policy ahead. Chair Powell conceded that tightening financial conditions could have the same impact as another quarter point rate hike or more from the Fed.
Given the rising concerns on the risk of banking industry contagion, shrinking corporate profits and central bank policy ahead we continue to believe that positioning your equity exposure towards the quality factor would be prudent.
