BLESSUSDT plan 12-02-26BlessUSD plan 12-02-26
The price has been pumped up into the supply area, but there has been no rejection. It continues to rise, forming a compression. In this situation, when the price enters the fresh supply area, it doesn't necessarily mean it will fall. It would be better to wait for a bearish engulfing to form in the supply area, with confirmation of a change in character on a lower timeframe.
CRPTOCURRENCY

Solana - SOLUSDT in downtrend SOL toward 80$ Could see short term bounce in price from this zone.
Potential buying for long-term positions could be possibly around 30$.
Disclaimer : This is not trading or investing advise.

WIF/USDT – Accumulation Phase Before Potential RecoveryWIF continues to consolidate after an extended downtrend, currently trading around $0.53 within a well-defined range between $0.45 (support) and $0.85 (resistance).
The structure shows signs of base formation, with steady accumulation and reduced volatility — a setup that often precedes directional movement.
Support zone: $0.45 remains the key demand area where buyers are consistently stepping in.
Resistance zone: The main resistance to watch is near $0.85 — a breakout above could confirm trend reversal.
Volume behavior: Gradually increasing volume hints at potential momentum build-up for an upward move.
If market sentiment improves, WIF could attempt a return toward the $0.75–$0.85 zone, marking a mid-term recovery phase. For now, holding above $0.50 keeps the structure constructive for a bullish continuation.

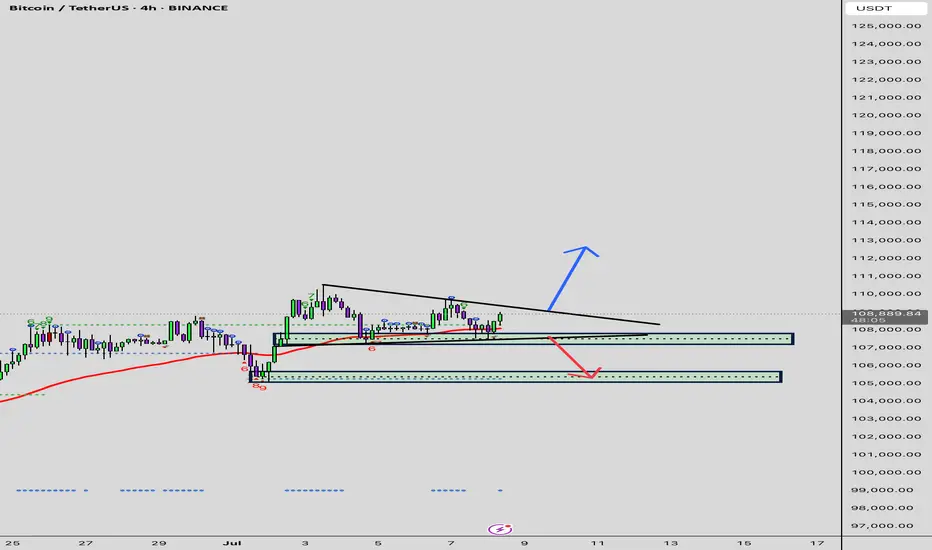
Bitcoin Market Analysis – October 18, 2025👀 Current Outlook:
Price has found support around the 104,000 zone, and there’s a good chance we might start building a consolidation zone here.
📈 If that consolidation forms, a breakout above 107,000 could trigger a long position and signal renewed bullish momentum.
📉 On the flip side, if 104,000 breaks again, we may see a deeper drop, which could weaken the overall bullish structure and make it harder for the market to reach new all-time highs in the near future.
⚡️ In case of a sharp reversal and a V-pattern formation, it’s better to shift to a bullish bias and follow the momentum.
🕒 On the 15-minute timeframe, if we’re trading within the range, a break below 106,000 could provide a short setup.
---
💡 Conclusion:
Stay patient and wait for clear confirmations before entering any trades. Let the market show its direction — then follow the trend with discipline
For informational purposes only – not financial advice. © DIBAPRISM
Larry D.Kohn

Squeeze is in the works. Stay tuned for the next move. Barring a major crash in the crypto sector, 40 cents is the next likely move for HBAR.
If it crosses and sustains above 40 cents, then a move to its all-time high (57 cents) is very likely.
If it breaks below the wedge, then 13 cents is the next target. 0.8 cents below that.
LONG-TERM, THIS HAS A LOT OF ROOM ABOVE.

BTCUSDTHello Traders! 👋
What are your thoughts on BITCOIN?
Bitcoin has entered a corrective phase after printing a new all-time high and reaching the top of its ascending channel.
This pullback is expected to extend towards the key support zones, and in a deeper scenario, it could test the bottom of the channel.
As long as Bitcoin holds above these support areas and reacts positively at the lower boundary of the channel, the broader outlook remains bullish, with potential for new all-time high
However, a decisive break below the channel’s bottom would invalidate the medium-term bullish scenario and raise the risk of a deeper correction.
The current correction may provide a valuable opportunity for medium- to long-term traders to re-enter the market.
Don’t forget to like and share your thoughts in the comments! ❤️

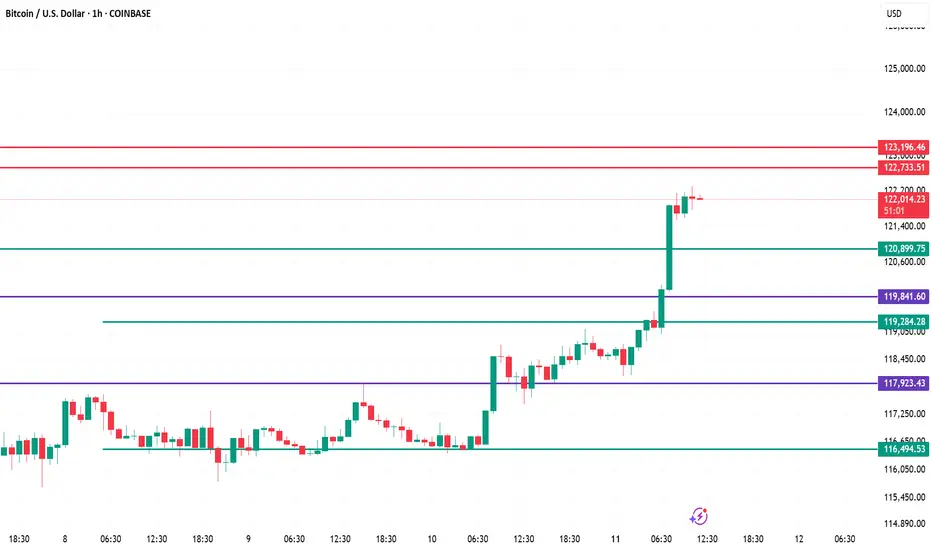
Bitcoin 1H Chart – Analysis
Current Momentum – Strong bullish breakout above key resistance zones 119,841 and 120,899, indicating aggressive buying pressure.
Immediate Resistance – Price is now approaching 122,733–123,196, a heavy supply zone; possible short-term profit booking area.
Support Levels – Nearest support now sits at 120,899, followed by 119,841. Holding above these keeps momentum intact.
Market Structure – Clear higher highs and higher lows; trend remains bullish unless price breaks below 119,284.
Trading Plan – Ride the uptrend with trailing stops; watch for reversal signals at 122,733–123,196 or continuation breakout above 123,200 for fresh upside.
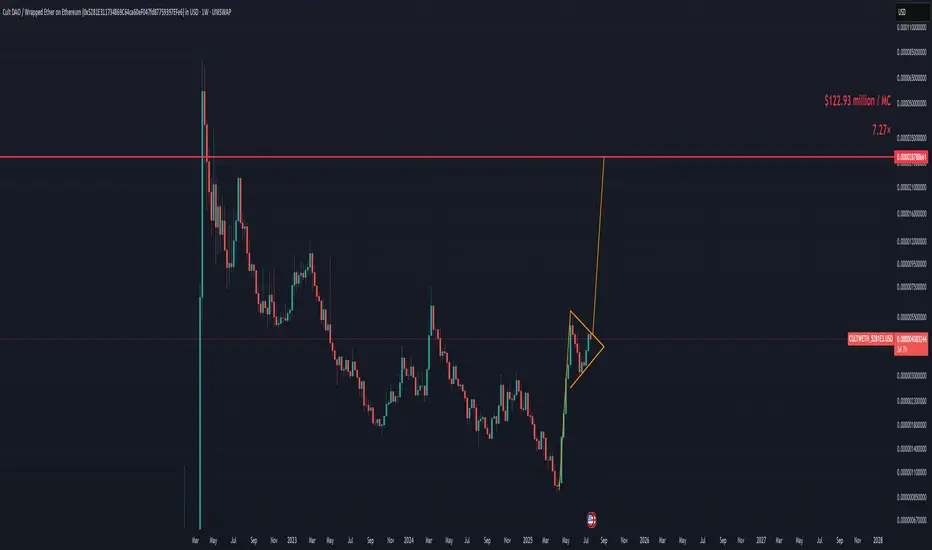
Brace for Impact: CULT DAO’s Bull Flag Points to Violent Upside!If you missed the last 500% wave from CULT DAO, fear not you’re just in time if you’re reading this.
My bottom call was slightly off, but since the lows, it's up 500% and it's just getting warmed up.
We are now forming a giant bull flag that will take CULT DAO straight to $122 million a 7.27x from this price.
I will be publishing CULT DAO TA’s until we hit a one billion dollar market cap, which we should reach sometime in Q4 2025.
Seeing a giant bull flag forming as we enter the final phase of the bull market is beautiful.
Prepare accordingly. Time is limited. We will blast off in under 30 days.
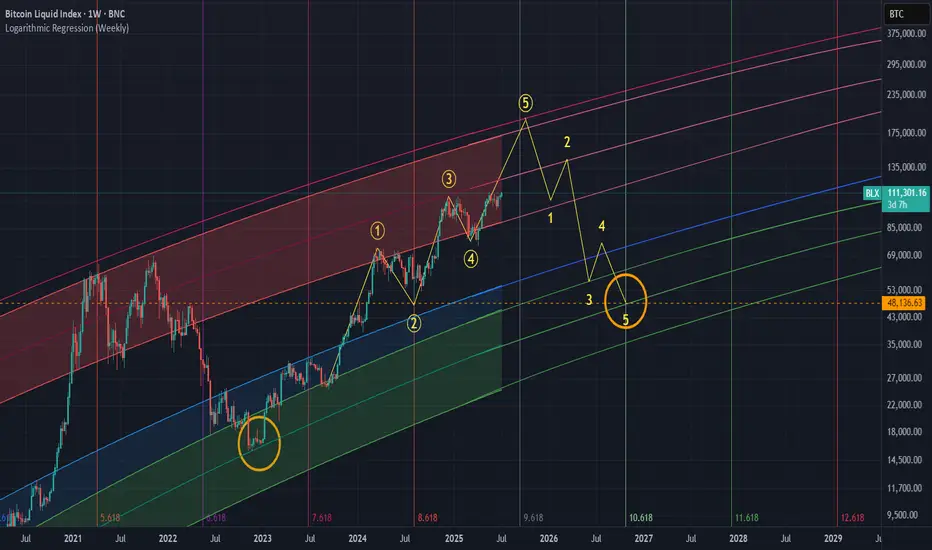
The Final Parabola: What History Says About Bitcoin’s July MovesIf you’ve been following here for a while, you know we’ve been nearly pinpoint in calling all the moves for Bitcoin. The altcoin market, not so much, but check out previous TAs to catch up on my perspective.
The two wave counts you see on the main chart have been in place for many months, I believe since around October 2024. As you can see, things have been playing out perfectly so far. The four year cycle continues to follow its path.
If the same thing happens this cycle like the last two, we should see a top sometime between October and December 2025, anywhere from 185K to 225K, followed by a cycle low somewhere around 48K in October 2026.
Bitcoin’s Julys
Every July during the 4th cycle year, Bitcoin begins its final parabolic run. This has happened without fail since the beginning of the Bitcoin Index chart. July consistently marks a major bottom, and then it's off to the races. The “only up” period that follows typically lasts 4 to 6 months and happens just once every four years like clockwork.
Here we are once again, the 4th year of the cycle, in July. Bitcoin has just hit all time highs and we've had a Hash Ribbon buy signal.
The perfect storm is brewing. Like always, the stars align in the second half of the 4th year of the Bitcoin cycle.
Time Cycles and Fibs
Looking at this time wave chart, we can see that every two waves like clockwork have marked a top. The next major wave appears to land in December 2025.
If we zoom into this smaller time wave, it has pinpointed the bottom of every small wave so far. The fact that we are once again at a bottom in July during the 4th year of the Bitcoin cycle is just another sign of the magical stars aligning.
This smaller Fibonacci sequence I’ve been tracking has already hit twice and predicted two major moves. The next dates to watch are August 2025 and January 2026.
There’s plenty of talk about an extended cycle. But during the last bull run, many traders and analysts said the same thing. In the end, Bitcoin topped out at exactly the same timeframe as the previous cycles.
If we reach the top of this model in Q4 2025, and we see a Pi Cycle Top signal along with a Mayer Multiple over 2.0, that will be our trigger.
If you've been sidelined this entire time, it's now or never. You don’t want to be the one buying in at 185K in Q4 2025 when everyone is calling for a million dollars. The time to act is now.
BTC/USD SCENARIO Bitcoin is trying to break out of the 110,000
If we break out we will see a new high
If we don’t break it we could see 105k possibly 100k
XRP COIN NEXT VIEW Good Day 🌞 Folks i hope all of you are earning well 🥰
Am Still holding my #Xrp🔥🔥 CRYPTOCAP:XRP my next week View on Xrp price soon will jump above $3 so am just holding as of now ❣️🙏🏻 let's see what's next ✌🏻 those who are holding will get great 😃 opportunity to succeed. In below 👇🏻 mentioned chart 📉 you can see my holding trade still waiting for another Rocket 🚀 #xrp

ARTY Launch: Play-and-Earn goes live June 30KUCOIN:ARTYUSDT Artyfact (ARTY) is approaching a major milestone, with its Play-and-Earn platform scheduled to launch on June 30. In anticipation, the token is already showing signs of strength, trading around $0.188 and gaining upward momentum. This move comes off a clear technical structure: a double-bottom reversal followed by a breakout above the descending trendline.
Price action is beginning to confirm the shift in sentiment as the official Play-and-Earn tournament kickoff draws near. With just days left until June 30, anticipation is building as the launch will mark a real turning point. Until then, the current pre-launch sentiment continues to lean optimistic, driven by growing community engagement, strong social media traction, and increasing excitement around what Artyfact is building.
The anticipation surrounding the June 30 launch could be creating strong momentum, as traders and early supporters position themselves ahead of what could be a key moment for the project.
From a broader market perspective, Bitcoin continues to lead the risk-on rotation. BTCUSD recently had an aggressive bullish rally and is poised to maintain upward momentum if macro conditions remain favorable.
Historically, Bitcoin strength has preceded major capital inflows into small-cap altcoins. As BTC resumes its bullish trajectory toward the $110,000 zone, it provides ideal conditions for undervalued projects to reprice aggressively. The rotation effect tends to flow from BTC → ETH → high-utility altcoins and ARTY is positioned to benefit from this dynamic.
Fundamentally, ARTY is deeply undervalued relative to its potential.
Low market cap: A micro-cap with asymmetric upside.
80%+ of total supply is in circulation, reducing inflation risk and encouraging organic demand.
Holder base is expanding, reflecting early-stage adoption and network growth.
Major catalysts ahead:
🎮 Launches on PlayStation, Xbox
📱 Releases on AppStore and Google Play
🧩 NFT integration and metaverse gameplay expansion
These milestones could drive exponential user growth, attracting both gamers and crypto enthusiasts to the ecosystem. When combined with the convergence of technical bottoming, bullish macro conditions, and strong fundamental catalysts, the setup supports the potential for a sustained move toward the $1.00 zone as momentum builds post-launch.
Traders should monitor for confirmation:
-Higher low formations
-Expansion in bullish volume
-Strong closes above interim resistances
With BTC strengthening and capital rotating down the risk curve, early entries in fundamentally sound projects like ARTY offer high risk-reward profiles.

XRP/USDT Reversal Play: Bounce from Strong Demand Zone🔍 Chart Analysis:
🟫 Strong Supply Zone: The price has bounced perfectly off a strong demand zone (labeled "strong supply zone" in the chart, but likely intended to be demand), showing buyer interest near the $2.05–$2.12 range.
📉 Recent Downtrend: XRP recently experienced a sharp decline, but the price has now touched this critical zone, suggesting a potential bullish reversal.
🔁 Potential U-Shaped Recovery: A rounded reversal pattern is indicated with the red curve, aiming for a U-shaped recovery targeting higher resistance levels.
📊 EMA 70 (2.2932): Current price is trading below the EMA, which acts as a short-term resistance. A break above it would be bullish confirmation.
📌 1st Resistance: Around $2.2932, which aligns with the EMA. This is the first challenge for bulls.
📌 2nd Resistance: Near $2.40–$2.47, a critical barrier before long-term targets.
🎯 Long-Term Target: Set near $2.63, the peak from the previous rally, aligning with major resistance.
🕯 Volume: Decent volume spike at the bounce, confirming interest from buyers.
🧠 Trade Setup: Reversal from Strong Demand Zone
📍 Entry Zone:
🔹 Enter between $2.12 – $2.15 (ideal after confirming a bounce or bullish candle above the zone)
🛡️ Stop-Loss (SL):
🔻 Place below the demand zone — $2.05
(Protects from deeper downside if support breaks)
🎯 Take Profit (TP) Targets:
TP1 – $2.29 (🟦 1st Resistance / EMA 70)
🔸 Partial profit booking here; break-even SL for the rest
TP2 – $2.40 (🟦 2nd Resistance)
🔸 Major resistance zone; expect a reaction
TP3 – $2.63 (🔴 Long-term Target / Previous High)
🔸 Full target for position holders
📊 Risk/Reward Ratio:
Approximately 1:2.5 to 1:3.5, depending on entry
🔔 Extra Notes:
📈 Watch for bullish engulfing or hammer candle confirmation before entering.
🔄 If price fails to reclaim EMA 70, re-evaluate trade.
🧠 Manage position size properly — avoid over-leverage.
🔮 Summary:
XRP is attempting a bullish reversal from a key demand zone with potential to target $2.47 and even $2.63 long term, provided it clears resistance at $2.29 and $2.40. The setup favors swing traders and position holders looking for a recovery play.
💡 Strategy Tagline:
"Buy the bounce, trail the breakout, ride the reversal!" 🚀📈💹
support my idea and comment down your thoughts thanks .

UNIUSDT Forming Bullish Wave UNIUSDT is exhibiting a compelling bullish wave formation, rebounding robustly from a well-established support level. This resurgence is underpinned by a notable increase in trading volume, signaling heightened investor interest and potential for significant upward movement. The current market dynamics suggest a favorable environment for UNI, with technical indicators aligning to support a bullish outlook.
Trading Lounge
+7
The Currency Analytics
+7
Reddit
+7
The recent price action has seen UNI reclaim key support zones, demonstrating resilience and the capacity for sustained growth. Technical analyses indicate that if UNI maintains its trajectory, it could achieve gains in the range of 150% to 160%, targeting resistance levels that have previously acted as significant price ceilings. The convergence of increased volume and positive price movement often precedes substantial rallies, and UNI appears poised to capitalize on this momentum.
Investors are increasingly attentive to UNI's performance, recognizing the potential for substantial returns. The current setup offers an attractive risk-reward ratio, particularly for traders seeking to leverage the anticipated bullish wave. As UNI continues to garner attention, its market position strengthens, further validating the optimistic projections surrounding its price movement.
In summary, UNIUSDT's technical indicators and market sentiment coalesce to present a promising opportunity for traders and investors alike. The alignment of a bullish wave pattern, reinforced by strong support and escalating volume, underscores the potential for significant price appreciation in the near term.
✅ Show your support by hitting the like button and
✅ Leaving a comment below! (What is You opinion about this Coin)
Your feedback and engagement keep me inspired to share more insightful market analysis with you!


SUI/USDT Daily Chart Analysis – Rising Wedge Breakdown & Demand SUI/USDT Daily Chart Analysis – Rising Wedge Breakdown & Demand Retest in Sight
The daily chart of SUI/USDT shows a clear rising wedge pattern, typically a bearish continuation formation, which now appears to be breaking down. Price has recently been rejected from a major supply zone between $4.15 – $4.40, where historical resistance caused a reversal.
The break below the lower trendline of the wedge suggests that bullish momentum is weakening. Volume also shows a notable decline during the wedge formation and a spike on the breakdown, adding confirmation to the bearish signal.
Currently, price is approaching the first key demand zone around $3.55 – $3.70, which is also the previous breakout level and may act as initial support. A clean retest and strong reaction here could offer a short-term bounce.
Below that, a stronger “LONG IDEA” demand zone sits between $3.20 – $3.40, marked by previous consolidation and structural resistance turned support. This area represents a potential long entry zone for swing traders seeking a better risk/reward setup.
The lower green zone, labeled “SUPPORT” around $2.70 – $3.00, serves as a deeper fallback level in case of continued selling pressure.

Ethereum Trades Sideways: Bulls Need a PushFenzoFx—Ethereum is trading sideways but remains above the 50-period simple moving average, signaling a bullish market. ETH is currently priced around $1,785. A close above $1,835 could trigger a move toward the $1,950 resistance.
Bearish Scenario:
If Ethereum falls below $1,690, supported by the 50-period simple moving average (4-hour chart), it could decline toward the $1,565 support level.

TOTAL Crypto Market Cap Monthly Candle Close numbers & sequence
This is the TOTAL version of the Bitcoin chart I post every month
It is not always the same but, on average, it has the same Candle colour but not always the same Size, due to influences of ALT coins.
But what I want to draw your attention to is where that arrow is pointing.
We have just had a RED Febuary and March candle close.
This has only ever happened ONCE before.
Late 2019 - Early 2020
Infact, in 2019 we had Dec RED, Jan GREEN, Feb RED, March RED
And currently we have Dec RED, Jan GREEN, Feb RED, March RED,
The 2020 March RED was the Covid dive, that was swiftly recovered
Currently we have the "Trump Tariff Dive"
In so many ways, we are repeating the early 2020 Sequence in the TOTAL Cap
The Bitcoin Chart however, seems to be repeating the 2017 Sequence.
In 2020, TOTAL market Ca [pApril and May both closed GREEN. while en-route to a New ATH in March 2021.
A New cycle ATH in early 2026 is entirely possible though it would be Very Much out of sequence.
Things are different in many way with Crypto now...We are under new Regimes..
Discount Nothing
Interesting days indeed

Btcusd Bullishi will be observing manipulation that will last for almost 22 days for this quarter . i am leaning bullish its early to say but still i am bullish on btc 108k is imminent. we opened in discount and manipulation is likely to the lower side so a move to upside is possible.
My insta handle :
asad_chaudhry_

Potential bearish drop?The Bitcoin (BTC/USD) is rising towards the pivot which is a pullback resistance and could drop to the 1st support which acts as a pullback support.
Pivot: 97,706.94
1st Support: 91,311.03
1st Resistance: 101,849.75
Risk Warning:
Trading Forex and CFDs carries a high level of risk to your capital and you should only trade with money you can afford to lose. Trading Forex and CFDs may not be suitable for all investors, so please ensure that you fully understand the risks involved and seek independent advice if necessary.
Disclaimer:
The above opinions given constitute general market commentary, and do not constitute the opinion or advice of IC Markets or any form of personal or investment advice.
Any opinions, news, research, analyses, prices, other information, or links to third-party sites contained on this website are provided on an "as-is" basis, are intended only to be informative, is not an advice nor a recommendation, nor research, or a record of our trading prices, or an offer of, or solicitation for a transaction in any financial instrument and thus should not be treated as such. The information provided does not involve any specific investment objectives, financial situation and needs of any specific person who may receive it. Please be aware, that past performance is not a reliable indicator of future performance and/or results. Past Performance or Forward-looking scenarios based upon the reasonable beliefs of the third-party provider are not a guarantee of future performance. Actual results may differ materially from those anticipated in forward-looking or past performance statements. IC Markets makes no representation or warranty and assumes no liability as to the accuracy or completeness of the information provided, nor any loss arising from any investment based on a recommendation, forecast or any information supplied by any third-party.

The elusive alt season... Is QE coming soon?The magical Alt season never seems to come. Most have thrown in the towel or lost all their money, which is a good sign the bottom is in.
The secret here is paying close attention to the FED's (FRED:WALCL) Quantitative tightening and easing.
Since the start in 2008, we have always either had QE or some sort of pause like you see in the 2016/17 bull run, but as soon as the FED flips to tightening, what happens? BTC pauses.
It is true that Bitcoin has performed very well during tightening cycles, as massive corporations like BlackRock and MicroStrategy are eating through the supply.
As for the altcoin market, it has been a bloodbath. One thing that’s clear to me is that altcoins need the FED to flip to QE in order to get things really going.
Going over the latest FED's Monetary Policy Report that came out yesterday, it hints that they are close to ending their tightening cycle and easing off a bit.
**WHICH IS HUGE NEWS!**
We can now see that this is true indeed because the red line is now starting to flatten out, just like in 2020 before the FED flipped to QE.
As far as the technicals go, the altcoin chart has now formed an ascending triangle and, for now, is still printing higher lows. 20 days left for this monthly candle to close.
If, let's say, this monthly candle breaks ATH and closes above it, it could signal the start of the alt season, and if history repeats, we’re looking at a run-up from March 2025 to September/October 2025.
So the next FOMC meeting from the FED is the most important of the year. Now that this report hints at the end of the tightening cycle, is it possible that at the next FOMC meeting on March 18th, 2025, they will announce the end of tightening and trigger the start of the alt season?
Pretty heavy upper wick for now on the BTC.D. It’s currently on the .702 retracement. Is this the top?
A chart I use a lot. Really want to see this monthly candle close back into this triangle.
**Alts/USDT.D**
This chart is one of the most important ones I’m looking at right now. Currently forming a bump-and-run reversal, and again, very bullish if we hold the neckline.
The USDT.D chart will always lead the way. It’s always one step ahead, never fails me. Until we see a break of this green support line, we won’t see ALT season. The bear flag pattern target is the same target as April 2021, which is interesting.
As I published on my ETH TA, if we close the weekly in this channel, it will be very bullish.
### Conclusion
I'm extremely bullish right now. Leverage has been reset, greed has been reset, and everyone is throwing in the towel. On social media, "it's over" talk is everywhere. This is the kind of depression I'm looking for to tell me it’s the start of ALT season and not the end.
**Invalidation of this thesis would be the following:**
- ETH closes weekly under the channel
- Bump-and-run reversal fails to hold the neckline
- FED does not flip to QE in the FOMC meeting on March 18th
If all these things happen, I will flip bearish. Until then, I'm extremely confident that this is the bottom, and you should go all out, lay all the cards down, take out loans, put all your chips on the table—it’s time to go hard or go home!

CRV/USDT: A Make-or-Break Moment!CRV is back inside its long-term bearish channel, testing key support. If the trend holds, a potential bounce toward $0.98 (TP1) & $1.60 (TP2 ) could be in play. 🚀
However, a breakdown below $0.40 (SL) could send it to new lows. Watch this level closely!
Which way do you think CRV will go? 🔥👇

ADA/USDT RECOVERY TIMEADA/USDT RECOVERY TIME
There is good chance that Ada/usdt will return to up 1 USD level
