Bitcoin September 2025 Outlook: a/b/c price fractal structureBTC enters September post-ATH with a seasonal headwind. Base case: a ~10% A-leg dip toward $108k, a B-bounce into ~$122k, then a C-flush near ~$94k—echoing April’s ABC rhythm. Once complete, the uptrend should re-assert into year-end. 📉🔁📈 #Bitcoin #Seasonality #Crypto
🟠 Bitcoin September Outlook: Seasonality vs. Structure
After a fresh ATH, September’s historical bias skews mildly red. Base case is a ~10% A-leg dip that develops into an A/B/C correction before trend continuation. Think controlled pullback → consolidation → next markup. 📉➡️🔁➡️📈
________________________________________
🗓️ Seasonality Snapshot (2015–2024)
• Mean (10-yr): −2.55% · Median: −4.52%
• Red months: 6/10
• Worst September: 2019 (−13.88%)
• Best September: 2024 (+7.39%)
• Last 3 yrs avg: +2.8% (2024 +7.39%, 2023 +3.99%, 2022 −3.09%)
• Last 5 yrs avg (2020–2024): −1.3%
Read: September has tended to be weak, but the last two years printed green. Seasonality is a headwind—not a handbrake. 🌬️
________________________________________
🧩 Structure Thesis (Fractal Analog)
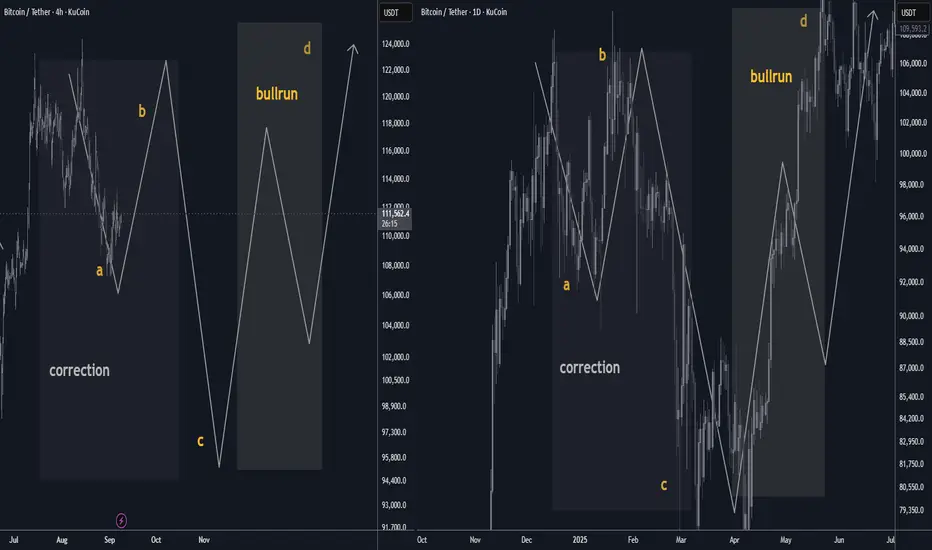
You’re looking for a repeat of April 2025’s A/B/C rhythm—scaled up:
• April 2025 reference: A ≈ $92k → B ≈ $106k → C ≈ $80k
• Now (projected):
o A ≈ $108k (≈ 10% pullback from recent highs) 📉
o B ≈ $122k (relief rally / lower high) 🔁
o C ≈ $94k (final flush into demand, completing the correction) 🧱
Interpretation: A measured September fade aligns with the A-leg. A reflexive B-bounce can follow as funding resets and late longs get cleaned up, with a C-leg completing the pattern before the next expansion. 🚀
________________________________________
📊 How Seasonality Supports the Call
• Typical drag: Median −4.5% and multiple red Septembers justify a down-bias.
• Volatility window: The historical 21-point spread (best +7.39% vs worst −13.88%) means a 10% dip sits well within normal bounds.
• Cycle context: With a new ATH just printed, a shallow corrective phase is constructive—not bearish regime change.
________________________________________
🧭 Levels & Triggers
• Bias line: Momentum cools into $108k → watch for seller absorption and open interest reset.
• Relief cap: $122k acts as B-rally resistance; sustained closes above $122k would invalidate the ABC idea and argue for immediate continuation. ✅
• Completion zone: $94k (C) is the buy-the-dip completion area; clean breaks below raise risk of a deeper time correction rather than a swift V-reversal. ⚠️
________________________________________
🧪 What to Monitor (Confirmation/Invalidation)
• Liquidity & OI: De-leveraging into A, controlled OI rebuild into B, washout into C.
• Spot-ETF flows / stablecoin issuance: Weakening into A, stabilizing by late month supports B→C rhythm.
• Funding/basis: Overheated → normalize during A; negative spikes near C often mark capitulation.
• Breadth (alts): Underperform into A/C; broad risk-on breadth usually returns post-C.
________________________________________
📝 Base Case Path (Textbook)
September: drift to $108k (A) → bounce toward $122k (B) → final tag of ~$94k (C) → reset + markup into Q4.
(If price reclaims and holds above $122k early, treat that as trend continuation—not a correction.)
________________________________________
🔒 Risk Notes
• Seasonality is a tendency, not a rule. Macro catalysts (CPI, policy, liquidity) can dominate calendar effects.
• This is market commentary, not financial advice. Manage risk and invalidation levels. 🛡️
Crypto
US100 - New Highs are coming!Market Context
The US100 is trading within a strong bullish structure after bouncing from a well-defined support zone. Price has been respecting key levels on the way up, forming fair value gaps (FVGs) that act as stepping stones for continuation. The overall picture points to a market that is building momentum for a potential liquidity grab higher.
Support Zone & Initial Rally
The chart shows a strong support zone at the lows, which provided the foundation for the current bullish impulse. Once price tapped into this area, buyers stepped in aggressively, leaving behind multiple bullish imbalances on the way up. This confirms that institutional interest is present at these levels.
Fair Value Gaps & Structural Strength
On the rally, price created overlapping FVGs, including a bullish fair value gap and an inversion fair value gap (IFVG). Importantly, candles never closed below the primary FVG — reinforcing its validity as strong demand. This means that even if price retraces, these areas will be closely watched for re-entries.
Liquidity Grab & Next Move
Above current price action lies a clear buy-side liquidity (BSL) level. The market is likely to target this zone, either directly from current levels or after a retest into the stacked FVGs. A liquidity sweep above the highs would be the natural continuation of the bullish structure, unlocking the potential for new short-term highs.
Final Thoughts
The US100 is showing a textbook bullish setup: strong support, healthy retracements, and unmitigated FVGs acting as demand. As long as the lower support holds, the expectation remains for a run into the BSL above.
If this analysis brought value, drop a like — and let me know: are you waiting for the retest, or do you think the market runs the highs straight away?

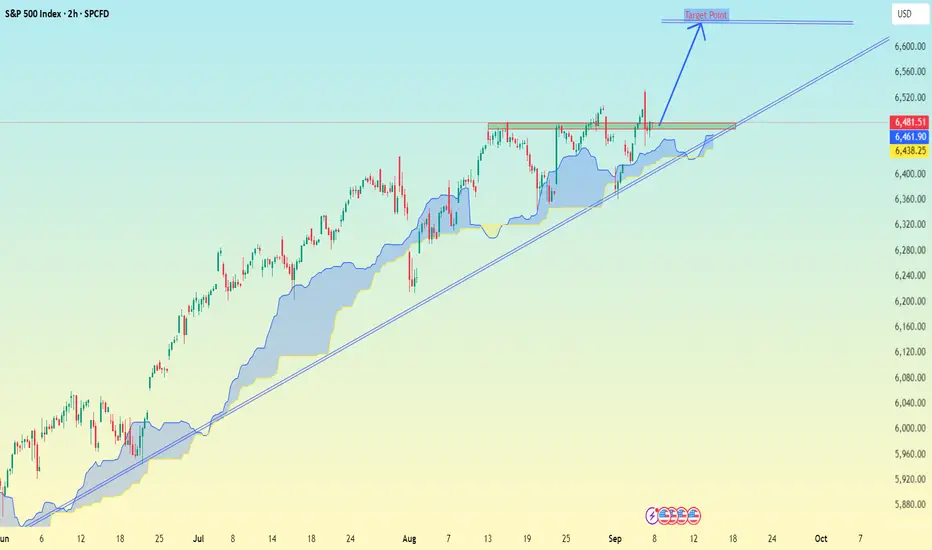
2h timeframe (SPCFD index, looks like US500 / S&P CFD).This is a 2h timeframe (SPCFD index, looks like US500 / S&P CFD).
Current price is around 6,403.
I have drawn a falling trendline from July, and price is now near the lower zone.
There’s also volume profile (VPVR) on the right side, showing key liquidity zones.
A target point is marked below, around the 6,200 level.
📌 Target Zone:
My chart suggests a downside target around 6,200 (highlighted with the blue arrow).
⚠ Notes:
If 6,400 support breaks clearly, sellers may push toward 6,300 → 6,200.
But if price reclaims above 6,480–6,500, the short-term bearish setup could fail, and we may see a bounce.
👉 Immediate target: 6,200
👉 Stop-loss to watch (invalidating short): above 6,500
XAU/USD (Gold vs US Dollar).XAU/USD (Gold vs US Dollar) on the 1-hour timeframe.
Based on the annotations in My Chart :
Current price: $3,613.28
Support area (green zone): around $3,589 – $3,600
Trendline is intact (uptrend).
Cloud (Ichimoku) is below price = bullish structure.
The chart shows a target point at ~$3,640 (marked with the blue arrow).
📌 Target Zone:
Your marked projection suggests $3,640 as the next resistance/target level.
⚠ Keep in mind:
If price breaks below the green support zone (~$3,589), it could test lower supports around $3,570 – $3,560.
If bullish momentum continues, the next extension beyond $3,640 could be toward $3,660 – $3,670.
👉 target = $3,640.

BRIEFING Week #36 : Oil Prices Diverge from RealityHere's your weekly update ! Brought to you each weekend with years of track-record history..
Don't forget to hit the like/follow button if you feel like this post deserves it ;)
That's the best way to support me and help pushing this content to other users.
Kindly,
Phil

WLD CAN DO IT AGAIN..It's been a long time since WLD showed a new increasing trend.
Following the coming hours to see if WLD is able to open a new cycle
Never enter any trend directly, wait for the confirmations, and trade only depending your setups.
WLD did show before at good cycle times, that it can do even 12 usd in short term

BTCUSD: Fake Breakout and Drop to Support LineHello everyone, here is my breakdown of the current Bitcoin setup.
Market Analysis
From a broader perspective, the price of Bitcoin has transitioned from a downward channel into a large rising wedge pattern. This structure has defined the price action for several weeks, creating a volatile environment with clear boundaries at the support zone near the 109000 level and the resistance zone up to the 113000 area.
Currently, we are at a very interesting and critical point. The price has once again rallied to the top of the Wedge and is testing the major horizontal resistance at the 112500 level. This is the third significant test of this ceiling in recent history.
My Scenario & Strategy
My scenario is built on a repeating pattern of behavior I've observed at this resistance. On the two previous tests of this 112500 area, the price created a 'fake breakout', briefly pushing above the level only to be aggressively sold off. This repeated failure is a strong clue that sellers are dominant here.
My expectation is that history will repeat itself. I'm looking for the price to make one more 'fake breakout' push into the 112500 - 113000 resistance zone. A swift reversal and a fall back below the 112500 level would be the key signal that sellers have once again taken control. The primary target for this move is 110700, which aligns with the ascending wedge support line.
That's the setup I'm tracking. Thank you for your attention, and always manage your risk.

ETHUSD BUY NOW 4287🟢 ETHUSD – Bullish Setup at 4287 Long Opportunity
Ethereum is holding strong above key support at 4280–4290, showing signs of bullish continuation. Price action confirms buyer strength, with momentum indicators aligning for a potential breakout toward higher resistance zones.
🔹 Trade Idea: BUY ETHUSD @ 4287
- Entry: 4287
- Stop Loss: 4215 (below recent structure)
- Take Profit: 4450 / 4600
- Risk/Reward: ~2:1
📊 Technical Confluence:
- Bullish engulfing candle on 1H
- MACD crossover and RSI above 50
- Price respecting ascending channel
- Volume spike confirming accumulation
💬 Narrative:
ETH continues to attract institutional interest, with inflows rising and sentiment shifting bullish. A clean break above 4350 could accelerate toward 4600, especially if BTC maintains strength.

ETHUSD – Bearish Setup at 4300 Short Opportunity
🔴 ETHUSD – Bearish Setup at 4300 Short Opportunity
Ethereum is facing rejection near 4300, a key resistance zone aligned with descending trendline pressure and weakening momentum. Price action suggests sellers are regaining control, with lower highs forming and volume fading on bullish attempts.
🔻 Trade Idea: SELL ETHUSD @ 4300
- Entry: 4300
- Stop Loss: 4362 (above recent resistance)
- Take Profit: 4260 / 4215
- Risk/Reward: ~2:1
📉 Technical Confluence:
- Rejection from descending trendline
- Bearish divergence on RSI
- MACD histogram turning negative
- Volume drop on recent push
💬 Narrative:
ETH failed to hold above 4300, signaling potential downside toward 4215 if support zones break. With sentiment tilting bearish and BTC showing signs of consolidation, short bias remains valid unless bulls reclaim 4360+.

Link has a good entry today.enter if Link price is within ±2% of 22.40.
take profit at 27.70.
this is a swing trade, not a quick one. patience pays off.
nb: if price goes against you, hold or move it to a Smart Rebalance Bot until the market turns.
don't allocate more than 5% of your portfolio per trade.

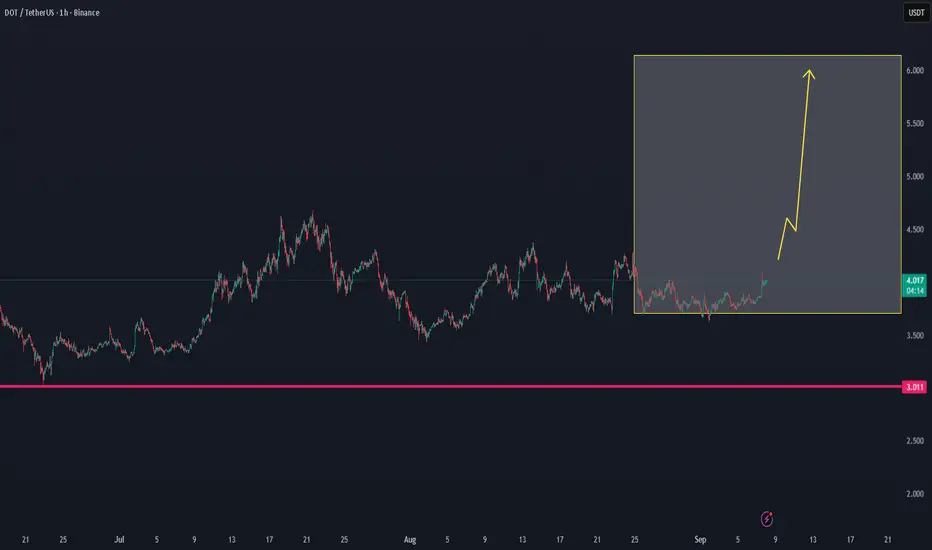
DOT STARTING NEW VOLUME TRENDDOT STARTING NEW VOLUME TREND
Following to see new confirmations at DOT
BTC - Bullish continuation in the makingMarket Context
BTC has recently broken out of a long-standing descending trendline, marking a significant shift in sentiment. This breakout signals the end of the controlled downtrend and sets the stage for a possible bullish continuation. At the same time, the chart shows a clear sweep of sell-side liquidity at the lows, which often serves as the fuel for a reversal.
Trendline Breakout & Liquidity Sweep
The bullish breakout of the old upper trendline is an important technical event. Combined with the earlier sell-side liquidity sweep, this suggests that downside liquidity has been cleared and that the path of least resistance could now be higher. Such a combination often marks the start of a new leg in the trend.
Market Structure Shift Retest
Following the breakout, price has pushed higher and printed a market structure shift (MSS). The current retest of this MSS zone will be key — if it holds, it provides the ideal spot for bulls to reload positions. This retest acts as confirmation that the breakout is valid, not just a short-lived deviation.
Next Liquidity Grab & Upside Targets
Above the current range sits a clear buy-side liquidity pool. The next logical move would be a grab of that liquidity, which could extend into a more aggressive bullish expansion toward higher levels. The structure suggests a stair-step move higher: liquidity grab, retest, and then continuation toward 115k–117k zones.
Final Thoughts
The sell-side liquidity sweep, trendline breakout, and market structure shift all point to a bullish shift in momentum. The key lies in how price reacts to the retest — hold it, and the next liquidity levels are likely to be taken.
If this breakdown helped clarify the setup, a like is much appreciated — and let me know in the comments: are you playing the retest, or waiting for the liquidity grab above?

S&P500 | 100 year bullish channel | GTradingMethodHello Traders - Happy Monday!
I thought this was a very interesting perspective on S&P500.
What they don’t want you to see... 👀
The S&P has been moving inside a bullish channel for nearly 100 years (since 1925).
Right now, price is breaking out of that channel but is it fakeout?
If it’s a fakeout, the implications are huge: we could be looking at a 70% drop back to the bottom of the channel.
⚠️ Chart is on the monthly timeframe with a logarithmic scale.
What do you think — breakout or fakeout? Very keen to hear all your thoughts
#TradingLife

After the TGE Spike, WLFI Faces Its First Real TestWLFI 4H Update
TGE week is behind us. Price dropped 57% from the weekly high at 0.3781 down to 0.1612, then bounced back into the 0.2445 area, just above green support.
Now with the new week starting, price is pulling back, hitting PSAR and closing out this bullish wave. My view: if current support fails, we’ll likely retest the lower level around 0.1700.
RSI is sitting below SMA and 0.5, MACD close to flipping red, which would confirm downside momentum.
That said, WLFI trades heavily on news—developments this week could shift price action fast.
Always take profits and manage risk.
Interaction is welcome.

BTCUSD Short: Dump Of Supply ZoneHello, traders! The price auction for BTC has been operating within a large ascending channel, a structure defined by key pivot points that have established the 109500 demand area as support and the 113200 supply area as resistance. This bullish framework has guided the price through a series of higher highs and higher lows, confirming the buyer's initiative and the strength of the current uptrend.
Currently, the auction is at a critical inflection point at the top of this channel. The price has rallied to directly test the channel's ascending supply line, which forms a confluence of resistance with the horizontal 113200 - 113600 supply zone. This is a key area where sellers are expected to become active and challenge the prevailing bullish momentum.
The primary scenario anticipates a corrective move from these highs. The expectation is that sellers will defend the supply zone and reject the price, initiating a downward rotation back towards the channel's support line. A failure to break out higher would confirm a short-term correction is underway. The take-profit for this rotational play is therefore set at 110100 points, targeting a key liquidity area above the primary demand zone. Manage your risk!

Correction for MYX/USDT .. BACK TO $2.43?We have seen a powerful increase last time for this coin. And at sthe ame time this coin is at risk.
It can get a correction, which can bring this coin back to $2.43

#NOT Ready to Make Massive Bullish Move | Must Watch for Bulls Yello, Paradisers! Is #NOTcoin about to explode into a bullish breakout, or is this just the calm before a brutal shakeout? Let’s break it down on #NOTUSDT:
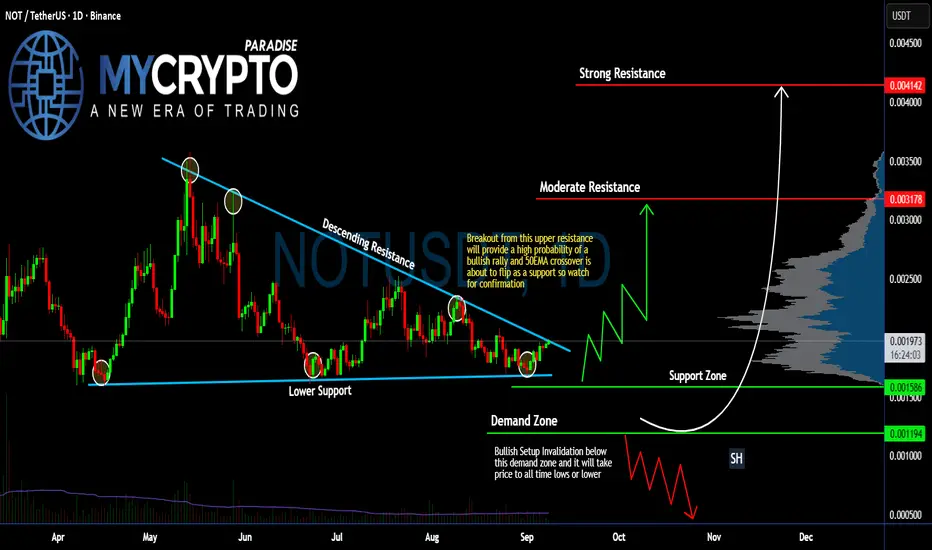
💎After months of consolidation, #NOT has been trading inside a descending triangle, with clear descending resistance pressing price down and lower support holding the structure since April. Right now, the price is sitting at $0.00197, testing the upper boundary of this pattern.
💎A confirmed breakout above the descending resistance would open the door for a strong bullish rally. The 50 EMA is about to flip into support, which could act as extra confirmation if buyers step in.
💎In this scenario, the first target sits at moderate resistance around $0.0031, while a sustained push could bring us toward strong resistance at $0.0041. That zone aligns with the volume profile high and would likely trigger sharp profit-taking and volatility.
💎On the flip side, if bulls fail and GETTEX:NOT breaks below the support zone near $0.00158–$0.00119, the bullish structure becomes invalid. A drop into the demand zone would expose #NOT to fresh lows, potentially retesting all-time low levels. That’s where late longs risk getting wiped out, so this is the area where risk management becomes absolutely critical.
Stay patient, Paradisers. Let the breakout confirm, and only then do we strike with conviction.
MyCryptoParadise
iFeel the success🌴
ETHUSD BUYS TODAY GOOD PROFITS ✅ ETHUSD Buy Recap – Profitable Moves Today
- Entry Zone: 4280–4300
- Current Price: ~4320+
- Profit Potential: +20 to +40 points depending on exit
- Momentum Drivers:
- MACD and RSI showing bullish continuation
- Volume spike confirming buyer strength
- Price holding above key moving averages (MA10, MA50, MA100)
📊 Technical Summary:
- Moving Averages: Strong Buy
- Indicators: Mostly Buy with some overbought signals
- Trend: Short-term bullish, with potential resistance near 4345–4360
If you caught the buy near 4287 or 4300, you’re riding a clean wave.

ETHEREUM TO BREAKOUTEthereum is holding above September's pivot at $4,230, and when the yellow resistance line is broken, it may start the rally again and $4775 can be the first target

BTC/USDT 4hour chart update !! BTC/USDT
Downtrend Channel Broken
Bitcoin was moving inside a descending channel (highlighted).
The price has now broken above the channel, indicating a potential trend reversal from bearish to bullish.
Support Zone
The green area around $107,000 – $108,000 acted as strong demand/support.
BTC bounced sharply from this zone, confirming that buyers stepped in.
50 Red MA (short-term) → Recently crossed above price, but BTC reclaimed it, turning it into support.
200 Green MA (long-term) → Sitting around $114,000, which may act as the next resistance.
Trendline Support
An ascending trendline (black) is holding current price action.
As long as BTC respects this line, the short-term outlook remains bullish.
Resistance: $114,000 (200 MA zone) → first big hurdle.
Higher target: $118,000 – $120,000 if momentum continues.
Support: $110,000 (trendline) and $108,000 (demand zone).
📈 Outlook
Bullish bias as long as BTC holds above $110,000 support/trendline.
A break above $114,000 could trigger a push towards $118K – $120K.
If BTC loses $110K, risk of retesting $107K – $108K support zone.
DYOR | NFA

SUI Swing Long Opportunity - AltcoinSUI Swing Long Opportunity
📊 Market Sentiment
Market sentiment remains strongly bullish as the FED is expected to deliver a 0.25% rate cut, with speculation building for a possible 0.5% cut in September. Monetary policy shifts are being driven by both inflation trends and weakening labor market data. The latest August and September job reports were soft, signaling that the economy is cooling rapidly. This environment continues to fuel expectations for a major bullish run in the weeks ahead.
📈 Technical Analysis
Price ran the HTF liquidity and bounced from there.
Price tested the HTF key resistance level three times and was rejected, but today it finally broke and closed above the HTF key SR. I expect this level to hold.
Price also broke the bearish trendline that had been controlling the bearish trend since July 27th.
📌 Game Plan
I will be looking to build a long position when we retest the broken HTF Key Level at $3.44.
Possibly, price may also retest the broken trendline, but I won’t be relying on that scenario.
🎯 Setup Trigger
Retest of the broken HTF key level.
📋 Trade Management
Stoploss: $3.34 (below the HTF key level with 2 consecutive 4H candle closures)
Target:
TP: $3.71
💬 Like, follow, and comment if you find this setup valuable!
⚠️ Disclaimer: This content is for informational and educational purposes only and does not constitute financial, investment, or trading advice. Always do your own research before making any financial decisions.

VINE COMING BACK WITH NEW ROUND.. ----> $0,15 +Vine appears to be making a comeback, with $0.15 as a potential target if the trend confirms support in this zone. We will provide further updates as new time frames develop
We follow to see if it's able to get confirmed.

XLM: Hidden Accumulation Before a Violent Breakout?Yello, Paradisers do you see what’s happening on Stellar right now? While most eyes are turned away, XLM has been quietly carving a base inside a major demand zone, and the setup looks like it could fuel a massive move soon.
💎After weeks of pressure inside a descending channel, #XLMUSDT finally broke out, confirming that sellers are losing strength. For the last several days, XLM has been consolidating right above demand at $0.34–$0.35, holding firm despite repeated retests. This zone remains the line in the sand: as long as it’s defended, buyers keep the upper hand.
💎The breakout area around $0.37 is crucial now. A sustained close above it can trigger momentum toward the $0.42 minor resistance, and eventually even $0.48 where strong supply waits. On the flip side, failure to hold the demand zone could open the door for a deeper flush down into the invalidation area near $0.28, a level that would completely shift the outlook back to bearish.
💎Momentum indicators are already hinting at early accumulation, with signs of buyers stepping in at each retest of support. If this continues, #XLM could deliver a sharp vertical move that catches most of the market unprepared.
🎖Strive for consistency, not quick profits. Treat the market as a businessman, not as a gambler.
MyCryptoParadise
iFeel the success🌴
