Alt Coin SeasonAlt season has not started yet. Probably it is about to start.
The red lines mark important 2021 support levels for BTC dominance (Blue line).
Purple line is the alt coin dominance.
Black line is the BTC price in USD.
It would be easy to jump to the conclusion that ALT coin season is starting, upon this chart, because the critical support level on BTC Dominance, from 2021, has been broken. Nevertheless a warning:
Warning: Alt coin season truly depends on BTC price going up. If BTC price drops marking the end of the cycle, so it is for Alt coins too. It would be over. Therefore, one must keep a careful eye on BTC/USD price action, to ensure not to fall into a bull trap!
FED cut rates impact: I expect Sept. 17th, to be bearish on the FED cutting rates, for a short time. This would be a "Buy the rumors, sell the news" type of event. I think, but I may be wrong of course.
However, in the middle term (Oct-December) it wold mark the last bull run of this cycle, for everyone, alts and BTC, hopefully.
Disclaimer: this is not a financial advice. Do your own research. I own several cryptocurrencies and this idea and plot represents only my mere opinion. I hold no responsibilities for misinterpretations from this material.
Cryptocurrencies

Can LITECOIN copy ZEC's enormous rally?Zcash (ZECUSD) marginally broke its May 10 2021 Cycle Top (orange trend-line) this week, rising by more than +800% in just 2 months.
Throughout its trading history, it has been tightly correlated with Litecoin (LTCUSD). It's not uncommon to see ZEC lead the way and then LTC (purple) follow. As this chart shows, whenever the two diverged, the one always caught up with the other and converged again.
Does this mean that LTC will eventually catch up to this enormous rally? If it does indeed, the Top of the previous Cycle that it 'has to' fill is at $415.
-------------------------------------------------------------------------------
** Please LIKE 👍, FOLLOW ✅, SHARE 🙌 and COMMENT ✍ if you enjoy this idea! Also share your ideas and charts in the comments section below! This is best way to keep it relevant, support us, keep the content here free and allow the idea to reach as many people as possible. **
-------------------------------------------------------------------------------
💸💸💸💸💸💸
👇 👇 👇 👇 👇 👇

BITCOIN This is what separates 128k from 104k.Bitcoin (BTCUSD) just broke above its 1D MA50 (blue trend-line) for the first time in 2 weeks and only days after it got rejected there. A 1D candle closing above it will be a strong bullish signal.
As BTC has been trading within a Megaphone pattern similar to the December 2024 - April 2025 one, a closing above the 1D MA50 might put the structure in a similar situation as April 17. As you can see that Megaphone also had a 1D MA50 rejection preceding the break-out and before that also, two Lower Lows near the 1W MA0 (red trend-line).
What it hasn't had (so far?) is a clear touch of the 1W MA50 (as on April 07) and a 1D MACD Higher Lows Bullish Divergence.
As a result, both scenarios are open for now. Until it closes above the 1D MA50, a 1W MA50 test remains possible around $104000. A closing above the 1D MA50 though strengthens the probability of a 1.1 Fibonacci extension rally at $128000.
What do you think is more likely to happen? Feel free to let us know in the comments section below!
-------------------------------------------------------------------------------
** Please LIKE 👍, FOLLOW ✅, SHARE 🙌 and COMMENT ✍ if you enjoy this idea! Also share your ideas and charts in the comments section below! This is best way to keep it relevant, support us, keep the content here free and allow the idea to reach as many people as possible. **
-------------------------------------------------------------------------------
💸💸💸💸💸💸
👇 👇 👇 👇 👇 👇

FETUSD Will it continue on its historic bullish pattern?Artificial Superintelligence Alliance (FETUSD) has been trading within a 6.5-year Channel Up ever since its first trading day. The pattern's Bullish and Bearish Legs are very distinct and since its March 25 2024 All Time High (ATH), the market has been on the latest Bearish Leg (red Channel).
The 1W RSI just touched its 30.00 oversold barrier and last time it did so on a Bearish Leg (June 13 2022), the bottoming process (Higher Low) started towards the 0.236 Fibonacci level of the multi-year Channel Up.
As a result, FET may start its new Bullish Leg, as long as the overall market remains on a Bull Cycle. The short-term Target is the 1W MA50 (blue trend-line), with which contact can be made around $0.62000. Long-term (again if the Bull Cycle extends) we could see another +6430% Bullish Leg to $8.000.
-------------------------------------------------------------------------------
** Please LIKE 👍, FOLLOW ✅, SHARE 🙌 and COMMENT ✍ if you enjoy this idea! Also share your ideas and charts in the comments section below! This is best way to keep it relevant, support us, keep the content here free and allow the idea to reach as many people as possible. **
-------------------------------------------------------------------------------
💸💸💸💸💸💸
👇 👇 👇 👇 👇 👇

BITCOIN and the 'myth' behind following the Global SupplyA lot of talk is being thrown around lately regarding the M2 Global Supply (black trend-line) and how Bitcoin (BTCUSD) will follow it upwards as it explodes. Those claims have intensified especially in the past 2 weeks as an argument to support BTC's recovery following the decline from its $126k Top.
However, history shows that the two don't have to be correlated. In fact, during the past two Cycles, BTC topped at least 105 days (15 weeks) before the Global M2 did. Especially during the previous Cycle (2021), BTC has broken well below its 1W MA50 (blue trend-line) and stayed under up until the M2 peaked also. Note that the 1W MA50 is what has (so far) supported BTC's current correction.
As a result, no hopes of recovery can be rest upon a currently rising Global Liquidity. And if BTC's Cycle Top was 2 weeks ago, the Global Liquidity might peak 15 weeks from that, around January 19 2026 (possibly around the time the stock market peaks too).
But what do you think? Do you think Bitcoin will catch up to the rising M2 Global Supply or will continue its decline into a new Bear Cycle as it has historically happened? Feel free to let us know in the comments section below!
-------------------------------------------------------------------------------
** Please LIKE 👍, FOLLOW ✅, SHARE 🙌 and COMMENT ✍ if you enjoy this idea! Also share your ideas and charts in the comments section below! This is best way to keep it relevant, support us, keep the content here free and allow the idea to reach as many people as possible. **
-------------------------------------------------------------------------------
💸💸💸💸💸💸
👇 👇 👇 👇 👇 👇

DOGE Can it give one more rally?Dogecoin (DOGEUSD) has been trading within a Channel Up pattern since March 02 that only broke momentarily to the downside during the October 10 2025 flash crash. Immediately the price recovered and has since been consolidating on the 1W MA100 (red trend-line).
The 1W MA100 has price both previous Higher Lows bottoms of the pattern, with both Bearish Legs incredibly declining by the same extent -45.90%. This amazing degree of symmetry is also seen on the pattern's Bullish Legs, with both also registering identical rises of +101.96%, pricing their Higher Highs on their respective 1.136 Fibonacci extensions.
As a result, as long as DOGE keeps closing its 1W candles above the 1W MA100, we have strong reasons to expect another +101.96% Bullish Leg targeting 0.33000 (also the 1.136 Fibonacci extension).
It is also worth noting that the 1D RSI has been on a Higher Lows Bullish Divergence (against the price's Lower Lows), similar to the first bottom of the Channel Up in early April.
-------------------------------------------------------------------------------
** Please LIKE 👍, FOLLOW ✅, SHARE 🙌 and COMMENT ✍ if you enjoy this idea! Also share your ideas and charts in the comments section below! This is best way to keep it relevant, support us, keep the content here free and allow the idea to reach as many people as possible. **
-------------------------------------------------------------------------------
💸💸💸💸💸💸
👇 👇 👇 👇 👇 👇

TRON on its absolute Bull Cycle Support. Can it hold?Tron (TRXUSD) is on its 3rd straight week trading on the 1W MA20 (red trend-line). In fact that level has held and closed both previous 1W candles above it, despite getting breached marginally.
The current Bull Cycle since the November 2022 bottom, has been dominated entirely by a Channel Up, that only broke once on the December 2024 massive spike. Besides that, it has been using the 1W MA20 as its pull-back and buy signal. The zone it has created along with the 1W MA50 (blue trend-line) has been the ultimate Buy Zone of this pattern.
As a result, this is technically a strong Buy Signal for TRX, most likely targeting 0.47000, representing a +60.48% rise, which has been the minimum Bullish Leg rise within this Channel Up.
If however it breaks below its 1W MA50, we will have the strongest confirmation that the new Bear Cycle has technically begun, and the first Target would be 0.16000, potentially going for a contact with its 1W MA200 (orange trend-line).
-------------------------------------------------------------------------------
** Please LIKE 👍, FOLLOW ✅, SHARE 🙌 and COMMENT ✍ if you enjoy this idea! Also share your ideas and charts in the comments section below! This is best way to keep it relevant, support us, keep the content here free and allow the idea to reach as many people as possible. **
-------------------------------------------------------------------------------
💸💸💸💸💸💸
👇 👇 👇 👇 👇 👇

BITCOIN The NIGHTMARE chart you don't want to see right nowBitcoin (BTCUSD) is on the verge of establishing an LMACD Bearish Cross on the 1M time-frame, which for better reliability needs to close the current 1M candle (October) to confirm it.
** The nightmare LMACD Bearish Cross **
As the title says, this is a 'nightmare' development for the market, certainly not something that the majority of investors want to see right now, as this Bearish Cross has had disastrous effects every time it took place at the end of the 4-year Cycle.
First of all, let's not allow being overlooked the fact that the 1M LMACD is also reversing right before a test of its multi-year Lower Highs trend-line. That line priced all previous Cycle Tops.
** Is this a Cycle Top? Best-worst case scenarios**
Back to he Bearish Cross, it has always been formed around Cycle Tops as well. More specifically, the one that was formed after January 2014, was already on the 3rd month after the Cycle Top. The one that was formed after February 2018, was on the 4th month of the Bear Cycle. More recently, the one that was formed on August 2021 was 3 months before the Cycle Top. Interestingly enough, that was a peculiar Cycle with an (almost) Double Top, which was no surprise that the LMACD got rejected on its Lower Highs trend-line much earlier on the April 2021 Top.
As a result, the best case scenario based on this model for BTC is to have another 3 months of Bull, especially if it gets aided by favorable news (Trade deal, rate cuts, adoption). The more likely however historically, especially if October closes in red in 10 days, is that Bitcoin has entered a new Bear Cycle and this MACD Bearish Cross comes to confirm it.
** How low can it go?? **
What's even worse is that, if we've already seen the Top, the market tends to decline on average by more than -80% historically, with the last Bear Cycle suffering losses of almost -78% (the softest Cycle of all). It was also the only one that closed a month (numerous 1M candles actually) below the 1M MA50 (blue trend-line) unlike the first two, which used that as a Support/ Cycle Bottom. As a result, the best case scenario if a new Bear Cycle has already started is to place a bottom on its 1M MA50 around $60000 - 65000 and the worst to decline by -78% around $30000 (or a little worse).
Again, not the kind of technical analysis most want to be seeing right now..
** The positive look **
For conclusion, we should always keep in mind that the fundamental scenery/ environment changes with every Cycle in a more favorable way, e.g this Cycle we had much stronger institutional adoption, even national treasuries and more importantly we saw the introduction of the Bitcoin ETF by Blackrock which was a game changer in capital inflows. You don't see often such investment bank giants 'allowing' one of their products to tank by -80%.
But what do you think? Are we already in a Bear Cycle or there are some more months left in the Bull's tank? Feel free to let us know in the comments section below!
-------------------------------------------------------------------------------
** Please LIKE 👍, FOLLOW ✅, SHARE 🙌 and COMMENT ✍ if you enjoy this idea! Also share your ideas and charts in the comments section below! This is best way to keep it relevant, support us, keep the content here free and allow the idea to reach as many people as possible. **
-------------------------------------------------------------------------------
💸💸💸💸💸💸
👇 👇 👇 👇 👇 👇

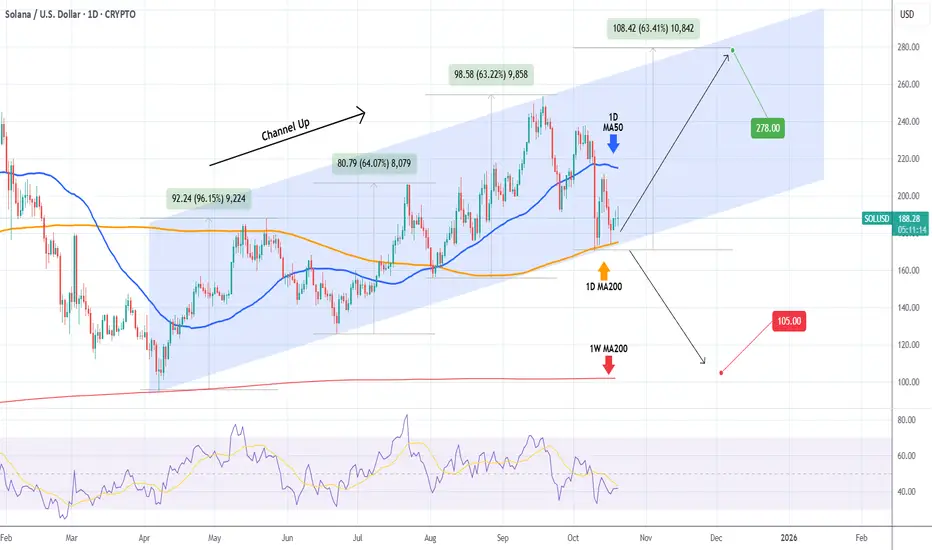
SOLANA 1D MA200 is the only level holding it from falling apart.Solana (SOLUSD) has been trading within a very structured Channel Up pattern since the April 07 bottom, which was priced exactly on its 1W MA200 (red trend-line). The recent pull-back though (Bearish Leg) has got the market testing another key Support level, the 1D MA200 (orange trend-line).
So far this has held on 4 successive tests, technically pricing a new Higher Low on the bottom of the Channel Up. This is what separates the start of the new Bullish Leg towards at least $278.00 (representing a +63.00% rise, the minimum rally so far inside this pattern) from a complete collapse to $105.00 and the 1W MA200. SOL needs to keep closing its 1D candles above the 1D MA200 to maintain the bullish trend.
-------------------------------------------------------------------------------
** Please LIKE 👍, FOLLOW ✅, SHARE 🙌 and COMMENT ✍ if you enjoy this idea! Also share your ideas and charts in the comments section below! This is best way to keep it relevant, support us, keep the content here free and allow the idea to reach as many people as possible. **
-------------------------------------------------------------------------------
💸💸💸💸💸💸
👇 👇 👇 👇 👇 👇
BITCOIN Did the 1W MA50 save the Cycle again??Bitcoin (BTCUSD) has now completed two straight weeks since the Friday 10 flash-crash of almost touching the 1W MA50 (blue trend-line) but managing to hold it and rebound. This is not the first time we see this pattern during this Cycle. In fact it is a frequent one that systemically fuels the 3-year Channel Up of this Bull Cycle.
As you can see, ever since the November 21 2022 bottom of the previous Bear Cycle, the current Bull Cycle has been trading within this Channel Up pattern, which after it broke above the 1W MA50 and in March 2023, turned it into its long-term Support.
More specifically, since that day, every time BTC broke and closed a weekly candle below its 1W MA20 (red trend-line), it dropped further to its 1W MA50 to find Support, priced the Channel Up Higher Low and rebounded.
This has happened so far 3 times (excluding now), in September 2023 it almost touched the 1W MA50 and rebounded but in August 05 2024 and April 07 2025, it marginally breached it and then rebounded. Based on this, BTC is currently at or very close to the new Higher Low (Support), hence a buy opportunity.
The only condition that hasn't been fulfilled, is the 1W RSI entering its 2-year Support Zone. If the 1W MA50 indeed holds and manages to keep closing the 1W candles above it, that would be an indication that the Bull Cycle is still in effect. The minimum rally a pull-back has given throughout the Cycle has been +92.44%, so as long as it holds, there are strong probabilities that BTC may reach a least $143000.
Do you share that model's optimism or you think the new Bear Cycle has already started? Feel free to let us know in the comments section below!
-------------------------------------------------------------------------------
** Please LIKE 👍, FOLLOW ✅, SHARE 🙌 and COMMENT ✍ if you enjoy this idea! Also share your ideas and charts in the comments section below! This is best way to keep it relevant, support us, keep the content here free and allow the idea to reach as many people as possible. **
-------------------------------------------------------------------------------
💸💸💸💸💸💸
👇 👇 👇 👇 👇 👇

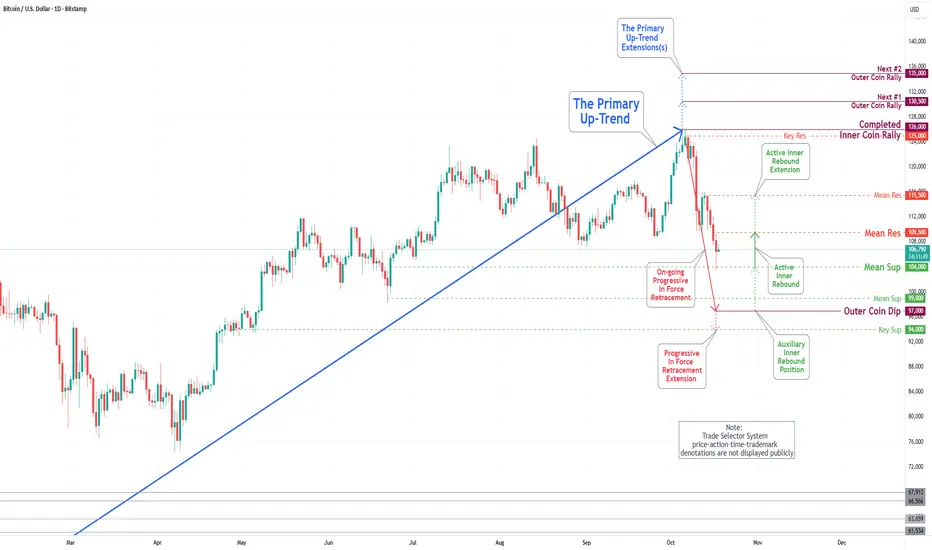
Bitcoin(BTC/USD) Daily Chart Analysis For Week of Oct 17, 2025Technical Analysis and Outlook:
In the most recent trading session, the Bitcoin market experienced a significant decline, falling below critical support levels of 108000 and 105700, as the price is currently actively fluctuating between these two points.
The current market analysis indicates an initial potential rebound towards the Mean Resistance level of 109500, with further extension possibilities up to the Mean Resistance level of 115500. It is essential to recognize and be aware that an Auxiliary Inner Rebound occurrence following the Outer Coin Dip, marked as a 97000, in conjunction with the Mean Support level of 99000. This scenario is particularly significant at the Progressive In-Force retracement extension, identified as the Key Support level of 94000.
XRPUSD Bearish Cross pushing it down to $1.9350 t least.XRP (XRPUSD) has been trading within a Channel Up for almost 1 year (since November 26 2024) and just before last Friday's flash crash, it formed a 1D MA50/100 Bearish Cross. This came after the pattern has already started its 2nd Bearish Leg (red Channel).
The last 1D MA50/100 Bearish Cross was formed post half-way through the previous Bearish Leg and resulted into a bottom just below the 0.786 Fibonacci retracement level. Since there are no news in the market that can drastically alter the bearish sentiment following the renewed U.S. - China trade tensions, we have no reason to expect that the current Bearish Leg won't reach again the bottom of the Channel Up at least.
Our Target is therefore 1.9350 (marginally below the 0.786 Fib). If the Bearish Leg repeats the % drop of the previous one (-52.42%), it can even break to 1.7500 (still within the Channel Up on a logarithmic scale). A break above the 1D MA100 (green trend-line) would invalidate this bearish structure.
-------------------------------------------------------------------------------
** Please LIKE 👍, FOLLOW ✅, SHARE 🙌 and COMMENT ✍ if you enjoy this idea! Also share your ideas and charts in the comments section below! This is best way to keep it relevant, support us, keep the content here free and allow the idea to reach as many people as possible. **
-------------------------------------------------------------------------------
💸💸💸💸💸💸
👇 👇 👇 👇 👇 👇

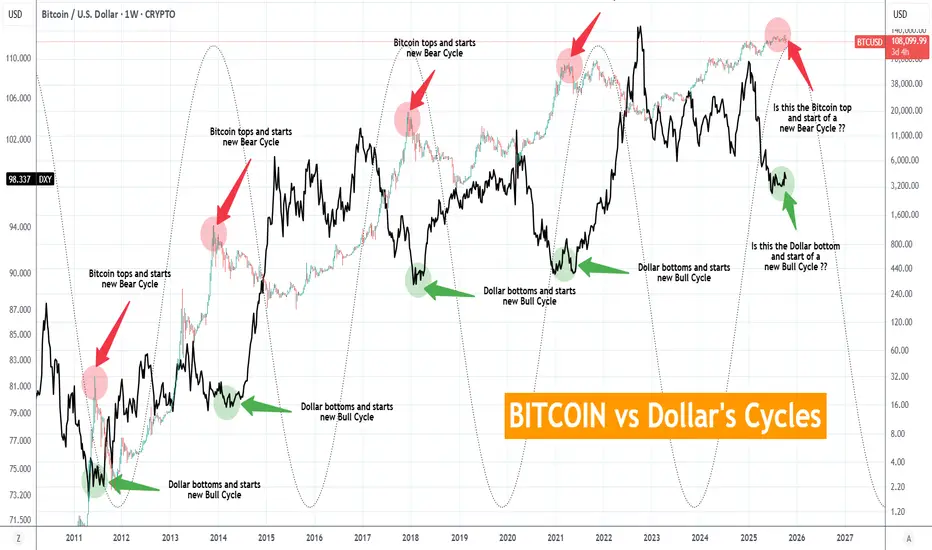
BITCOIN vs Dollar's Cycles. Has the new BTC Bear Cycle started?This is as simple as it can get. And obviously, it is not the first time we give you this chart. This is a cross-asset comparison between Bitcoin (BTCUSD) and the U.S. Dollar Index (DXY) illustrated by the black trend-line. It represents the Cycles of the two assets, typically negatively correlated across the span of 15 years.
As you can see, when the USD bottoms and starts a new Bull Cycle, BTC tops and starts a new Bear Cycle. Similarly vice versa with USD's Bull Cycle tops against BTC's Bear Cycle bottoms.
So the million dollar question is whether the USD has bottomed again. Based on the 4-year Cycle Model and as the Sine Waves illustrate on this chart, it may have. It is no surprise that while the DXY has formed Higher Lows since July 07, BTC has topped and turned sideways on ranged trading with a new Low made on last Friday's crash.
It is not necessary for the USD to break upwards aggressively in order for BTC to start dropping aggressively into its new Bear Cycle. As Jan - March 2018, Jan - March 2013 and May - August 2011 have shown, the USD may range sideways, as long as it is a clear sign of bottom formation, while Bitcoin is already into its Bear Cycle.
So the conclusion is that as long as the USD keeps trading sideways without making a new Low, it is quite like for Bitcoin to be entering its new Bear Cycle. Sound planning, calculated profit taking and gradual (to say the least) de-risking may be required.
So do you think Bitcoin's new Bear Cycle has started? Feel free to let us know in the comments section below!
-------------------------------------------------------------------------------
** Please LIKE 👍, FOLLOW ✅, SHARE 🙌 and COMMENT ✍ if you enjoy this idea! Also share your ideas and charts in the comments section below! This is best way to keep it relevant, support us, keep the content here free and allow the idea to reach as many people as possible. **
-------------------------------------------------------------------------------
💸💸💸💸💸💸
👇 👇 👇 👇 👇 👇
Bitcoin WeeklyTarget is 54k
May reverse in the 54-64k zone to fill the gap left at 20k.
Bullish if we can break the double top formation,
Target is 80k-120k
Expected to hit 54k with in the next 6 weeks.

ETHEREUM Only the 1D MA50 can save the day.Ethereum (ETHUSD) marginally broke its 1W MA20 (red trend-line) on last Friday's flash crash and rebounded. The bullish continuation wasn't enough however to break above its 1D MA50 (blue trend-line) and so far it's been rejected.
This is the exact same reaction it had the last time it hit its 1W MA20 (June 22), technically the previous Higher Low of the Fibonacci Channel Up. Both crashes have been around -27%. It took the market some days of consolidation below the 1D MA50 but when it finally broke it, the new Bullish Leg was confirmed.
With a 1D RSI Bullish Divergence already under ETH's belt (Higher Lows against the price's Lower Lows), the market looks like it has bottomed but this can only be validated by a 1D MA50 break-out. The next Bullish Leg can lead ETH to a least $7150 (+108.31% rise similar to the first Bullish Leg).
A break and candle closing below the 1W MA20 however, opens the way to further decline towards the 1W MA100 (green trend-line, the natural long-term Support of the Bull Cycle) around $3050.
-------------------------------------------------------------------------------
** Please LIKE 👍, FOLLOW ✅, SHARE 🙌 and COMMENT ✍ if you enjoy this idea! Also share your ideas and charts in the comments section below! This is best way to keep it relevant, support us, keep the content here free and allow the idea to reach as many people as possible. **
-------------------------------------------------------------------------------
💸💸💸💸💸💸
👇 👇 👇 👇 👇 👇

DOTUSD Can this Channel save it from complete obsolescence?Polkadot (DOTUSD) has been trading within a Channel Down since the December 26 2022 Low and it only broke momentarily during last Friday's flash crash. Having recovered instantly above it and closing the 1W candle inside the pattern, it technically counts as a Lower Low.
The last two Lower Lows (both inside 2025), delivered rebound that hit tested the 1W MA50 (blue trend-line). As a result, the obvious technical Target on the medium-term is the 1W MA50 and our (a but more conservative) estimation is $4.600, which is right on the 0.382 Fibonacci Channel level. Of course that's assuming the market doesn't close any 1W candles below the Channel Down. The current price levels offer an excellent Risk/ Reward ratio on this.
If the 1W MA50 breaks, we can see an even more aggressive extension towards the top (Lower Highs trend-line) of the Channel Down. The best indicator for a Sell Signal in that scenario is the 1W RSI Resistance Zone. It has priced the last three major Highs since 2023. Naturally the 1W MA200 (orange trend-line) is the obvious long-term Resistance and potential Target in that scenario but can go even as high as 9.5000 if we repeat the previous +225.10% Bullish Leg.
-------------------------------------------------------------------------------
** Please LIKE 👍, FOLLOW ✅, SHARE 🙌 and COMMENT ✍ if you enjoy this idea! Also share your ideas and charts in the comments section below! This is best way to keep it relevant, support us, keep the content here free and allow the idea to reach as many people as possible. **
-------------------------------------------------------------------------------
💸💸💸💸💸💸
👇 👇 👇 👇 👇 👇

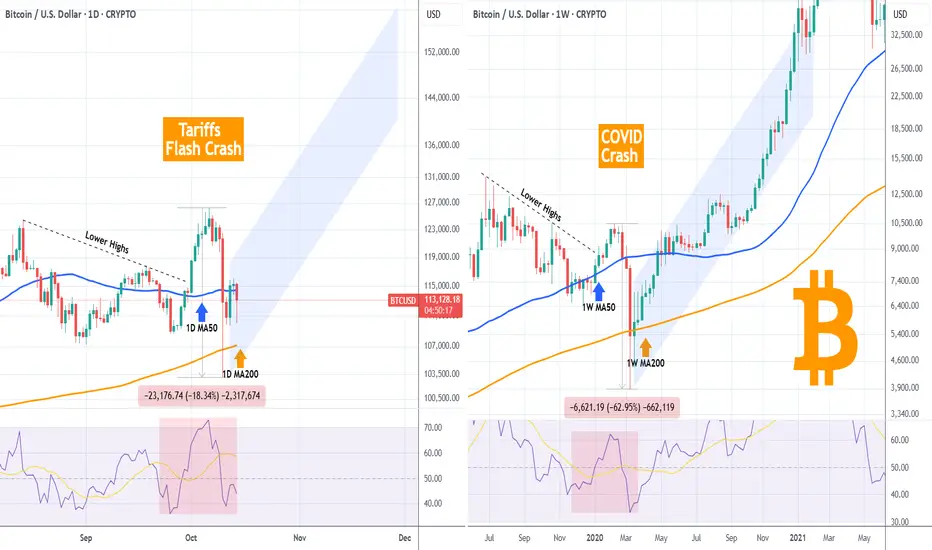
BITCOIN Is last Friday's flash crash similar to COVID's?Bitcoin (BTCUSD) made a strong flash crash last Friday following President Trump's tariff threats to China. That brought back memories of the March 2020 COVID crash. But are those that similar??
Quick answer: strength/ aggression wise no. Last Friday's crash marked 'just' a -18.34% decline from its top on a week basis. COVID's crash, which was longer admittedly, pulled the price down by -62.95% from February's 2020 High. Massive difference in market psychology and dynamics (even though we may have not seen the last of the current Tariff Crash). And that is the reason one chart is on the 1D time-frame and the other on the 1W time-frame.
However this is the exact reason that they look so similar in technical structure. As you can see both started on a Lower Highs downtrend, which broke to the upside that led to the eventual crash that broke below both the MA50 and MA200 (blue and orange trend-lines respectively). Even their RSI structures are similar.
The COVID crash taught us that as long as the MA200 closed the candles above it, a massive rally was sustained to new Highs. If the same structure is followed on the current fractal, we may see BTC rising by as high as $150k.
So what do you think? Do those two crashes share similarities that can justify a market recovery now? Feel free to let us know in the comments section below!
-------------------------------------------------------------------------------
** Please LIKE 👍, FOLLOW ✅, SHARE 🙌 and COMMENT ✍ if you enjoy this idea! Also share your ideas and charts in the comments section below! This is best way to keep it relevant, support us, keep the content here free and allow the idea to reach as many people as possible. **
-------------------------------------------------------------------------------
💸💸💸💸💸💸
👇 👇 👇 👇 👇 👇
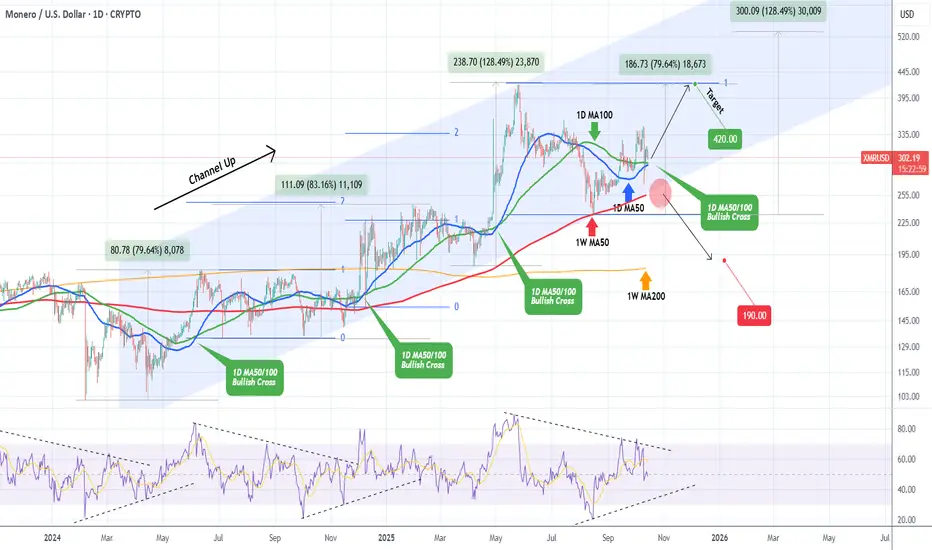
XMRUSD Can this Channel Up hold and push it higher?Monero (XMRUSD) has been trading within a Channel Up since the February 06 2024 Low and last Friday's flash crash almost tested its bottom (Higher Lows trend-line).
The last time this got hit was on the August 16 2025 Low, which also touched the 1W MA50 (red trend-line), the market's natural Support since November 27 2024. As long as this level holds, the Channel Up will remain intact and should technically push for a new Higher High.
Ahead of a 1D MA50/100 Bullish Cross formation (possibly even today), we can assume that XMR will go for at least a +79.64% rally from the recent Low, which has been the 'weakest' Bullish Leg within this pattern.
That gives us a $420 Target that would match the May 26 2025 High. Technically the Bullish Leg can also complete a +128.49% rise (strongest Bullish Leg of the pattern), even go as high as the 2.0 Fibonacci extension, again as long as the 1W MA50 holds.
If it fails to support though, be ready for a potential 1W MA200 (orange trend-line) test around $190.00.
-------------------------------------------------------------------------------
** Please LIKE 👍, FOLLOW ✅, SHARE 🙌 and COMMENT ✍ if you enjoy this idea! Also share your ideas and charts in the comments section below! This is best way to keep it relevant, support us, keep the content here free and allow the idea to reach as many people as possible. **
-------------------------------------------------------------------------------
💸💸💸💸💸💸
👇 👇 👇 👇 👇 👇
ETHUSDT is coming!!!ETH looks ready for a bullish move — I’m seeing a clear 3-wave pattern forming, each wave getting bigger. Momentum’s building up nicely 👀🚀

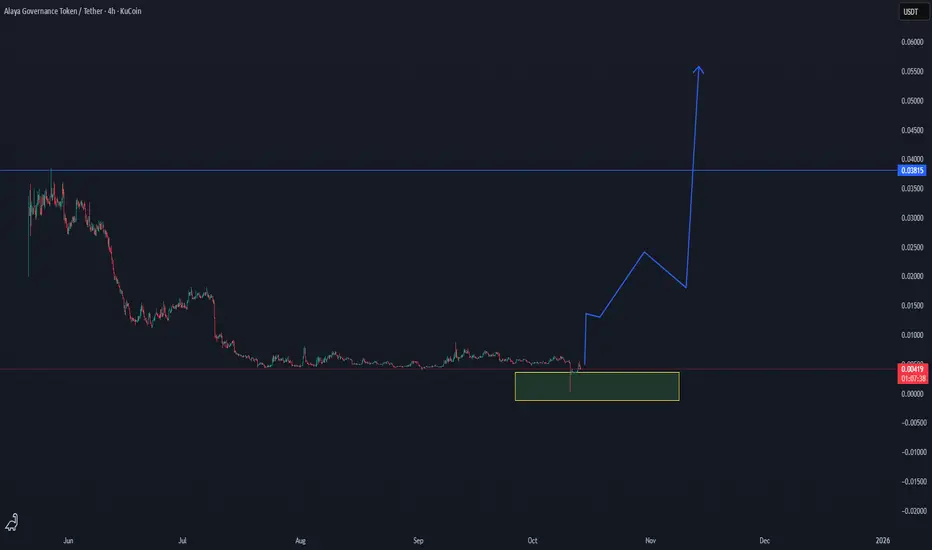
AGT/USDT — Breakout Formation from Accumulation Zone ImminentAGT/USDT — Breakout Formation from Accumulation Zone Imminent 🚀
AGT has entered a strong accumulation zone after a prolonged downtrend, showing the first technical signs of a potential trend reversal. The current consolidation within the highlighted support block suggests that buyers are stepping in, preparing for a possible breakout phase.
Low time frame confirmation is here
📊 Current Price: $0.0042
🟢 Accumulation Zone: $0.0038 – $0.0045
🔹 Breakout Target: $0.038
The chart shows a typical bottoming structure, with a long accumulation base forming under historical resistance. Once AGT confirms a breakout above $0.006, momentum could accelerate rapidly — targeting the $0.02 → $0.038 zones.
This setup mirrors classic early-cycle patterns seen before major upward expansions in similar low-cap assets. A strong breakout candle with volume will serve as confirmation of the next phase.
📈 Technical Outlook:
Accumulation structure in place
Breakout trigger above $0.006–$0.007
Main breakout target around $0.038
Summary:
AGT/USDT is building strength at the bottom of its range. If volume confirms, a major reversal cycle could be underway, opening the path toward a breakout to $0.038 and beyond.
🎯 Targets: $0.02 → $0.038
📊 Bias: Bullish — Breakout Setup Forming
BITCOIN Short squeeze in action with 1W MA50 saving the day?Bitcoin (BTCUSD) is rebounding rather as aggressively as it flash crashed on Friday following President Trump's threats on new China tariffs. We've seen the outcome of such Trade War threats back in February - April. In fact that was the last time (April 09 2025) that BTC hit its 1W MA50 (red trend-line). Following that, an enormous long-term rally followed that made new All Time Highs (ATH).
Friday was the first time since then that the price almost touched the 1W MA50, while breaking through the 1D MA200 (orange trend-line) for the first time since April 22. Friday's Low is so far technically a Higher Low on the 1-year Rising Wedge pattern.
The more U.S. and China seem to agree on a new truce and not move forward to escalate threats into actions, the stronger the current short squeeze will be in the market and the current rally will most likely target the top (Higher Highs trend-line) of the Rising Wedge on the key psychological level of $130000.
If however it appears that agreements fall through and the bottom (Higher Lows trend-line) of the Rising Wedge breaks, we expect a deeper and potentially more aggressive fall to he 1W MA100 (green trend-line) around $85000. It also has to be mentioned that Friday's Low hit the 1D RSI 4-month Support Zone and rebounded.
Which scenario do you think is more likely to happen? Feel free to let us know in the comments section below!
-------------------------------------------------------------------------------
** Please LIKE 👍, FOLLOW ✅, SHARE 🙌 and COMMENT ✍ if you enjoy this idea! Also share your ideas and charts in the comments section below! This is best way to keep it relevant, support us, keep the content here free and allow the idea to reach as many people as possible. **
-------------------------------------------------------------------------------
💸💸💸💸💸💸
👇 👇 👇 👇 👇 👇

BITCOIN Are you worried about this?Bitcoin (BTCUSD) is pulling back aggressively today following Trump's China-tariffs related news and this weekly rejection is far from ideal technically as well.
In recent years it's been unusual to look at the market on anything but a logarithmic scale, which is natural as it offers a fair representation of BTC's remarkable gains and parabolic Cycles.
On today's analysis however we present the long-term price action on the 1W time-frame without being on the log scale. And as you can see what stands out is a Higher Highs trend-line that dates back to the December 11 2017 Cycle Top, almost 8 years ago.
This trend-line is anything but comforting at the moment as it has caused numerous rejections with the strongest being the April 12 2021 High. More recently it has formed the July 14 2025 High, the August 11 2025 High, last week's (September 29 2025) High and so far the current one (October 06 2025).
This is far from ideal and it gets worse seeing that since the March 04 2024 High, the 1W RSI has been under Lower Highs, which is of course a Bearish Divergence against the markets Higher Highs, similar to the Lower Highs of the previous Cycle that formed the November 08 2021 Top.
This time is indeed a little different though as the RSI's current 3rd Lower High is still a Higher High for BTC while on the previous Cycle it was (March 21 2022) already a Lower High for the price as well inside a Bear Cycle that has already started.
Still, do you believe this 8-year Higher Highs trend-line rejection is alarming or not? Feel free to let us know in the comments section below!
-------------------------------------------------------------------------------
** Please LIKE 👍, FOLLOW ✅, SHARE 🙌 and COMMENT ✍ if you enjoy this idea! Also share your ideas and charts in the comments section below! This is best way to keep it relevant, support us, keep the content here free and allow the idea to reach as many people as possible. **
-------------------------------------------------------------------------------
💸💸💸💸💸💸
👇 👇 👇 👇 👇 👇

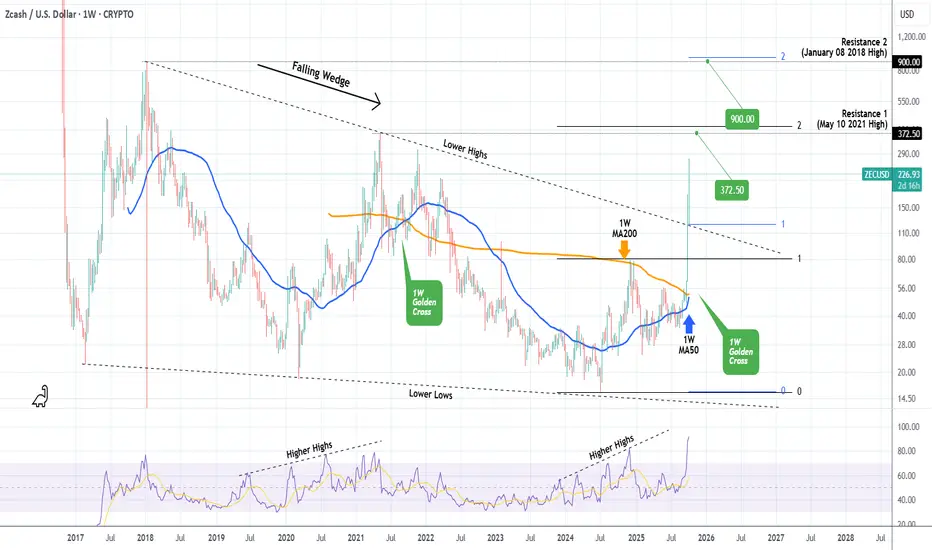
ZCASH Eyes $372.50 but might surprise us with an even higher TopZcash (ZECUSD) has been essentially trading within a multi-year Falling Wedge since the February 20 2017 Low, which effectively broke last week. This week continued equally impressively with the price currently at $239, having increased by almost +1000% since the February 2025 Low.
This Falling Wedge bullish break-out it technically targeting the 2.0 Fibonacci extension from the December 02 202 High. This falls marginally above the $372.50 Resistance (1), which is the May 10 2021 High of the previous Cycle. We expect this to get hit soon and most likely price the Top of the current Bull Cycle.
However, there is an optimistic scenario, which may push the Cycle Top to Resistance 2 (January 08 2018 High, the top of the first Cycle) at $900, which is the 2.0 Fibonacci extension (blue levels) from the Falling Wedge's break-out point. But that is assuming ZEC closes a full 1W candle above Resistance 1.
-------------------------------------------------------------------------------
** Please LIKE 👍, FOLLOW ✅, SHARE 🙌 and COMMENT ✍ if you enjoy this idea! Also share your ideas and charts in the comments section below! This is best way to keep it relevant, support us, keep the content here free and allow the idea to reach as many people as possible. **
-------------------------------------------------------------------------------
💸💸💸💸💸💸
👇 👇 👇 👇 👇 👇