BITCOIN Drop back towards 100k or rise to $130k? What's next?Bitcoin (BTCUSD) is at critical crossroads as it is pulling back today towards its 1W MA20 (red trend-line). We've discussed before of the importance of this level as a technical Support that has fueled the final BTC rallies during past Cycles. As this held on August 25 and closed the candle above it, we expected that to be this confirmation.
Today's decline however jeopardizes this model, in fact the Parabola pattern of the current (2023-2025) Bull Cycle, has always been tested when Bitcoin closed below its 1W MA20. As you can see it has always declined and touched its 1W MA50 (blue trend-line) to form a Support and start the next Bullish Leg.
The 1W MA50 is currently just below the $100k level so an aggressive drop below the 1W MA20 (candle closing) can take us around that area in a matter of 2-3 weeks. If however the 1W MA20 holds, it is more likely to see a rise to $130000 at least. And that is what the Sine Waves Tops imply (red Rectangle peak formation, with a 1W MA50 test more likely to occur in late January 2026.
So what do you think? Is $100k or $130k next for Bitcoin? Feel free to let us know in the comments section below!
-------------------------------------------------------------------------------
** Please LIKE 👍, FOLLOW ✅, SHARE 🙌 and COMMENT ✍ if you enjoy this idea! Also share your ideas and charts in the comments section below! This is best way to keep it relevant, support us, keep the content here free and allow the idea to reach as many people as possible. **
-------------------------------------------------------------------------------
💸💸💸💸💸💸
👇 👇 👇 👇 👇 👇
Cryptocurrencies

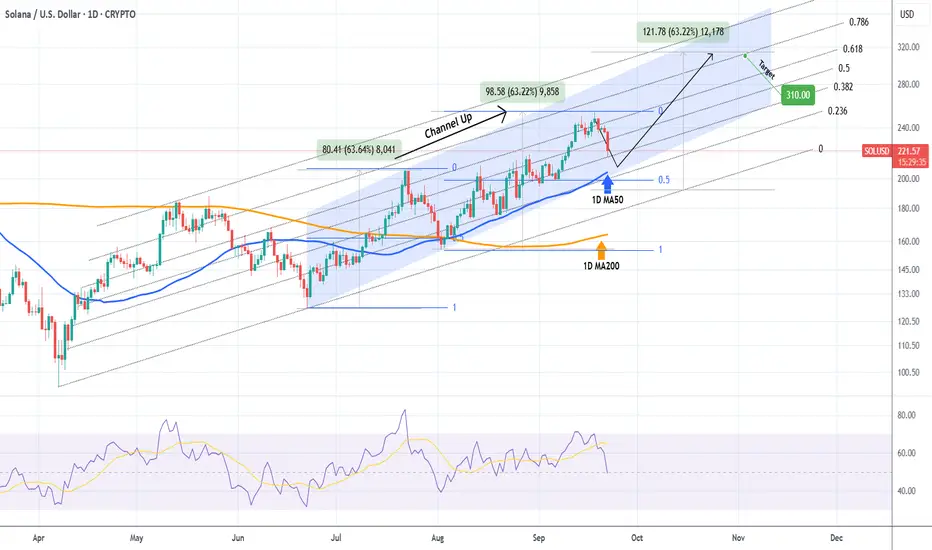
SOLANA Is a 1D MA50 pull-back needed for a $310 rally?Solana (SOLUSD) has been trading within a Channel Up since the June 22 Low, which goes even further back on a Fibonacci Channel Up started on the April 07 market bottom.
The price is pulling back at the moment, having completed a +63.22% Bullish Leg, same as the previous one that then pulled back to its 1D MA50 (blue trend-line) and 0.5 Fibonacci retracement level before starting the next Bullish Leg.
As a result, we expect the current correction so seek validation on the 1D MA50 at least and then rebound for a medium-term +63.22% rally, targeting $310 at least.
-------------------------------------------------------------------------------
** Please LIKE 👍, FOLLOW ✅, SHARE 🙌 and COMMENT ✍ if you enjoy this idea! Also share your ideas and charts in the comments section below! This is best way to keep it relevant, support us, keep the content here free and allow the idea to reach as many people as possible. **
-------------------------------------------------------------------------------
💸💸💸💸💸💸
👇 👇 👇 👇 👇 👇
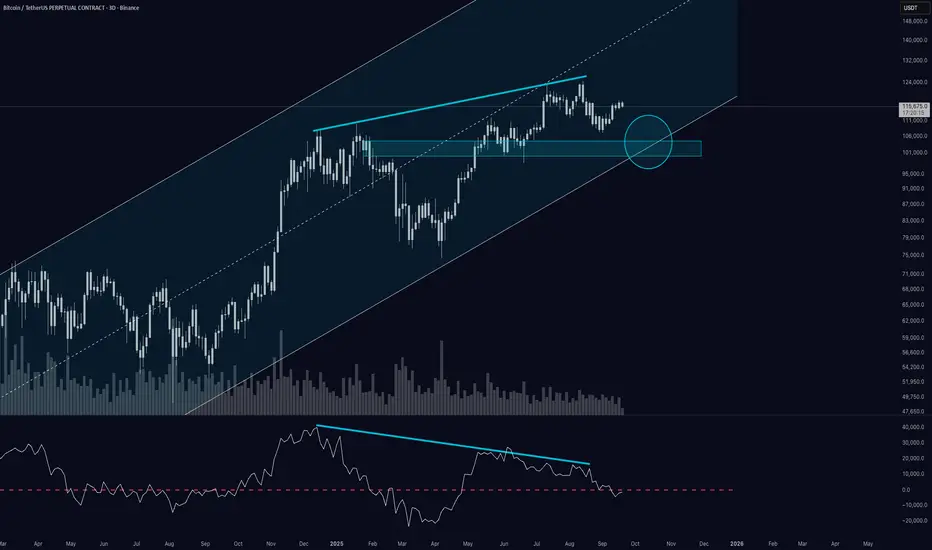
Is Bitcoin Losing Momentum?On the 3-day chart, Bitcoin continues to respect its long-term ascending channel, with both the upper and lower boundaries acting as clean structural guides.
🔹 Momentum: After months of strength, momentum has slipped below the 0-line and is currently retesting it – a key pivot that often defines whether trend continuation or correction follows.
🔹 Structure: The lower boundary of the channel lines up almost perfectly with the horizontal support zone built from previous highs (around 100k–103k). This confluence makes it a natural candidate for a pullback area.
🔹 Volume: A noteworthy observation is the declining volume profile during the most recent leg higher – a potential early warning that participation is fading.
If the 100k–103k support area holds , the long-term uptrend remains intact.
But a decisive breakdown could open the door to a deeper correction.
👉 What do you think – is Bitcoin gearing up for another strong bounce off the channel, or are we on the edge of a deeper retracement?
Let’s discuss in the comments.
Disclaimer: This is a market observation, not financial advice.
BTC DATA UPDATEBTC/USDT Update
On the low time frame, BTC is still in a breakdown structure. Price is consolidating under pressure around the 115.7K zone.
Key levels to watch:
116K → first level where momentum could shift.
116.5K → confirmation level. A strong break and hold above 116.5K would confirm a new uptrend and open the way to higher levels.
Failure to confirm above 116.5K means risk remains for further downside continuation.
Critical support: 112.8K is an important cycle level BTC must hold to stay inside the green cycle.
If 112.8K breaks, probability increases for a deeper correction toward lower zones (110K–108K).
Until BTC closes and confirms above 116.5K, bias remains cautiously bearish/sideways.
📌 Summary
Below 116K → breakdown structure remains active.
Break & confirmation above 116.5K → bullish scenario opens.
112.8K → must-hold cycle support for the green cycle.

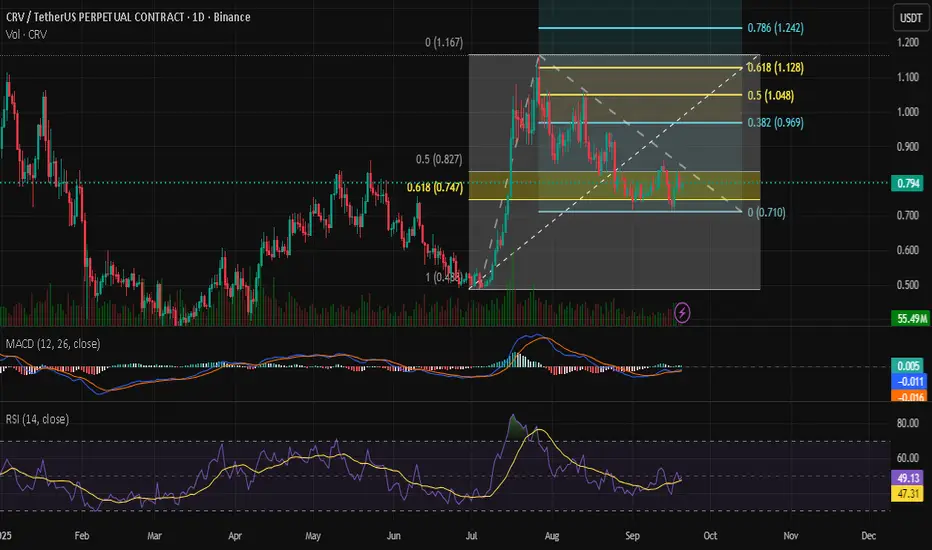
My Opinion on CRV cryptocurrenciesWith Fibonacci Extension, I found potential that the price have high possibility to go higher to price 1usdt. But this is just my opinion, this is not financial advice, PLEASE DO YOUR OWN RESEARCH
BITCOIN This is where the fat lady sings..Well this is o secret. We've pointed that out many times before but it couldn't be more relevant than now as Bitcoin (BTCUSD) is approaching the end of its 4-year Cycle.
So where does the 'fat lady sing'? According to the 1M RSI, at the top of its historic 15-year Channel Down. Which by the end of this year it should be above (the vastly oversold condition of) 90.00.
Is there enough time to left to do so? Feel free to let us know in the comments section below!
-------------------------------------------------------------------------------
** Please LIKE 👍, FOLLOW ✅, SHARE 🙌 and COMMENT ✍ if you enjoy this idea! Also share your ideas and charts in the comments section below! This is best way to keep it relevant, support us, keep the content here free and allow the idea to reach as many people as possible. **
-------------------------------------------------------------------------------
💸💸💸💸💸💸
👇 👇 👇 👇 👇 👇

BNBUSD Is it about to have the run of its life??Binance Coin (BNBUSD) made yet another All Time High (ATH) this week, extending the strong rally it's been having since June 23 2025. That was when it hit its 1W MA50 (blue trend-line) and rebounded as it confirmed it s a Support.
That was the very same action that BNB took during the accumulation phase (blue Channel Up) of its previous Cycle on August 31 2020. As you can see, even the 1W RSI sequences between the two fractals match and what happened then was a massive parabolic rally (green) 3 months later that peaked a little above the 2.618 Fibonacci extension level.
With BNB coming off the current accumulation phase rather aggressively, do you think the market can repeat such rally to the 2.618 Fib ext, which would place us a little over $5000? Conservative targets still have BNB's peak zone within $1600 - 2000.
-------------------------------------------------------------------------------
** Please LIKE 👍, FOLLOW ✅, SHARE 🙌 and COMMENT ✍ if you enjoy this idea! Also share your ideas and charts in the comments section below! This is best way to keep it relevant, support us, keep the content here free and allow the idea to reach as many people as possible. **
-------------------------------------------------------------------------------
💸💸💸💸💸💸
👇 👇 👇 👇 👇 👇

XRPUSD Is $5.00 next??XRP (XRPUSD) has been trading within a Channel Up since the April 07 'Trade War' market bottom and in the past 6 days it has been testing (and holding) the 1D MA50 (blue trend-line) as a Support.
Given that this is being done after the Bearish Leg bottomed (green Arc pattern) on the 1D MA100 (green trend-line), this 1D MA50 test is probably the last technical confirmation that the current Bullish Leg needs before it starts rising aggressively, similar to what happened in July.
That Bullish Leg peaked on the 2.0 Fibonacci extension level. If this sequence is repeated, expect the next high to be around $5.00.
-------------------------------------------------------------------------------
** Please LIKE 👍, FOLLOW ✅, SHARE 🙌 and COMMENT ✍ if you enjoy this idea! Also share your ideas and charts in the comments section below! This is best way to keep it relevant, support us, keep the content here free and allow the idea to reach as many people as possible. **
-------------------------------------------------------------------------------
💸💸💸💸💸💸
👇 👇 👇 👇 👇 👇

ETHEREUM Is it realistic to expect last Cycle's rally?Ethereum (ETHUSD) has been practically consolidating since the mid-August High, following an impressive rally on the April 07 Low. Technically it is coming off a 1W MA50/100 Bullish Cross.
It is the exact same pattern that confirmed ETH's massive parabolic rise (green Channel Up) during the previous Cycle in August 17 2020. The 1W RSI fractals between the two sequences are similar.
However, time-wise we are not in the same stage as last Cycle, in fact we are much closer to the end of the 4-year Cycle model. If there is still some time to repeat such a parabolic run, the price is 'limited' by the 1.618 Fibonacci extension at $13500, which again will be a wonderful and increasingly optimistic target for this Cycle Top.
Do you think it is realistic to expect such repeat at this stage?
-------------------------------------------------------------------------------
** Please LIKE 👍, FOLLOW ✅, SHARE 🙌 and COMMENT ✍ if you enjoy this idea! Also share your ideas and charts in the comments section below! This is best way to keep it relevant, support us, keep the content here free and allow the idea to reach as many people as possible. **
-------------------------------------------------------------------------------
💸💸💸💸💸💸
👇 👇 👇 👇 👇 👇

BITCOIN 1W Stoch RSI completed a Bullish Cross. Expect new ATH.Bitcoin (BTCUSD) just completed a Bullish Cross on its 1W STOCH RSI and that's the first time it does so since April 07 2025. That was as we know, the previous market bottom of the Trade War correction.
In fact, every 1W STOCH RSI Bullish Cross has been a buy signal within this Bull Cycle's Channel Up (since November 2022), most of which huge. The April 2025 Bullish Leg rose by +65.92% and that has been the 'weakest' one of this Channel Up.
As a result, if we get the bear minimum of +65.92% this time around too, expect a new High around $175000, which should be the Cycle Top and in our opinion the absolute maximum that this Cycle can give.
Do you think we will go that high? Feel free to let us know in the comments section below!
-------------------------------------------------------------------------------
** Please LIKE 👍, FOLLOW ✅, SHARE 🙌 and COMMENT ✍ if you enjoy this idea! Also share your ideas and charts in the comments section below! This is best way to keep it relevant, support us, keep the content here free and allow the idea to reach as many people as possible. **
-------------------------------------------------------------------------------
💸💸💸💸💸💸
👇 👇 👇 👇 👇 👇

Ethereum $ETH daily demand playing out well. Breakout happenedEthereum CRYPTOCAP:ETH daily demand at $4,336 is playing out well. Breakout happened as expected and mentioned in the last update. Long positions should be managed on this major cruptocurrency.

BITCOIN Will it pull back??Bitcoin (BTCUSD) just formed a 4H Golden Cross, technically a bullish pattern, which usually emerges at the start of uptrends.
Such a formation emerged on both main Channel Up patterns since the April 07 Trade War bottom. The interesting feature however is that, following every 4H Golden Cross, the price always pulled back to its 4H MA200 (orange trend-line).
With BTC having started the week on the back foot, the 4H MA200 currently stands at $113600. Ahead of the Fed Rate Decision this week, a 'volatility' pull-back would align the news with this technical need.
Do you think we'll get that pull-back? Feel free to let us know in the comments section below!
-------------------------------------------------------------------------------
** Please LIKE 👍, FOLLOW ✅, SHARE 🙌 and COMMENT ✍ if you enjoy this idea! Also share your ideas and charts in the comments section below! This is best way to keep it relevant, support us, keep the content here free and allow the idea to reach as many people as possible. **
-------------------------------------------------------------------------------
💸💸💸💸💸💸
👇 👇 👇 👇 👇 👇

DOGE rejected on its 6-month Resistance. What's next?Dogecoin (DOGEUSD) eventually made the bullish break-out we talked about on our last analysis above the top (Lower Highs trend-line) of the Triangle but got emphatically rejected on its 6-month Higher Highs trend-line.
That is the main Resistance holding since March 03. Last time it delivered a rejection that tested the 1D MA50 (red trend-line) before a new rebound. As a result, if the price closes a candle below the 4H MA50 (blue trend-line), it is more likely to see a new 1D MA50 test around 0.23000 before the decisive rebound that might attempt to break above the 6-month Resistance.
If the 4H MA50 holds, we could go for the Resistance break-out immediately. In either case, our 0.4100 medium-term Target stands.
-------------------------------------------------------------------------------
** Please LIKE 👍, FOLLOW ✅, SHARE 🙌 and COMMENT ✍ if you enjoy this idea! Also share your ideas and charts in the comments section below! This is best way to keep it relevant, support us, keep the content here free and allow the idea to reach as many people as possible. **
-------------------------------------------------------------------------------
💸💸💸💸💸💸
👇 👇 👇 👇 👇 👇

INJUSD Rising Wedge going for a new High.Injective (INJUSD) has been trading within a Rising Wedge pattern since the March 02 High. Right now it broke above its 1D MA50 (blue trend-line) again, following a September 01 Higher Low on the pattern's bottom.
This is technically the start of its new Bullish Leg and given the fact that both previous two peaked on their 1.136 Fibonacci extensions, we set now a medium-term Target of 17.150.
-------------------------------------------------------------------------------
** Please LIKE 👍, FOLLOW ✅, SHARE 🙌 and COMMENT ✍ if you enjoy this idea! Also share your ideas and charts in the comments section below! This is best way to keep it relevant, support us, keep the content here free and allow the idea to reach as many people as possible. **
-------------------------------------------------------------------------------
💸💸💸💸💸💸
👇 👇 👇 👇 👇 👇

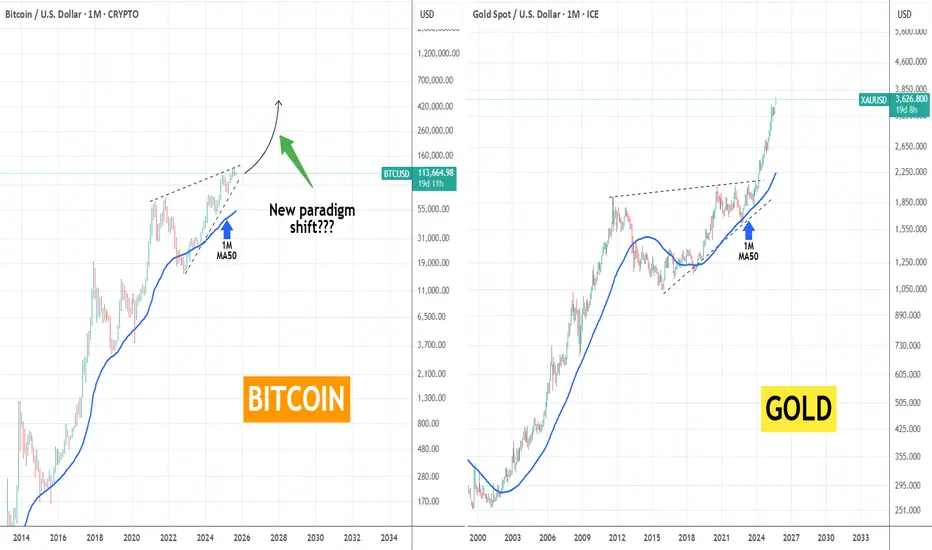
BITCOIN vs GOLD Is something like that inevitable?Bitcoin (BTCUSD) has been often described as the digital Gold, mainly due to its scarcity (fixed supply), compared to Gold's value as a safe haven asset. So what's the deal with this comparison chart?
If you follow us for long, you should know that we are strong believers of BTC's 4-year Cycle theory, which has served us so well and helped us buy and sell near cyclical bottoms and tops respectively.
However, as the market matures (remember Bitcoin is 'only' 16 years old), it could/ should eventually break this pattern upwards into aggressively higher valuations, which could be the shift to a new paradigm as mass adoption kicks in.
As a result, could it make a vicious bullish break-out above this Triangle in a similar way as Gold past 2024? Essentially, can we argue that Gold is leading the way as the traditional asset? Or the 4-year Cycle will go on for much longer than many think?
We are very interested in your thoughts. Feel free to let us know in the comments section below!
-------------------------------------------------------------------------------
** Please LIKE 👍, FOLLOW ✅, SHARE 🙌 and COMMENT ✍ if you enjoy this idea! Also share your ideas and charts in the comments section below! This is best way to keep it relevant, support us, keep the content here free and allow the idea to reach as many people as possible. **
-------------------------------------------------------------------------------
💸💸💸💸💸💸
👇 👇 👇 👇 👇 👇
BTCUSDT - What next ?? We can see a retest of 111k7 level, but bitcoin was not successful in closing above it.
111K7 continues to remain as our area of interest for now. Closing above which we will change bias.
For now bitcoin is still bearish....
Happy Trading!!!

CARDANO Bullish Leg to $1.075 has just started.Cardano (ADAUSD) is on a strong rebound following the September 01 Low, which was a technical Higher Low at the bottom of the Channel Up that started on the June 22 bottom.
That pattern managed to break last month above the 8-month Lower Highs trend-line of the massive mid-Cycle correction that ADA had. This Channel Up has priced its two Higher Highs so far just above the 1.236 Fibonacci extension.
As a result, we expect the current Bullish Leg to reach at least $1.0750.
-------------------------------------------------------------------------------
** Please LIKE 👍, FOLLOW ✅, SHARE 🙌 and COMMENT ✍ if you enjoy this idea! Also share your ideas and charts in the comments section below! This is best way to keep it relevant, support us, keep the content here free and allow the idea to reach as many people as possible. **
-------------------------------------------------------------------------------
💸💸💸💸💸💸
👇 👇 👇 👇 👇 👇

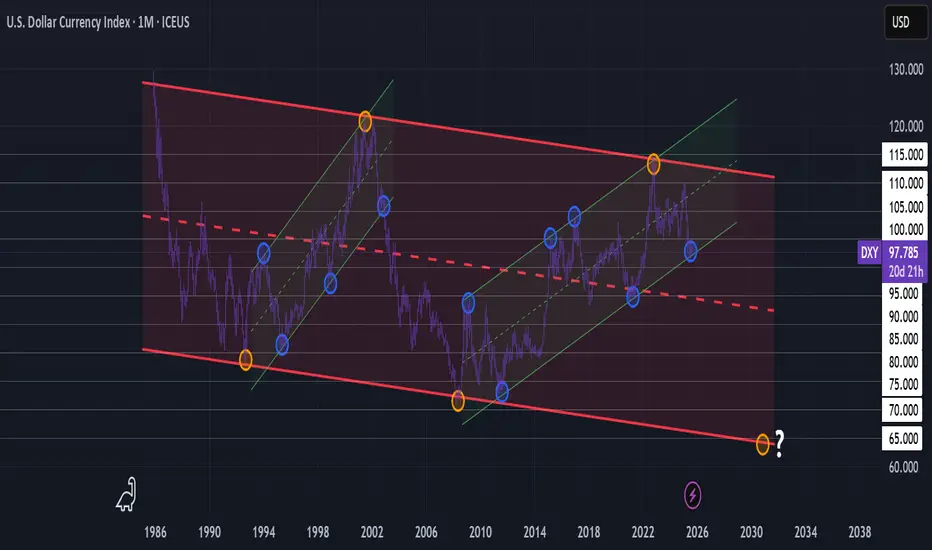
Implausible until it's not? Zoom out $DXY.On the high time frames, the dollar is trading inside a long-term descending channel that dates back decades. The rally into a rising channel has been previously followed by a decline 2002-2008. The most recent rejection from the channel’s upper trend in 2022–2023 suggests that momentum could shift toward the downside, with our next macro target lying near the bottom of the range. We've already broken below our major whole of 1.00 and retested.
Recent NFP data shows a cooling labor market. Slowing job growth and downward revisions might point to a break in momentum. A softer labor market reduces the Fed’s ability to maintain higher rates, undermining DXY strength. Beyond employment, consumer spending is showing cracks while business investment is being pressured by higher borrowing costs. If growth becomes stagnant, the immediate appeal of the economy could weaken, reducing foreign capital that support the dollar. Other factors may include tariffs, policy shifts, or deficits.
When both macro fundamentals and technical structure align, the case for a dollar decline strengthens. While near-term volatility is always expected around Fed shifts and global risk, the high-time-frame view points to the possibility of a downtrend that could extend into the months or possibly years to come.
Eyes peeled for an inverse crypto-winter.
BITCOIN Is this the last rally of the Cycle??Bitcoin (BTCUSD) has held its 1W MA20 (red trend-line) to perfection and closed last week in green for the first time after 3 straight red 1W candles.
As discussed in previous analyses, the 1W MA20 is critical to BTC's bullish trend as it is the trend-line that supported every final parabolic rally on its previous Cycles.
Even on the current Bull Cycle, it has been the first (and main) level of Support during the entirety of the 3-year Channel Up. The second one is the 1W MA50 (blue trend-line) and was the ultimate Buy Signal on all three occasions it was hit (or approached), which coincided with a 0.382 Fibonacci retracement test.
Since the last contact the market had with both the 1W MA50 and 0.382 Fib (April 07 2025 Low), Bitcoin has been trading within the Channel's 0.236 - 0.618 Fibonacci range, which is the zone that has dominated the price action for most of the Bull Cycle. It broke below or above it 4 times, twice below it in the early stages of the Channel Up and as the Cycle's strength accelerated, twice above it to form Higher Highs.
Those Higher Highs have been the mid-Cycle 'Profit taking Zones' (red Triangles), where traders/ investors were encouraged to book quarterly profits and wait for a lower buy opportunity o the 1W MA50/ 0.382 Fib Support Cluster.
Once again, this is were we expect this upcoming final BTC rally to peak. Technically, even if we see a highly aggressive rise starting now, this Zone should be at $140k and above. Profit taking is a personal matter to each trader, depending on their risk tolerance and how low/ soon they entered the market, but this chart can serve as a reminder on their profit taking strategy.
So are you booking your profits soon for this Cycle? Feel free to let us know in the comments section below!
-------------------------------------------------------------------------------
** Please LIKE 👍, FOLLOW ✅, SHARE 🙌 and COMMENT ✍ if you enjoy this idea! Also share your ideas and charts in the comments section below! This is best way to keep it relevant, support us, keep the content here free and allow the idea to reach as many people as possible. **
-------------------------------------------------------------------------------
💸💸💸💸💸💸
👇 👇 👇 👇 👇 👇

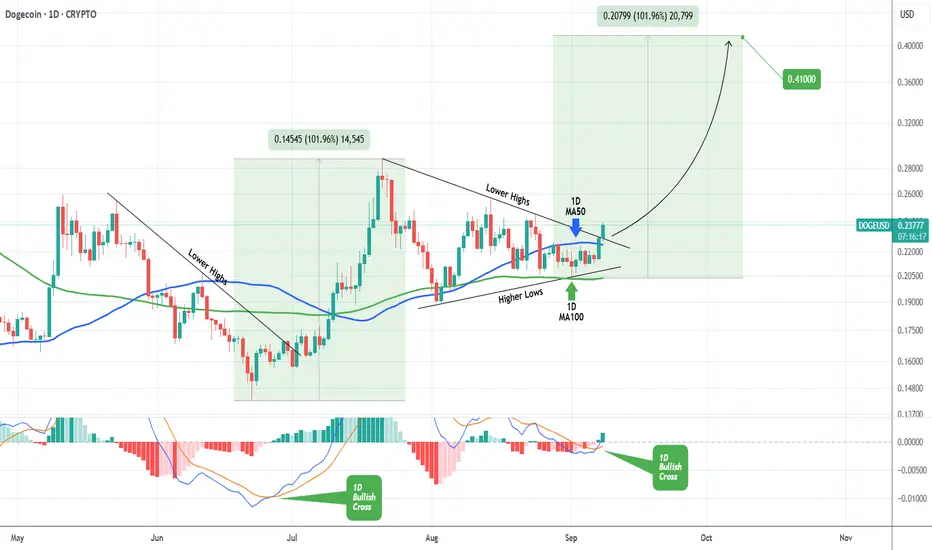
DOGE Strong Triangle break-out targets $0.4100Dogecoin (DOGEUSD) broke today above the top (Lower Highs trend-line) of the Triangle pattern that it has been trading in since the July 21 High. At the same time, the 1D MACD formed a Bullish Cross below the 0.0 level.
The last time the coin made a Lower Highs bullish break-out on a MACD Bullish Cross below 0.0 was on June 30. That break-out completed a +101.96% rise. We expect a similar rise to occur, giving us a $0.4100 Target within a month's time.
-------------------------------------------------------------------------------
** Please LIKE 👍, FOLLOW ✅, SHARE 🙌 and COMMENT ✍ if you enjoy this idea! Also share your ideas and charts in the comments section below! This is best way to keep it relevant, support us, keep the content here free and allow the idea to reach as many people as possible. **
-------------------------------------------------------------------------------
💸💸💸💸💸💸
👇 👇 👇 👇 👇 👇
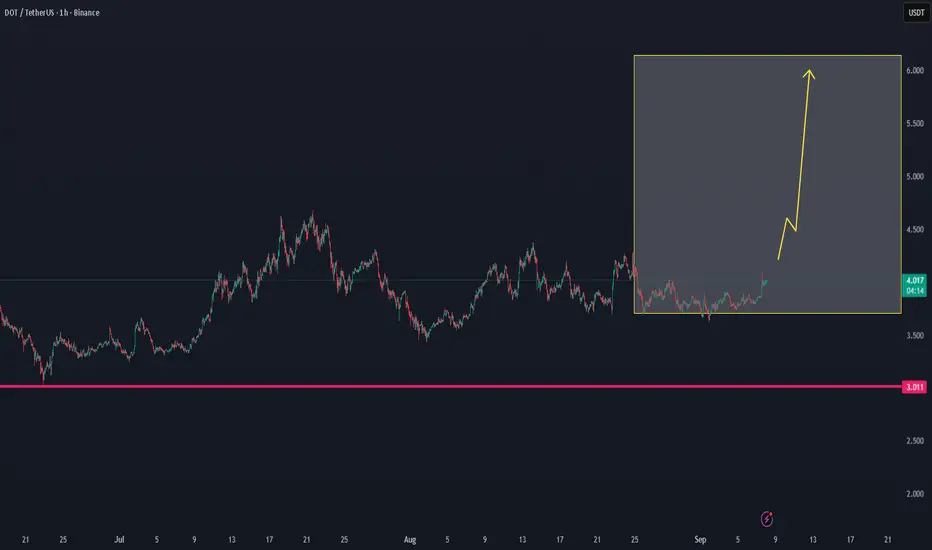
DOT STARTING NEW VOLUME TRENDDOT STARTING NEW VOLUME TREND
Following to see new confirmations at DOT
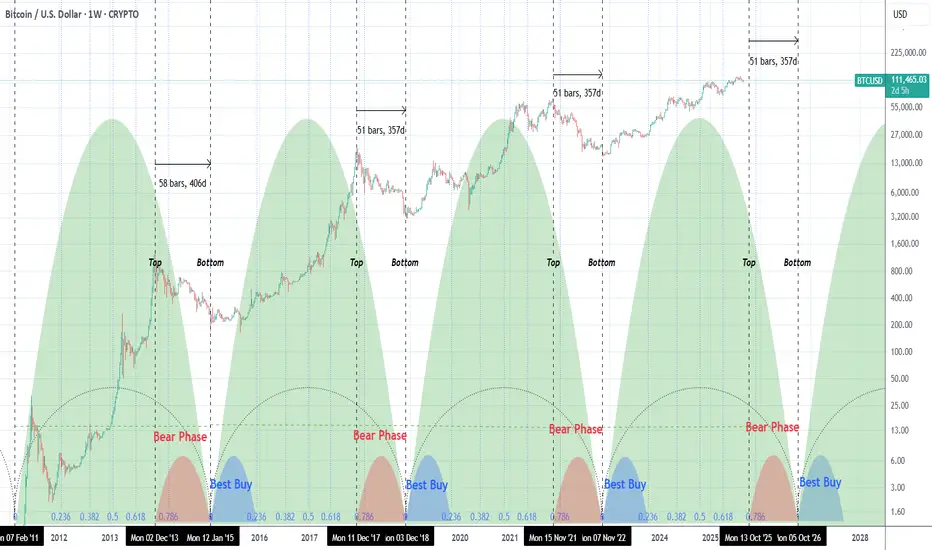
BITCOIN Is the end of the Bull Cycle approaching?Bitcoin (BTCUSD) may be approaching the end of its current Bull Cycle and a few weeks ago we have issued a first reminder of the dynamics of this Cycle in relation to all previous. The historic symmetry is high and this time we've presented it using the Time Cycles and Time Fibonacci levels.
As mentioned on previous studies, measuring the Super Cycle from bottom-to-bottom, the Top tends to be formed around the 0.786 Time Fib. Naturally the distance from the 0.786 Fib and 1.0 is the Bear Phase (red). What follows next is the Bear Buy (blue) of the Bull Phase from Fib 0.0 to Fib 0.236.
What concerns us most at this stage is the fact that 0.786 Time Fib is on the week starting December 01 2025. To make things more alarming, if the next Bear Phase follows the last two that measured 51 days from Top-to-Bottom, since the Super Cycle ends on October 05 2026, the next potential Top of this Cycle could be on the week starting October 13 2025!
Certainly food for thought, surely the current Cycle got derailed/ delayed a few months by Trump's tarrifs but above all this serves as a reminder that booking profits in trading is key. And especially since very few actually manage to do so on Tops.
So are you booking profits for this Cycle or not yet? Feel free to let us know in the comments section below!
-------------------------------------------------------------------------------
** Please LIKE 👍, FOLLOW ✅, SHARE 🙌 and COMMENT ✍ if you enjoy this idea! Also share your ideas and charts in the comments section below! This is best way to keep it relevant, support us, keep the content here free and allow the idea to reach as many people as possible. **
-------------------------------------------------------------------------------
💸💸💸💸💸💸
👇 👇 👇 👇 👇 👇
DOGE Accumulation Cylinder about to take-off.Dogecoin (DOGEUSD) has been flat in August and so far on September's 1M candle, while being supported by its 1M MA50 (blue trend-line) for almost 1 year (October 2024).
This fits the pre parabolic rally pattern of the Accumulation Cylinder that both previous Cycles had. As you can see, it is that exact pattern (Accumulation Cylinder) that historically makes Doge's transition from its Bear Cycle bottom to the Bull Cycle. Once the 1M MA50 is established as the Support, the Accumulation Cylinder gives way to a Parabolic Rally take-off.
Both Cycles reached at least the 1.618 Fibonacci extension from their previous All Time High (ATH) before the Cycle peaked. This time, the realistic Target before the Cycle ends is at least $1.00, unless the Cycle gets a little prolonged in which case we could se an over-extension to $3.50 (the 1.618 Fib ext).
Which one are you aiming for?
-------------------------------------------------------------------------------
** Please LIKE 👍, FOLLOW ✅, SHARE 🙌 and COMMENT ✍ if you enjoy this idea! Also share your ideas and charts in the comments section below! This is best way to keep it relevant, support us, keep the content here free and allow the idea to reach as many people as possible. **
-------------------------------------------------------------------------------
💸💸💸💸💸💸
👇 👇 👇 👇 👇 👇
