BITCOIN hit $60k and is -50% from ATH. Did it crash too soon??Bitcoin (BTCUSD) almost hit the $60000 mark in early session today, which represents a more than -50% crash from its October 2025 $126000 All Time High (ATH).
** Is it happening too soon? **
Given that we haven't even completed 4 months since the ATH, the question that arises is this: Is this crash happening too soon??
Short answer: YES. And the reason is simple and has to do with the market's macro technicals. Today's $60k Low isn't just a -50% drop from the ATH but it is also taking place extremely close to its 1W MA200 (orange trend-line), while the 1W RSI turned oversold (below 30.00). All this just the second week after losing the 1W MA100 (green trend-line), which has been holding as the Support in almost the past 3 months of the 1W MA50 - 1W MA100 consolidation Rectangle.
** The 1W MA200 and oversold RSI **
That consolidation Rectangle has always served as the pattern that transitioned BTC from its early to the final stage of its Bear Cycle. However this is the soonest occasion historically that Bitcoin reaches its 1W MA200 from an ATH. On the 2014 Bear Cycle it took 59 weeks to do so, on the 2018 Bear Cycle 51 weeks (both were Cycle bottoms), on the 2022 Cycle almost half the time, 31 weeks not a Cycle bottom) and now we are 'just' 17 weeks (119 days) after. Needless to say, it is also the soonest it hit an oversold 1W RSI state, something that has historically coincided with a 1W MA200 test, so that's consistent.
** So what now? **
So what does this historically earliest crash mean for us today? Well most likely that we still have a long way to go. Given this aggressive drop, the market should continue to test at least the 1W MA350 (red trend-line), which is where the previous Bear Cycle bottomed in November 2022 (took almost as much time as the 1W MA50 - 1W MA100 consolidation Rectangle did from he moment the 1W MA200 broke) and we expect that to be around $48000 by May - June 2026.
However, based on the 4-year Cycle Theory, the Bear Cycle bottom should be around late September- October 2026. So practically the bottom could be even lower (potentially the 1W MA500 even as we presented on an analysis last month).
So what do you think? Is the fact that BTC crashed too soon to its 1W MA200 alarming? Feel free to let us know in the comments section below!
---
** Please LIKE 👍, FOLLOW ✅, SHARE 🙌 and COMMENT ✍ if you enjoy this idea! Also share your ideas and charts in the comments section below! This is best way to keep it relevant, support us, keep the content here free and allow the idea to reach as many people as possible. **
---
💸💸💸💸💸💸
👇 👇 👇 👇 👇 👇
Cryptocurrencysignals

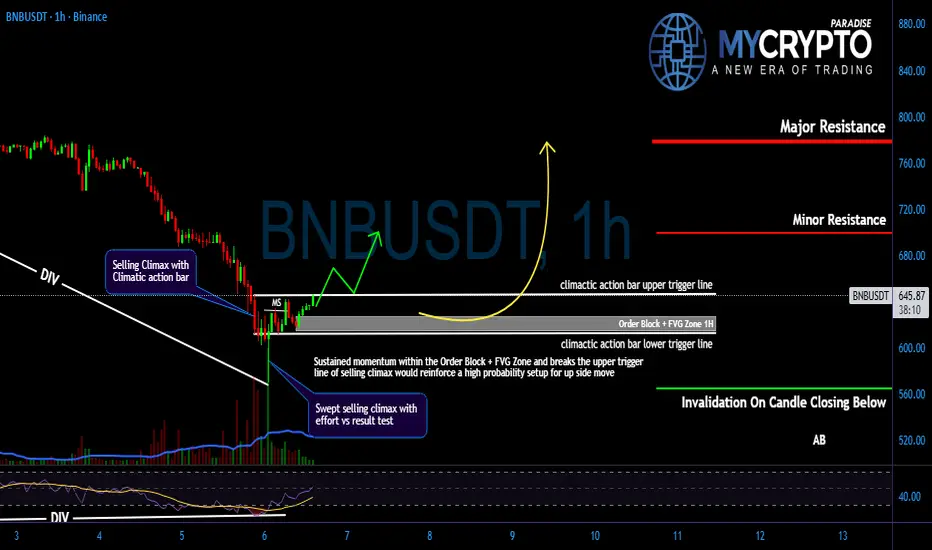
Will You Miss BNB Next Move While Smart Money Positions Quietly?Yello Paradisers! Are you watching this closely enough? Because #BNB formed a selling climax followed by a climactic action candle, and if you're not prepared, you might miss out on a huge opportunity. Additionally, we are seeing selling climax has been swept by effort vs result test, a classic probability that institutional buyers are stepping in. This is where things start to get exciting.
💎#BNB has just formed a classic selling climax, followed by a climactic action candle with ultra-high volume a textbook sign of accumulation. This is the kind of behaviour we’ve seen over and over again when smart money starts positioning quietly before the real move begins.
💎After the selling climax, #BNB successfully swept liquidity with an Effort vs Result test a strong possibility that weak hands are out and stronger ones are stepping in. The key trigger now lies just above the upper line of the climactic action bar. If #BNB breaks above that level with a strong momentum candle, the next potential probability of upside move lies at 780, a major structural and resistance zone.
💎#BNB higher time frame structure remains bearish, and this is extremely important to respect. However, during the latest downside leg, we observed a clear RSI divergence, showing weakness in bearish momentum. As long as #BNB holds momentum within the order block and fair value gap zone, the setup remains constructive, the probability of an initial upside move sits around 700, a key structural and moderate resistance level.
💎If #BNB fails to hold bullish momentum and a momentum candle closes below 564, the current bullish probability becomes invalid. In that case, we could see further downside pressure.
That is why Paradisers, we are playing it safe right now. If you want to be consistently profitable, you need to be extremely patient and always wait only for the best, highest probability trading opportunities only on confirmations.
MyCryptoParadise
iFeel the success🌴
BTC 2H Update: Descending Broadening Wedge Breakout in Play!
Bitcoin has broken out of a **Descending Broadening Wedge** pattern on the **2-hour timeframe**!
This classic pattern features diverging downward-sloping trendlines with increasing volatility — often appearing at the end of a consolidation or downtrend phase. Statistically, descending broadening wedges show a strong bullish bias on upward breakouts (around 70-80% probability in many historical studies).
We've now seen a clean break above the upper resistance line, signaling that buyers are taking control with fresh momentum.
**Current Situation (as of Feb 8, 2026):**
- BTC is trading around $69,000–$70,000 after recent choppy action and a sharp dip/recovery earlier this week.
- The breakout looks promising, but crypto remains volatile — watch closely!
**Key Things to Monitor:**
✅ **Confirmation**: Price needs to hold firmly above the breakout level with rising volume to confirm strength and lower fakeout risk.
⚠️ **Fakeout Danger**: If price reverses quickly back into the wedge or turns the broken line into resistance, the setup could fail (watch recent lows for invalidation).
🎯 **Potential Targets**: If momentum builds, a measured move from the pattern could deliver a solid upward leg — room for a nice pump if buyers stay aggressive.
Stay disciplined: Manage your risk, avoid FOMO chasing, and don't go all-in blindly. This could kick off a strong move, but remember — Bitcoin loves throwing fakeouts! 😅

TRXUSD 6-month Channel Down in total control targeting 0.2600.Tron (TRXUSD) has been trading within a 6-month Channel Down since its August 14 2025 High and is right now already halfway through its 3rd Bearish Leg.
Having lost both its 1D MA200 (orange trend-line) and 1D MA200 (orange trend-line), which should serve as the long-term Resistance from now on, we expect it to test the 1W MA100 (red trend-line) on the long-term.
On the short-term based on the previous Bearish Legs, we expect it to complete at least a -19.37% total decline form the Lower High, targeting 0.26000.
---
** Please LIKE 👍, FOLLOW ✅, SHARE 🙌 and COMMENT ✍ if you enjoy this idea! Also share your ideas and charts in the comments section below! This is best way to keep it relevant, support us, keep the content here free and allow the idea to reach as many people as possible. **
---
💸💸💸💸💸💸
👇 👇 👇 👇 👇 👇

Bearish continuation?Ethereum (ETH/USD) has rejected off the pivot, which is a pullback resistance, and could drop to the 1st support.
Pivot: 2,185.81
1st Support: 1,952.49
1st Resistance: 2,347.75
Disclaimer:
The opinions given above constitute general market commentary and do not constitute the opinion or advice of IC Markets or any form of personal or investment advice.
Any opinions, news, research, analyses, prices, other information, or links to third-party sites contained on this website are provided on an "as-is" basis, are intended to be informative only, and are not advice, a recommendation, research, a record of our trading prices, an offer of, or solicitation for, a transaction in any financial instrument and thus should not be treated as such. The information provided does not involve any specific investment objectives, financial situation, or needs of any specific person who may receive it. Please be aware that past performance is not a reliable indicator of future performance and/or results. Past performance or forward-looking scenarios based upon the reasonable beliefs of the third-party provider are not a guarantee of future performance. Actual results may differ materially from those anticipated in forward-looking or past performance statements. IC Markets makes no representation or warranty and assumes no liability as to the accuracy or completeness of the information provided, nor any loss arising from any investment based on a recommendation, forecast, or any information supplied by any third party

ETHEREUM Channel Down got oversold but this isn't the bottom!Ethereum (ETHUSD) is extending its losses as, following the January 14 rejection on its 1D MA100 (green trend-line), it made a Lower High on its 4-month Channel Down that kick-started the new Bearish Leg.
The 1D RSI turned oversold (below 30.00) for the first time since November 21 2025 but besides a (potential) short-term dead-cat-bounce towards the 0.382 Fibonacci retracement like on November 10 2025, it should bottom lower, at least at $1900 making a -44.80% decline (at least), similar to the previous Bearish Leg, before any meaningful longer term relief rally.
Technically, the strongest pressure zone (demand at this point) is the 1385 Support of the April 09 2025 Low.
---
** Please LIKE 👍, FOLLOW ✅, SHARE 🙌 and COMMENT ✍ if you enjoy this idea! Also share your ideas and charts in the comments section below! This is best way to keep it relevant, support us, keep the content here free and allow the idea to reach as many people as possible. **
---
💸💸💸💸💸💸
👇 👇 👇 👇 👇 👇

BITCOIN and the powerful Stoch RSI Cycle SignalThe Stoch RSI is a very rarely used indicator, in fact the last time we made use of it on Bitcoin (BTCUSD) was around the bottom of the 2022 Bear Cycle. We bring it forward to you once more as December closed with the 1M Stoch RSI below the 20.00 level. Historically, every time the market did that, BTC's new Bear Cycle had already started but it was still in its beginning.
You can see that during the majority of each Bear Cycle, the 1M Stoch RSI settled sideways below the 20.00 mark and when it broke back above it, the new Bull Cycle had already started. The time distance between those signals during the last two Cycles has been just over 1 year (13 months, 396 days). This suggests that by January 2027, BTC's new Bull Cycle will already have started most likely.
As to a potential bottom? The strongest candidate is the 3W MA100 (red trend-line), which has been hit during all previous three Cycles. That is currently around $53000 and rising, so we expect BTC to hit at least this level before a Bear Cycle bottom around October 2026. Additionally, the Mayer Multiple Bands (MMBs) green Zone, offers a Buy Zone, which priced the November 2022 bottom.
So what do you think? Is this Stoch RSI signal useful in your long-term positioning? Feel free to let us know in the comments section below!
---
** Please LIKE 👍, FOLLOW ✅, SHARE 🙌 and COMMENT ✍ if you enjoy this idea! Also share your ideas and charts in the comments section below! This is best way to keep it relevant, support us, keep the content here free and allow the idea to reach as many people as possible. **
---
💸💸💸💸💸💸
👇 👇 👇 👇 👇 👇

BCHUSD H4 | Heading Towards 38.2% Fib ResistanceThe price is rising towards our sell entry level at 562.52, which is a pullback resistance that aligns with the 38.2% Fibonacci retracement.
Our stop loss is set at 597.43, whichis an overlap resistance that aligns with the 61.8% Fibonacci retracement.
Our take profit is set at 501.30, which is a pullback support.
High Risk Investment Warning
Stratos Markets Limited fxcm.com Stratos Europe Ltd fxcm.com
CFDs are complex instruments and come with a high risk of losing money rapidly due to leverage. 69% of retail investor accounts lose money when trading CFDs with this provider. You should consider whether you understand how CFDs work and whether you can afford to take the high risk of losing your money.
Stratos Global LLC fxcm.com Losses can exceed deposits.
Please be advised that the information presented on TradingView is provided to FXCM (‘Company’, ‘we’) by a third-party provider (‘TFA Global Pte Ltd’). Please be reminded that you are solely responsible for the trading decisions on your account. Any information and/or content is intended entirely for research, educational and informational purposes only and does not constitute investment or consultation advice or investment strategy. The information is not tailored to the investment needs of any specific person and therefore does not involve a consideration of any of the investment objectives, financial situation or needs of any viewer that may receive it. Past performance is not a reliable indicator of future results. Actual results may differ materially from those anticipated in forward-looking or past performance statements. We assume no liability as to the accuracy or completeness of any of the information and/or content provided herein and the Company cannot be held responsible for any omission, mistake nor for any loss or damage including without limitation to any loss of profit which may arise from reliance on any information supplied by TFA Global Pte Ltd.
Stratos Trading Pty. Limited fxcm.com
Trading FX/CFDs carries significant risks. FXCM AU (AFSL 309763), please read the Financial Services Guide, Product Disclosure Statement, Target Market Determination and Terms of Business at fxcm.com

Bearish continuation?Bitcoin (BTC/USD) is rising towards the pivot and could reverse to the 1st support.
Pivot: 83,564.08
1st Support: 75,639.09
1st Resistance: 86,951.84
Disclaimer:
The opinions given above constitute general market commentary and do not constitute the opinion or advice of IC Markets or any form of personal or investment advice.
Any opinions, news, research, analyses, prices, other information, or links to third-party sites contained on this website are provided on an "as-is" basis, are intended to be informative only, and are not advice, a recommendation, research, a record of our trading prices, an offer of, or solicitation for, a transaction in any financial instrument and thus should not be treated as such. The information provided does not involve any specific investment objectives, financial situation, or needs of any specific person who may receive it. Please be aware that past performance is not a reliable indicator of future performance and/or results. Past performance or forward-looking scenarios based upon the reasonable beliefs of the third-party provider are not a guarantee of future performance. Actual results may differ materially from those anticipated in forward-looking or past performance statements. IC Markets makes no representation or warranty and assumes no liability as to the accuracy or completeness of the information provided, nor any loss arising from any investment based on a recommendation, forecast, or any information supplied by any third party

BITCOIN hit 10-month Low! Will it recover, at least a bit??Bitcoin (BTCUSD) almost hit today (so far) its 10-month Low of the April 07 2025 Low (Support 1). It did so after a very disappointing 2-week bearish streak where it initially had a crystal clear 1D MA100 (green trend-line) rejection, followed by two on the 1D MA50 (blue trend-line).
The pattern is technically quite similar to the January - March 2025 Channel Down correction that led to the April 07 bottom. With the 1D RSI turning massively oversold in the process, hitting the 23.50 Support, where both the November 21 2025 and February 26 2025 Lows were priced, it is possible to see a rebound to test the 1D MA50 at least, again.
Since however this is a Bear Cycle and not just a short-term correction within a Bull Cycle, we don't expect a sustainable rally like April - May 2025 but rather a prolonged sideways volatile price action, that could retest the 1D MA100 even before making a new Low and start Phase 2. For now, at least, a rebound to $87000 seems like a technical probability.
Do you think that's the case or BTC will drop even lower more aggressively? Feel free to let us know in the comments section below!
---
** Please LIKE 👍, FOLLOW ✅, SHARE 🙌 and COMMENT ✍ if you enjoy this idea! Also share your ideas and charts in the comments section below! This is best way to keep it relevant, support us, keep the content here free and allow the idea to reach as many people as possible. **
---
💸💸💸💸💸💸
👇 👇 👇 👇 👇 👇

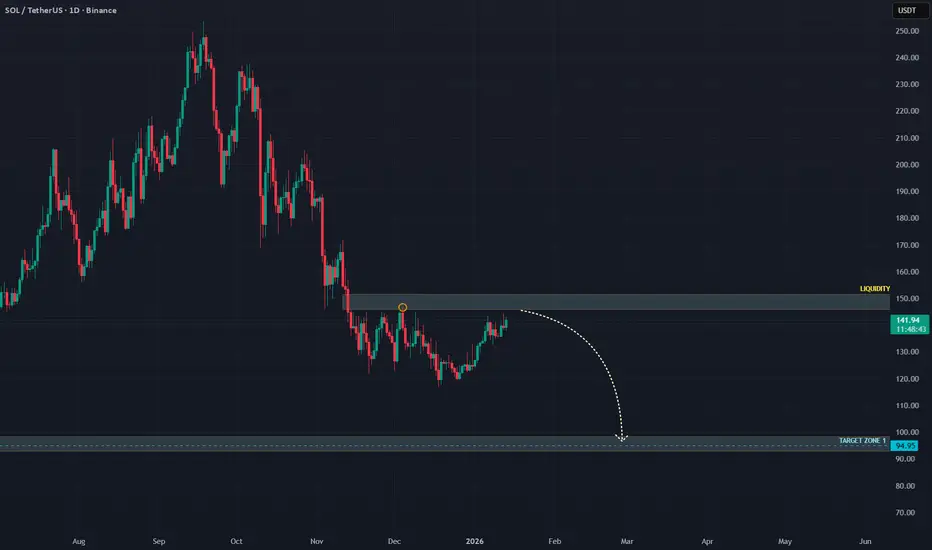
SOLANA — Absorption at HTF Resistance | Downside Risk IncreasingTraders,
CRYPTOCAP:SOL pushed into resistance and stalled. Not aggressively. Not weakly either.
What we are seeing now is absorption, and the market is quietly deciding what to do next.
The question is not “bullish or bearish.”
The question is where the real decision gets made.
Right now, the chart gives us a very clean structure.
1. What happened
SOL rallied back into a higher-timeframe resistance zone around $142–145.
This area is important because:
It previously acted as distribution
It aligns with a harmonic exhaustion level
Liquidity is clearly resting above
Price did not reject immediately.
Instead, it slowed down.
That already tells us something.
2. What price is doing now
On the 1H, price is pushing higher in small steps:
Push
Pause
Shallow pullback
Push again
Each high looks constructive, but none are being accepted cleanly.
This is not breakout behavior.
This is price being worked inside supply.
Liquidity above is visible.
Yet price hesitates just below it.
3. Momentum in strength, not divergence
RSI is not aggressively diverging here.
Instead:
RSI stays elevated
Each push higher produces less expansion
Momentum rolls over inside strength
That usually means effort is being absorbed, not rewarded.
When momentum stalls at resistance without breaking down, it often reflects absorption inside strength, not weakness.
4. Spot flow tells the real story
Spot CVD continues to rise.
On both the 1H and the 4H, spot CVD is making clear higher highs. Buyers are not hesitating. Market orders keep hitting the ask, and spot demand is persistent across timeframes.
On the surface, that looks bullish.
But price is not responding.
Despite spot CVD printing higher highs, price remains capped beneath resistance and fails to gain acceptance. Each attempt higher is absorbed rather than extended.
That mismatch matters.
When spot demand increases across multiple timeframes and price fails to move, it usually means one thing:
Supply is sitting above the market
Sellers are passive and patient
Buyers are doing all the work
This is classic absorption behavior.
The important detail here is that this is not a single-timeframe signal. The fact that spot CVD is making higher highs on both the 1H and 4H strengthens the read. Real buyers are present, but they are being met by consistent supply.
That is not how breakouts start.
That is how distribution hides.
5. Futures are not confirming
While spot keeps buying:
Stablecoin-margined futures CVD trends lower
Perp traders are selling into strength
Leverage is not chasing this move
Coin-margined futures remain net negative, suggesting longer-horizon participants are still distributing.
Different groups, same message: less appetite for higher prices here.
6. Open interest adds tension
Open interest remains elevated.
Price is not expanding, yet positions are being added.
That creates pressure.
Crowded markets don’t drift.
They eventually move, and usually fast.
7. The higher-timeframe context
On the daily, accumulation and distribution remains pointed lower.
Rallies continue to be used to offload supply.
This move fits that pattern.
Push into resistance.
Effort from buyers.
No acceptance.
8. The decision zone
The area around $142–145 is the key checkpoint.
This is where supply has been active before, and it is where the market has to prove it can do more than just absorb.
If price:
Pushes slightly higher
Sweeps the liquidity sitting in the blue box
But fails to hold or shows weakening spot follow-through
Then this area becomes a distribution and take-profit zone, not a breakout.
A sweep without acceptance is often the final act before rotation.
If sellers remain patient here, downside opens quickly.
9. Downside focus
Below the current range, the structure is thin.
There is unfinished business lower, and price has not spent enough time there to build support.
Target zone: $94–100
This area stands out because:
It previously acted as acceptance
Liquidity is concentrated there
It represents a clean mean reversion for the entire move
If price starts to roll from the current region, this zone becomes the primary magnet.
Moves like this rarely stop halfway.
10. How to read it in real time
A push into the blue box followed by stalling price and slowing spot CVD → distribution
Spot CVD still rising but price failing to hold → absorption, not strength
Spot CVD rolling over at highs → rotation starting
The market does not need to break down immediately.
It only needs to stop rewarding buyers.
When that happens, the path lower opens fast.
------------------------------------------
The market is leaning into supply.
It may take one more push into liquidity before the real move starts, but the risk remains skewed lower as long as buyers are not being rewarded.
Let price do the talking.
If this analysis helped you see the structure more clearly, a like is always appreciated.
Feel free to share your thoughts or alternative scenarios in the comments.
Thanks for reading.
BTCUSD 45-Min Chart — Support Reclaim Setup After Sharp Breakdow
Market Structure:
Clear bearish break from the prior range near 87k resistance, followed by a strong impulsive sell-off → confirms a bearish market shift.
Support Zone (Key Area):
Price is reacting around 80,600–81,000, a marked demand/support zone. This is the first meaningful base after the dump.
Current Price Action:
BTC is testing support after a lower high, suggesting sellers are losing momentum. Wicks into support show buying interest, but confirmation is still needed.
Entry Logic:
The marked entry near 80.6k assumes:
Support holds
A bounce + reclaim of minor structure (above ~82k)
Targets:
TP1: ~83.2k (range midpoint / liquidity)
TP2: ~83.7k (previous consolidation)
Final Target: ~87.1k resistance (major supply zone + breakdown origin)
Bias Summary:
Short-term: Tactical long from support
Invalidation: Clean break and close below 80.6k
Overall trend: Still bearish until 87k is reclaimed
Takeaway:
This is a counter-trend long setup — high reward, but only valid if support holds and momentum flips. Conservative traders should wait for a confirmed reclaim above 82–83k before committing.

BITCOIN This Bearish Cross is the final confirmation of collapseBitcoin (BTCUSD) is currently past a Relative Vigor Index (RVGI) Bearish Cross on the 3M (quarterly) time-frame. This is a huge development as it is basically the last indicator to confirm the new Bear Cycle beyond any technical doubt.
Every time this took place historically, BTC was on the first quarter of a Bear Cycle. The consistency between those Bearish Cross formations is remarkable: 15 or 16 quarters (1369 - 1461 days) between each occurrence.
What's even more interesting is that following each RVGI Bearish Cross, the Bear Cycle bottomed in exactly 4 quarters, i.e. 1 year. This technically confirm our long-term expectation from previous analyses that the current Cycle should bottom around October 2026.
In addition to the RVGI, take a look at the 3M RSI. The quarter before the RVGI Bearish Cross topped on the 7-year Lower Highs trend-line, consistent with all previous Highs.
So what do yo think? Is the RVGI right to confirm the new Bear Cycle and pinpoint its bottom around October 2026? Feel free to let us know in the comments section below!
---
** Please LIKE 👍, FOLLOW ✅, SHARE 🙌 and COMMENT ✍ if you enjoy this idea! Also share your ideas and charts in the comments section below! This is best way to keep it relevant, support us, keep the content here free and allow the idea to reach as many people as possible. **
---
💸💸💸💸💸💸
👇 👇 👇 👇 👇 👇

BTC is now bearish long term!!!From what we're seeing bitcoin has completed its bullish cycle and has now become bearish in long term, we're expecting a bit sideways for now then the completion of a 5 wave bearish move and looking forward to a wave 2 correction to continue the downward move

EURUSD 1H – Demand Zone Rejection Setup EURUSD previously moved in a strong bullish channel, indicating healthy upward momentum. After reaching the channel high, price faced selling pressure and transitioned into a consolidation phase.
The marked demand zone is acting as a key resistance-turned-supply area. Price is currently reacting below this zone, forming a lower high structure, which suggests potential bearish continuation.
A rejection from the demand zone combined with the current structure opens the door for a pullback toward the lower support / target zone, highlighted on the chart.
Key Levels
Demand Zone: Upper red zone (sell pressure area)
Entry Area: Rejection below demand
Target: Lower red support zone
Trade Bias
Bias: Bearish below demand zone
Invalidation: Strong breakout and close above demand

SOLANA 2022 fractal shows crash to $30 is coming.Solana (SOLUSD) has been consolidating mostly within the last 2 months, with the 1W MA50 (blue trend-line) as its Resistance and the 1W MA200 (orange trend-line) as its Support. We have posted this chart more than two months ago, giving a timely sell signal to exit this market.
Based on the early 2022 price action, Stage 1 of that Bear Cycle was completed after a short-term rebound towards the 1D MA200 (red trend-line), which was rejected and initiated Stage 2. We expect that to be confirmed once the 1W MA200 breaks. Notice also the similarities between their 1W CCI fractals.
The minimum Target we have for the 2026 Bear Cycle is $30.00, which is both on the 0.618 Fibonacci retracement level from the previous Cycle bottom as well as the 2.78 Fib extension (blue) from the recent High and Low.
---
** Please LIKE 👍, FOLLOW ✅, SHARE 🙌 and COMMENT ✍ if you enjoy this idea! Also share your ideas and charts in the comments section below! This is best way to keep it relevant, support us, keep the content here free and allow the idea to reach as many people as possible. **
---
💸💸💸💸💸💸
👇 👇 👇 👇 👇 👇

BCHUSD H4 | Bearish Drop OffThe price could rise to our sell entry level at 584.62, which is a pullback resistance.
Our stop loss is set at 607.01, which is a pullback resistance.
Our take profit is set at 563.43, which is a multi swing low support.
High Risk Investment Warning
Stratos Markets Limited fxcm.com Stratos Europe Ltd fxcm.com
CFDs are complex instruments and come with a high risk of losing money rapidly due to leverage. 69% of retail investor accounts lose money when trading CFDs with this provider. You should consider whether you understand how CFDs work and whether you can afford to take the high risk of losing your money.
Stratos Global LLC fxcm.com Losses can exceed deposits.
Please be advised that the information presented on TradingView is provided to FXCM (‘Company’, ‘we’) by a third-party provider (‘TFA Global Pte Ltd’). Please be reminded that you are solely responsible for the trading decisions on your account. Any information and/or content is intended entirely for research, educational and informational purposes only and does not constitute investment or consultation advice or investment strategy. The information is not tailored to the investment needs of any specific person and therefore does not involve a consideration of any of the investment objectives, financial situation or needs of any viewer that may receive it. Past performance is not a reliable indicator of future results. Actual results may differ materially from those anticipated in forward-looking or past performance statements. We assume no liability as to the accuracy or completeness of any of the information and/or content provided herein and the Company cannot be held responsible for any omission, mistake nor for any loss or damage including without limitation to any loss of profit which may arise from reliance on any information supplied by TFA Global Pte Ltd.
Stratos Trading Pty. Limited fxcm.com
Trading FX/CFDs carries significant risks. FXCM AU (AFSL 309763), please read the Financial Services Guide, Product Disclosure Statement, Target Market Determination and Terms of Business at fxcm.com

BITCOIN isn't diverging from 2022 at all!Bitcoin (BTCUSD) continues to replicate the 2022 Bear Cycle almost in the exact same fashion. This is of course a concept we introduced back in October for the first time and so far it has fulfilled all conditions set in its way.
The most recent is the 1D MA100 (green trend-line) rejection, which in 2022 happened on March 02 and after another Support test, BTC rebounded for the final rejection on the 1D MA200 (orange trend-line). As mentioned before, that could be around $100k.
Assuming the 2026 Bear Cycle continues to repeat the 2022 price action, the next Support level should be around $70k, then $51-52k and finally around $45000.
So do you think it will unfold like 2022? Feel free to let us know in the comments section below!
---
** Please LIKE 👍, FOLLOW ✅, SHARE 🙌 and COMMENT ✍ if you enjoy this idea! Also share your ideas and charts in the comments section below! This is best way to keep it relevant, support us, keep the content here free and allow the idea to reach as many people as possible. **
---
💸💸💸💸💸💸
👇 👇 👇 👇 👇 👇

Potential bullish reversal?Ethereum (ETH/USD) is falling towards the pivot and could bounce to the 1st resistance.
Pivot: 2,956.16
1st Support: 2,814.66
1st Resistance: 3,162.22
Disclaimer:
The opinions given above constitute general market commentary and do not constitute the opinion or advice of IC Markets or any form of personal or investment advice.
Any opinions, news, research, analyses, prices, other information, or links to third-party sites contained on this website are provided on an "as-is" basis, are intended to be informative only, and are not advice, a recommendation, research, a record of our trading prices, an offer of, or solicitation for, a transaction in any financial instrument and thus should not be treated as such. The information provided does not involve any specific investment objectives, financial situation, or needs of any specific person who may receive it. Please be aware that past performance is not a reliable indicator of future performance and/or results. Past performance or forward-looking scenarios based upon the reasonable beliefs of the third-party provider are not a guarantee of future performance. Actual results may differ materially from those anticipated in forward-looking or past performance statements. IC Markets makes no representation or warranty and assumes no liability as to the accuracy or completeness of the information provided, nor any loss arising from any investment based on a recommendation, forecast, or any information supplied by any third party

DOGE Can we really time the Cycle bottom??Dogecoin (DOGEUSD) is already deep into its new Bear Cycle and basically since the October 06 2025 flash crash that hit its 1W MA350 (red trend-line) and rebounded, has been trading within that level as Support and the 1W MA50 (blue trend-line) as Resistance.
The 1W MA350 in particular is of the utmost importance as it held as Support during both previous Bear Cycles. As a result, if it breaks now, there are high probabilities to initiate Phase 2 of the Bear Cycle. This either bottoms on the 0.786 Fibonacci retracement level of Doge's historic Fib Channel Up at around $0.0600 or extend to a full -93.00% decline (as much as the previous two corrected by) around $0.03500.
Whatever the price bottom might be, history has shown that it is much more efficient to just buy at the right time rather than at the right price. And that's because the use of the Sinewaves have helped at not only timing the Cycle Tops but also the Cycle Bottoms. And according to this, the next bottom should be around October 2026. So whatever price Doge is trading at around that time, we turn again into long-term buyers.
---
** Please LIKE 👍, FOLLOW ✅, SHARE 🙌 and COMMENT ✍ if you enjoy this idea! Also share your ideas and charts in the comments section below! This is best way to keep it relevant, support us, keep the content here free and allow the idea to reach as many people as possible. **
---
💸💸💸💸💸💸
👇 👇 👇 👇 👇 👇

ADA About to Explode? Smart Money Is Loading!!!Yello Paradisers! Are you paying close attention? Because if you're not watching #ADA right now, you might completely miss the next explosive move. The breakout has already started, and smart money is already positioning Because #ADA broke out the descending resistance and start taking support, and if you're not prepared, you might miss out on a huge opportunity. Additionally, we are seeing selling climax has been formed, a classic probability that institutional buyers are stepping in. This is where things start to get exciting.
💎#ADA has just formed a classic selling climax, followed by a climactic action candle with ultra-high volume a textbook sign of accumulation. This is the kind of behavior we’ve seen over and over again when smart money starts positioning quietly before the real move begins.
💎After the selling climax, #ADA successfully swept liquidity of the selling climax a strong possibility that weak hands are out and stronger ones are stepping in. The key trigger now lies just above the upper line of the climactic action bar. If #ADA breaks above that level with a strong momentum candle, the next potential target lies at 4780, a major structural and resistance zone.
💎#ADA has officially broken out of its descending resistance and is now starting to retest that same line as new support a textbook shift in market structure. Further overall structure is shifted to bullish side on higher time frames as well, #ADA holds momentum within the within the Order Block + FVG zone the setup remains high probability targeting an initial upside move toward 4265, a key moderate resistance and structural level.
💎If momentum fades and a candle closes below 3247, the current bullish setup becomes invalidated. That would open the door to further downside pressure, and we’ll adapt accordingly.
That is why Paradisers, we are playing it safe right now. If you want to be consistently profitable, you need to be extremely patient and always wait only for the best, highest probability trading opportunities only on confirmations.
MyCryptoParadise
iFeel the success🌴

ETHUSD H1 | Potential Bullish ReversalThe price is falling towards our buy entry level at 2,880.38, which is a pullback support.
Our stop loss is set at 2,781.26, which is a pullback support.
Our take profit is set at 3,045.57, which is sn ovrlap resistance that is slightly below tthe 50% Fibonacci retracement.
High Risk Investment Warning
Stratos Markets Limited fxcm.com Stratos Europe Ltd fxcm.com
CFDs are complex instruments and come with a high risk of losing money rapidly due to leverage. 69% of retail investor accounts lose money when trading CFDs with this provider. You should consider whether you understand how CFDs work and whether you can afford to take the high risk of losing your money.
Stratos Global LLC fxcm.com Losses can exceed deposits.
Please be advised that the information presented on TradingView is provided to FXCM (‘Company’, ‘we’) by a third-party provider (‘TFA Global Pte Ltd’). Please be reminded that you are solely responsible for the trading decisions on your account. Any information and/or content is intended entirely for research, educational and informational purposes only and does not constitute investment or consultation advice or investment strategy. The information is not tailored to the investment needs of any specific person and therefore does not involve a consideration of any of the investment objectives, financial situation or needs of any viewer that may receive it. Past performance is not a reliable indicator of future results. Actual results may differ materially from those anticipated in forward-looking or past performance statements. We assume no liability as to the accuracy or completeness of any of the information and/or content provided herein and the Company cannot be held responsible for any omission, mistake nor for any loss or damage including without limitation to any loss of profit which may arise from reliance on any information supplied by TFA Global Pte Ltd.
Stratos Trading Pty. Limited fxcm.com
Trading FX/CFDs carries significant risks. FXCM AU (AFSL 309763), please read the Financial Services Guide, Product Disclosure Statement, Target Market Determination and Terms of Business at fxcm.com

BCHUSD H1 | Bullish Bounce Off Pullback SupportThe price is falling towards our buy entry level at 578.39, which is a pullback support that aligns with the 50% Fibonacci retracement.
Our stop loss is set at 561.98, which is a multi-swing low support.
Our take profit is set at 600.45, which is a multi swing high resistance.
High Risk Investment Warning
Stratos Markets Limited fxcm.com Stratos Europe Ltd fxcm.com
CFDs are complex instruments and come with a high risk of losing money rapidly due to leverage. 69% of retail investor accounts lose money when trading CFDs with this provider. You should consider whether you understand how CFDs work and whether you can afford to take the high risk of losing your money.
Stratos Global LLC fxcm.com Losses can exceed deposits.
Please be advised that the information presented on TradingView is provided to FXCM (‘Company’, ‘we’) by a third-party provider (‘TFA Global Pte Ltd’). Please be reminded that you are solely responsible for the trading decisions on your account. Any information and/or content is intended entirely for research, educational and informational purposes only and does not constitute investment or consultation advice or investment strategy. The information is not tailored to the investment needs of any specific person and therefore does not involve a consideration of any of the investment objectives, financial situation or needs of any viewer that may receive it. Past performance is not a reliable indicator of future results. Actual results may differ materially from those anticipated in forward-looking or past performance statements. We assume no liability as to the accuracy or completeness of any of the information and/or content provided herein and the Company cannot be held responsible for any omission, mistake nor for any loss or damage including without limitation to any loss of profit which may arise from reliance on any information supplied by TFA Global Pte Ltd.
Stratos Trading Pty. Limited fxcm.com
Trading FX/CFDs carries significant risks. FXCM AU (AFSL 309763), please read the Financial Services Guide, Product Disclosure Statement, Target Market Determination and Terms of Business at fxcm.com
