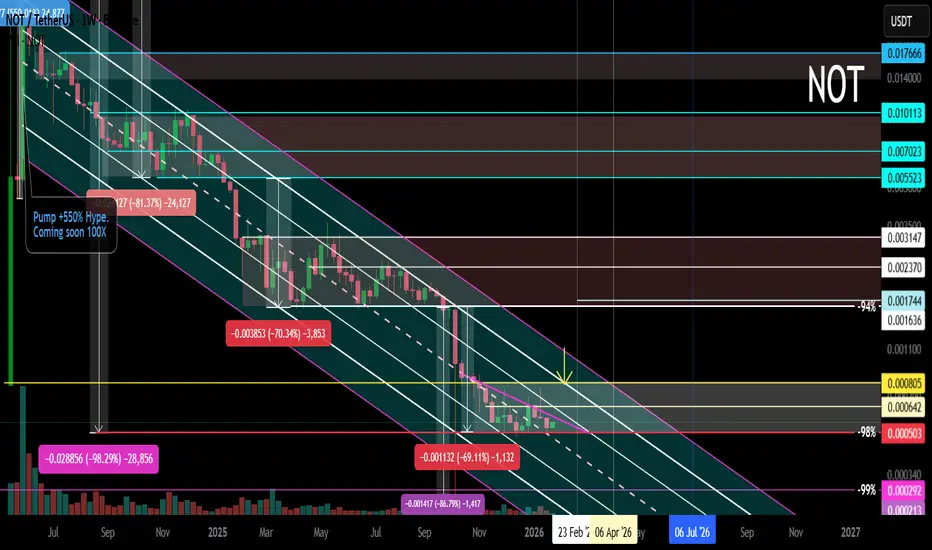
NOT Main Trend. Descending Channel -98% 01/27/2026Logarithm. Time frame: 1 week.
The price is in the main trend and remains in a downward channel with a given volatility range.
It's important to understand that the creators of this cryptocurrency always sell at any price (they're created for profit, fueled by hype). However, at low prices (-94-99%), a dilemma arises:
1️⃣ invent a reason for a scam and abandon the project;
2️⃣ or reverse the trend and temporarily restore faith in this scam cryptocurrency. In order to continue sales.
You can use this and profit from it. But, in the long term, you should be cautious with such assets. This applies to absolutely all cryptocurrencies created for hype and without any real future use. When trading such a dying former super-hype, manage your risks. This is the basic principle. If you can't do this, avoid it.
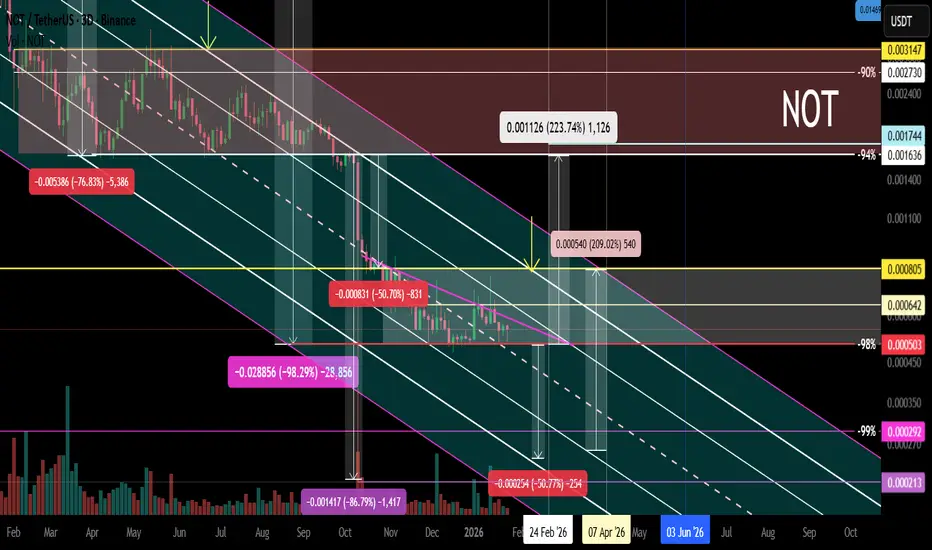
NOT Local trend. Sideways. -98%. Reversal zones 27 01 26
Cryptocurrrency
NOT Local trend. Sideways -98%. Reversal zones 27 01 26Logarithm. 3-day time frame.
The price in the main trend is still in a downward channel with a given volatility range.
Medium-term - locally , another sideways trend has formed (the third in a downward channel), but the decline is already -98% (not counting the futures long, which was previously down by -99%). Typically, such low-liquidity hype scams decline by -94-98% (with rare exceptions of -99% or a complete scam project, based on some fiction).
It's important to understand that the creators of such cryptocurrencies always sell at any price (they're created for profit, under the hype). But at low price levels (-94-99%), a dilemma arises:
1️⃣ invent a reason for a scam and abandon the project;
2️⃣ or reverse the trend and temporarily restore faith in the scam cryptocurrency. This will, in turn, continue selling.
You can exploit this and profit from it. But, in the long term, it's best to be cautious with such assets. This applies to absolutely all cryptocurrencies created for hype and with no real future use. When trading such dying former super-hypes, manage your risks. This is the foundation. If you can't manage it, avoid it.
BTC Running Flat?Looks like a running flat correction on BTC with B wave completing at the $86k low
May see C wave soon $100k+

QNT Main Trend. Triangle. Distribution. January 2026Time frame: 1 week. After a 147,000% pump, a large symmetrical triangle forms in the distribution zone (this is possible due to the limited supply of only 14.88 million coins, and the concentration of the bulk of the volume among the creators). Reversal zones and percentages to key support/resistance levels are shown.

QNT Secondary. Pump 147,000% Distribution. Triangle 01 2026Logarithm. Large triangle in the distribution zone. Price is pinched into a corner. Percentages to key support/resistance levels are shown.
Main trend.

FET global trend. Ascending channel. Wedge. AI hype. 01 2026Logarithm. 1-month time frame. Linear chart without market noise. The idea is to visually understand the long-term trend direction of this cryptocurrency. The AI monopolists—giants of the non-cryptocurrency world—are using it.
Medium-term and local.
FET secondary trend. Wedge. Fractals. AI hype. January 2026

FET secondary trend. Wedge. Fractals. AI hype. January 2026Logarithm. 1-week time frame. Classic trading based on reversal zones and the resulting wedge formation.
This zone is in the main trend (entire trading history). 1-month time frame. Suitable for long-term investment for those for whom trading is not their occupation.
FET global trend. Ascending channel. Wedge. AI hype. 01 2026
Markets move according to their market phases:
1) accumulation + sometimes part of it capitulation;
2) participation, that is, a price rise towards distribution;
3) distribution + sometimes part of it super hype;
4) decline, that is, a price drop towards accumulation zones and a repetition of the "golden ring of Baal's calf (Baal)"...
That is, markets move according to the seasonality of the action of large capital “without personal” (supply/demand).

ETH (JPMorgan) Global Trend. Channels. Reversal Zones 01 2026Logarithm. 1-month time frame. Linear chart without market noise. This chart is intended to visualize the long-term trend direction of this blockchain for cross-border capital banking structures.
Medium-term and local, from the perspective of the main trend, from this reversal zone, percentages to key support/resistance zones (buyer/seller interest).

BTC Primary trend. Secondary - expanding triangle.Logarithm. Time frame 1 week. Linear for clarity. Now the price is in consolidation in the key resistance zone of the "psychology 100" zone. Everything is as before, nothing new.
The price moves from dynamic zones of support and resistance of the large channel, and with the observance of the proportions of decreasing % from the previous maximums and minimums, adhering to a conditional 4-year cyclicality. Which is also initially embedded in the Bitcoin halvings, and the understanding of increasing demand, with a decrease in supply through halvings (but, here is a nuance with ETF, that is, conditionally with "fake bitcoins", which significantly increases the supply).
With a huge degree of probability, in the next cycle (possibly the final one), Bitcoin will be driven above or around $ 1 million, depending on the maximum that will be set in this cycle. Perhaps it will be much higher (parabolic growth as at the end of 2017) than the average distribution price. Mass digitalization is underway... and there are more and more dollars, they need to be somehow utilized in the future.
I specifically refreshed the old ideas of the main trend (2 and 3 years ago published) of this scale, and made it on a linear chart, for greater visualization of the trend direction and patterns that are formed on a smaller scale.
BTC/USD Secondary trend cycles and halvings. 1 07 2022
BTC/USD Halving 518 When will the minimum and maximum price be cycles. 27 09 2023

LTC global trend. Ascending channel. Triangle. January 2026Logarithm. 1-month time frame. Linear chart without market noise. Designed for visual understanding of long-term trend direction.

HBAR global trend. Ascending channel. Triangle. January 2026Logarithm. 1-month time frame. Linear chart without market noise. Designed for visual understanding of long-term trend direction.

TRX Global Trend Channel Rising Wedge. January 2026Logarithm. 1-month time frame. Linear chart without market noise. Designed for visual understanding of long-term trend direction.

XRP Global Trend. Ascending Channel. Triangle. January 2026Logarithm. 1-month time frame. Linear chart without market noise. Designed for visual understanding of long-term trend direction.

XLM global trend. Ascending channel. Triangle. January 2026Logarithm. 1-month time frame. Linear chart without market noise. Designed for visual understanding of long-term trend direction.

ZEN Main Trend (anonymous) 01/15/2025Logarithm. Time frame: 1 week. A very long horizontal channel with a large increment, with the price being pulled toward its resistance. A conditional fractal on a smaller scale is observed, with a previous local pump and a false exit from the channel range. The overall trend reversal and transition to phase 3 of the trend pump bowl occurs only after a breakout and consolidation above the descending line of the main trend (indicated by the thick red line).
Research online to find out what, how, who the investors are, and at what price this "investing" is. When trading, manage your risks, as the channel is very long and there are many passengers. Medium-term interest rates and logic are shown.
Locally now Time frame: 1 day.

OrAI (Orachain) AI. Trend. Death, or a Little Later? 01 11 2026Logarithm 1 week. The idea is more educational. In my opinion, it's a dying project simulating utility, fueled by the hype of AI agents. During the hype, it was around $100-$80. Now it's $0.64. That's a price drop of -99.4%. Just think about it...
I also specifically showed buying at the “bottom” between -99 and -99.4, a whopping -40%.
Therefore, when trading something like this, you need to understand that TA (besides understanding the trend direction and reversal zone on a large time frame), the logic of price movement on assets with such liquidity (the "developers pouring in" money and the crowd joining in), is a convention, especially in terms of support/resistance levels.
If desired, the creators of such crypto projects can achieve instantaneous death (sell their remaining crypto coins at the market price and come up with an excuse, such as "we were hacked").
Or, conversely, they can create a “pump stick” with a large percentage, followed by a huge amount of positive news on the community's social media to "restore the faith" of holders and traders. The same applies to selling remaining coins. If you, as a trader, control your risks by following risk management and understand the nature of manipulation, you can catch this moment and profit from it.
🔵 Main trend . A descending channel with a large percentage increment. Developers pump a large percentage and sell while there is liquidity. Then they delist from exchanges and die. Several similar projects, with “new faces” of creators, have already been created using the proceeds to fuel hype. This is practically the case, and we must accept this. The price is at dynamic support within the internal channel. A rebound would be rational (to sell off the remaining stock before delisting from the exchanges with the main liquidity where it is traded) if the market turns green on or around January 17th.
🟡 Secondary Trend . The targets of the huge "head and shoulders" pattern have been realized, with impressive pumps in part of the formation due to low liquidity at +1000%, and, naturally, similar corrective movements.
🟣 Local Trend . The -88% target of the second component of the pattern, namely the descending flag, is currently being realized. The % targets according to the classic TA have not yet been fully realized (not necessarily to the exact %), but are close to completion. The decline has currently stopped at the dynamic support of the main trend within the internal channel. If a reversal occurs from this zone or slightly below, I've shown the percentage for orientation. What's important for the chart is a breakout of the local downward trend (highlighted in purple). In the long term, and perhaps even in the medium term, this could spell the end of the project. It will be interesting to follow up in the future and see how they proceed.

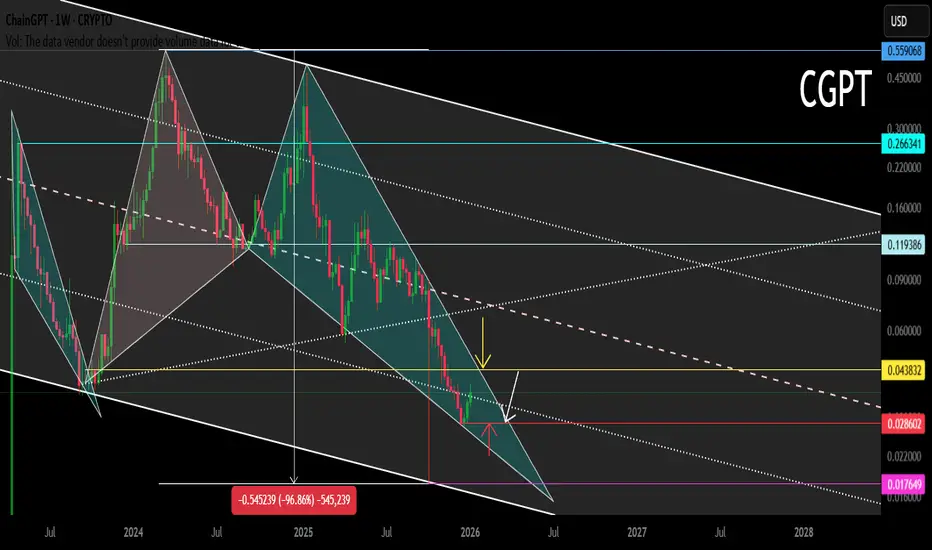
CGPT (ChainGPT) Main Trend. Channel. AI. January 11, 2026Time frame: 1 week. Another project under the hype of AI, which is developing slightly now and will grow strongly in the future. A descending channel in which a descending wedge is forming (the second wave of the structure). A breakout of the wedge (dynamic resistance) is a trend reversal. I showed two options (working for a breakout):
1) a breakout of the wedge from the current zone (internal support of the channel of the large formation).
2) a breakout of the wedge near the external support zone of the ascending channel of the main trend.
AITECH Main trend Channel Wedge. Reversal zones. AI. 30 07 2025Logarithm. Time frame 1 week. Main trend. Huge pumps for hype. The price is driven up on dexes, and profits are realized on centralized medium and low liquid exchanges. Important. Twitter (X) of the project has 560 thousand subscribers. That is, at the right time there will be a flow of positive news for subscribers who are former holders, or potential buyers (there are most of them, they buy only very expensive ones) and pumping as before, but by a smaller percentage.
And while in the ascending channel, the decline phase forms a descending wedge in the secondary trend. A triangular formation has formed in the local trend. The logic of the reversal zones is shown with arrows.
What is it. From the marketplace:
Solidus AI Tech is building one of Europe's first Web3-based AI infrastructures, powered by a state-of-the-art, green HPC data center. The $AITECH token powers an ecosystem of products that combine AI utilities, scalable computing, and Web3 tools, empowering developers, enterprises, and institutions to easily build, deploy, and scale AI solutions.
With the support of major partners including NVIDIA, IBM, Fetch.ai, Tron, BNBChain, Binance Wallet, Trustwallet, and many more, Solidus AI Tech is becoming one of the most advanced and adaptable Web3 AI token projects, positioning itself among industry leaders.

SHELL Main Trend. Channel Platform AI. January 10, 20253-day logarithm. Current decline from the high (not a listing squeeze) is -91%. This is low for such liquidity, but if there is a breakout of the local downward trend, the trend will reverse first to the channel resistance, and then we'll see.
Percentages from key support/resistance zones for clarity and for building your trading and money management tactics.
What is it? MyShell is a platform for AI users, enabling anyone to create, share, and own AI agents. The team combines AI and blockchain through agent frameworks, open-source models, and a community of AI creators. MyShell also provides users with AI-powered entertainment and useful features, offering shared ownership.

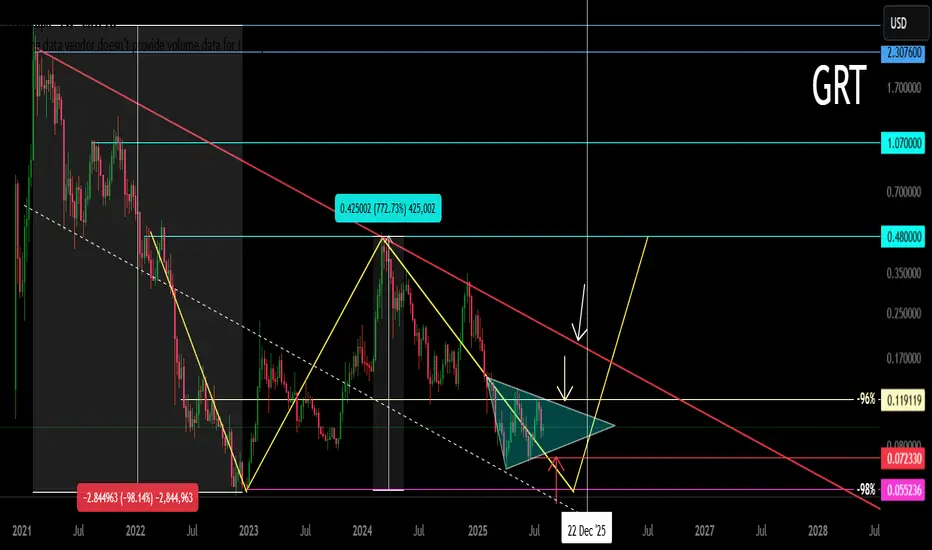
GRT Main Trend (addition) Double Bottom + Triangle 08 2025Logarithm. Time frame 1 week.
Main trend . Supplement for clarity to the previous idea for this cryptocurrency, published 23 02 2025 Everything is essentially the same, the new idea is made to visualize the trend, nothing more.
GRT Main trend.
Line chart, price now
Secondary . Big double bottom (in any case, with local scenario A or B, it will be realized in the medium term).
Local trend (price movements in the trend minimum zones before a big pump). Triangle above the Gann fan ray (see the previous idea, where this tool of the logic of movement in the trend is shown).
The second wave of the triangle is formed.
A downward breakout is a descending pennant, which is the removal of longs under the pattern of a larger scale of historical minimums.
A upward breakout is the realization of the triangle targets, and the price movement to the descending line of the main trend +80-100%
MEW Main Trend. Memcoin. 2025 07 02Logarithm. Time frame 3 days.
Cat in a dogs world (MEW)
X -133 thousand subscribers (this is not enough).
Reduction from the maximum -87%. For such assets, this is not enough.
I imposed a descending channel on the chart (current descending trend of the main trend), and a horizontal one, if by some miracle this local Ross hook is broken upwards (not forming a local head and shoulders), not only to the resistance of the secondary trend (red line), but to break through it. Percentages to key zones of support/resistance levels are shown for clarity.
After the downward trend is broken, such "psychological-fundamental" assets are usually pumped up by +800-1000% from the minimums or more. Low liquidity, and the contingent of people who subscribe to these projects, allows this to be done easily at the right time: "the hamster is not scared". After pumping — a slow death, with pumps an order of magnitude smaller. Therefore, do not forget to sell in the alt season.
When working with such cryptocurrencies by liquidity, observe money management, use partial entry or on a breakout. Do not use margin leverage, as there may be snot in any direction for a large percentage, which will lead to liquidation "out of the blue".

Will ZCash go Down?What Zcash (ZEC) Actually Is:
Zcash is a privacy-focused cryptocurrency that was created in 2016 as an alternative to Bitcoin.
Kriptomat
Key features: Like Bitcoin, it’s a digital currency with a limited supply and proof-of-work consensus.
The major difference is optional privacy:
ZEC uses zero-knowledge proofs (zk-SNARKs) to allow private, encrypted transactions where the sender, receiver, and amounts are hidden. Users can choose shielded (private) or transparent transactions depending on their needs. So its value proposition is privacy, which appeals to people who want more confidentiality than Bitcoin’s public ledger offers.
Why Zcash Has Surged Recently
In 2025, Zcash has had strong rallies, even outperforming many other cryptos:
Possible reasons for the recent run:
1) Privacy coin demand:
Privacy coins like Zcash and Monero have outpaced most sectors in 2025. Rising interest in digital privacy and financial confidentiality boosts demand for privacy-focused tokens.
2) Technical breakout and adoption:
Innovations (e.g., protocols like Zashi CrossPay expanding use cases) can push utility and liquidity.
3) Market rotation:
Some analysts believe traders rotate capital from Bitcoin into altcoins like ZEC when BTC is tiring or consolidating, which can lift ZEC even when BTC isn’t rising strongly.
Why Zcash Can Go Down
1) Correlation with Bitcoin:
Even if ZEC can decouple, crypto markets still broadly move together. In periods when Bitcoin rallies strongly, many altcoins also rise because market sentiment improves. Conversely, if BTC drops to $70–60k or weaker conditions return, liquidity often shifts back to BTC, and many altcoins, including ZEC, may fall too.
2) Negative or weak correlation is fragile:
Some observations show Zcash can have inverse or low correlation with Bitcoin, meaning sometimes it rises when BTC falls. But that relationship is not stable, and if the overall market environment turns bearish again, that correlation can weaken or reverse.
3) Profit-taking and volatility:
After strong rallies, traders often take profits, which can cause sharp corrections. Liquidity is relatively thinner than major assets, so price swings can be abrupt.
4) Regulatory risk:
Privacy coins face increased regulatory scrutiny, which can dampen demand if governments restrict or delist privacy-focused tokens.
How Bitcoin (BTC) Affects Zcash
Bitcoin is still the dominant market driver in crypto:
Many altcoins historically move with BTC’s direction, up in bull markets and down in bear markets.
Even if ZEC occasionally outperforms or diverges, prolonged declines in BTC often reduce overall crypto risk appetite, negatively impacting altcoins. So if BTC falls significantly (e.g., to $70–60k), ZEC may face selling pressure too, even if it has its own narrative, because: investors tend to exit riskier assets first; funds rotate back into BTC as the “safe crypto”; liquidity for smaller assets dries up faster
Disclaimer:
This analysis is for informational and educational purposes only and does not constitute financial advice, investment recommendation, or an offer to buy or sell any securities. Asset prices, valuations, and performance metrics are subject to change and may be outdated. Always conduct your own due diligence and consult with a licensed financial advisor before making investment decisions. The information presented may contain inaccuracies and should not be solely relied upon for financial decisions. I am not a licensed financial advisor or professional trader. I am not personally liable for your own losses; this is not financial advice.

ETC Secondary Trend 4.9 Year Triangle (like XRP) 10/2025Logarithm. Time frame: 1 week. Declines from the high in the secondary trend, as before -92%. Formation of the #accumulation zone. Price is being squeezed into a corner.
🔵 Main trend — ascending, rising channel, since the inception of cryptocurrency.
🟡 Secondary trend — downward, transition to a sideways trend - #accumulation, and formation of a 4.9-year symmetrical triangle.
🟣 Local trend — downward, squeezed into the corner of a large triangle and "tension" consolidation before an exit.
Main Trend
Control your risks and stick to your trading plan. Don't get caught up in market and news noise, which shapes dominant opinions and the illogical actions of the majority, which are doomed to lose in the future.
Everything will be as it usually is with assets (stocks, cryptocurrencies, less often, are just a few examples of how these are not real assets, but imitations of usefulness, that is, a complete scam market), which have been around for a long time. For a while (from the very beginning), the upward primary trend is maintained, and huge, multi-year patterns are formed near dynamic support. That is, an upward breakout , perhaps initially throwing passengers under the market , or some fictitious cryptocurrency events before a price rise (on a large time frame). Don't be alarmed, but ignore them, or use this opportunity to reduce the average price of the overall position. Or rather, before a dominant trend change, the "point of no return."
A striking example of this is XRP with its huge triangle and its exit (the first wave +600%, which is a capitulation on profits, or, in slang, a "hamster pump"). Then 2-3 waves of price pumps, where at each consolidation in the trend they will "bury" and cry "all is lost." In the last wave, possibly with spikes as before, a full-fledged #distribution zone will form.
XRP/USD Main trend 07 2022
