Chainlink (LINK) Price Eyes a Push Toward the Top of Its Channel* The Chainlink price is trading inside a tight channel, with momentum slowly starting to pick up.
* On-chain data indicates steady, real network usage rather than short-term speculation.
* LINK is approaching the top of its channel, a level that could shape the next move.
If you step back and look at what Chainlink has been doing lately, one thing stands out right away: nothing feels rushed. There’s no panic, no aggressive selling, and no breakout mania either. LINK is just moving sideways inside a tight range, and that kind of price action tends to make people tune out because it feels boring.
For a while now, the LINK price has been slowly compressing inside its channel. Every bounce runs into resistance, and every dip finds buyers waiting. It’s the kind of market that feels awkward to trade because nothing follows through. Momentum traders lose interest, and the broader narrative around LINK goes quiet.
That’s exactly why this phase is important. LINK isn’t falling apart. Buyers are clearly defending the $12–$13 area, and sellers haven’t managed to push the price meaningfully lower. At the same time, buyers aren’t quite strong enough yet to break through the top of the channel. The market is paused, not weak.
This setup is nothing new for Chainlink. In past cycles, similar low-volatility stretches showed up near the end of long consolidation periods. Volume dried up, momentum flattened, and the price went nowhere long enough for most people to stop watching. When that happened, LINK often moved once expectations were low and positioning had thinned out.
On-chain data backs this up. Market cap has been creeping higher, active addresses are still rising, and transfer activity looks steady. That points to ongoing network use and gradual positioning, not speculation or large-scale selling.
So what comes next for LINK?
At this point, structure matters more than hype. As long as the LINK price holds its support zone and continues tightening beneath resistance, the setup stays intact. A move toward $14.63 with stronger volume would start putting real pressure on sellers.
Right now, LINK isn’t grabbing headlines. Price is grinding, volatility is low, and excitement is missing. But those quiet phases are often when things start to shift, especially for an asset that tends to move once the market stops paying attention.
Crytpocurrency

Cardano Price Analysis: ADA Flashes Familiar Signals* ADA is again flashing a bullish divergence on the 3-day chart, a pattern that's preceded solid rallies several times in the past.
* However, the price of Cardano remains near stubborn levels of resistance that may hint that this movement could take some time and won't appear overnight.
* Whether ADA is building a solid base or needs more patience will come down to how price reacts around its most important support and reclaim zones.
When you step back and look at Cardano’s recent price action, one thing stands out. The market isn’t panicking; there’s no rush to sell, no sharp breakdown, and no sense that traders are trying to get out at any cost. Instead, ADA has settled into that uncomfortable middle ground where price just drifts.
For a while now, the ADA price has been hovering around the low-$0.30s. That kind of slow, sideways movement drains attention. Narratives cool off, and conviction fades simply because there’s no action to react to. It’s dull, and that’s often when markets start to matter.
What’s important is that ADA isn’t accelerating lower. Each dip into support tends to find buyers, while every bounce runs into resistance and fades. Sellers aren’t pushing aggressively, but buyers also aren’t ready to take control. The market is paused, not breaking.
This behavior isn’t new for Cardano. In past cycles, similar low-volatility stretches showed up late in consolidation phases. The ADA price went nowhere long enough for many traders to stop paying attention. Then, once positioning was light and expectations were low, structure shifted quickly.
On-chain data supports that view. ADA’s market cap has stayed within a relatively narrow range, and the recent drift hasn’t come with signs of panic. That points more toward digestion than fear.
What’s next for ADA?
What comes next will come down to structure, not sentiment. As long as price holds support in the low-to-mid $0.30s and continues to compress under resistance, the setup stays intact.
ADA isn’t making headlines right now, but this kind of quiet phase often matters more than it looks.

Is XRP Price About to Repeat a Familiar Market Pattern?* The XRP price movement has been ranging, mirroring the calm market action that often precedes significant price movements.
* On-chain data indicates that market participants are not leaving the market but rather just losing some excitement, which always calls for attention.
* The $2.10 level remains the boundary level; only a breakout can change the scene.
When you zoom out and look at XRP’s recent price action, it’s clear the market isn’t panicking. There’s no rush to sell and no sharp breakdown. After reaching a recent top, XRP has been settling into a slow sideways trend that is just awkward because there is simply a lack of action.
For the past few weeks, the XRP price has been stuck in a range. That kind of action tends to drain attention. Traders get bored, narratives fade, and conviction slowly slips away.
That’s exactly why this phase matters. The XRP price isn’t accelerating lower. Every dip will attract buyers, while every rally will falter as it reaches the resistance level. Sellers are not pushing, nor are buyers committed to breaking past them. The market is simply in a pause, not in a position to break out.
This pattern is familiar for XRP. In past cycles, similar stretches of low volatility showed up late in consolidation phases. Volume dried up, momentum flattened, and the price went nowhere long enough for most people to stop paying attention. Then, once positioning was light, structure shifted quickly.
On-chain data supports that view. XRP’s market cap has held steady during this range, and network activity hasn’t dropped off sharply. That indicates digestion, not panic.
What’s next for XRP?
From here, what matters is structure, not sentiment. As long as the XRP price continues to hold its lower support zone while compressing beneath resistance, the setup stays intact.
This phase doesn’t reward impatience, but historically, it’s been the kind of environment where XRP has caught traders off guard once attention shifts elsewhere.
Right now, XRP isn’t making headlines. It’s grinding sideways, volatility is low, and excitement is missing. But that quiet behavior is exactly what makes this setup worth watching.

ONDO 15m Apex - LONG 5-10%ONDO here, 15m chart. Currently settling into an apex play. Getting pinched between the 100ma and the 200s.
I’m thinking .50 target, like maybe 10%. Stop loss should be around .5% or 1% depending on your risk tolerance and leverage size.
Invalidate if candles close below the 15m white 100sma.
Hit me up if y’all have any questions or requests.

is bitcoin ready to bounce ?after 36% crash price testing major trend line after NYC fed williams turned dovish on 21 November
compared gold and silver , bitcoin is only this which looks cheap here.
if trend line holds then bitcoin looks ready for short term bouce

ETHEREUM HIGH PROBABILITY LONG SETUP SOON!!!🚨 ETHER HIGH PROBABILITY BUY SETUP 🚨
* Here We Can See Clearly The Next Potential Moves For ETHUSD Coming Hours/Days.
* Keep Your Eyes Close On Your Trading Positions.
* Happy PIP Hunting Traders.
FXKILLA.

Downside protected, upside unprotected — BTC to 500kThere's a ton of intriguing action unfolding with Bitcoin right now. Several cycle low indicators I track have started firing off around the $80K mark—pretty wild if you ask me. Let's break them down step by step.
1. 2-Week RSI Signal
It's a straightforward fact: the two-week RSI is sitting at 42, a level that has consistently marked cycle lows in the past. So, at $80K, we've got our first major cycle low signal.
2. Fear & Greed Index
Historically, after a cycle top, the first wave down has driven the Fear & Greed Index to a reading of 10 in the last two cycles.
The rest of the time? It's signalled cycle lows or major bottoms ahead of massive rallies.
#### What This Means: History Rhyming (Again)
This setup screams repetition—Bitcoin has now topped out after exactly 1,064 days, mirroring the last two cycles. On this first corrective wave, Fear & Greed has already plunged to 10. But here's where it gets really telling: layer in the Sharpe ratio for some nuance.
As the chart shows, the Sharpe ratio has dipped into negative territory—a rare event that *only* occurs during true cycle lows.
Invalidation & Bear Market Confirmation
The chart makes it crystal clear: Bitcoin is primed to echo the last cycle's playbook, with a full rejection at the 0.382 Fibonacci retracement. In the prior two cycles, after the initial drop from the cycle high, any subsequent rally completely fizzled out right there at 0.382.
If Bitcoin fails to rally and close decisively above that level by mid-January 2026, the odds skyrocket for a full-blown bear market. Keep an eye on it—this could be the pivot that defines the next leg.
What do you think then?
500k or 67k by October 2026?
Still fully on the upside boat. Risk is heavily skewed to the top side, not down

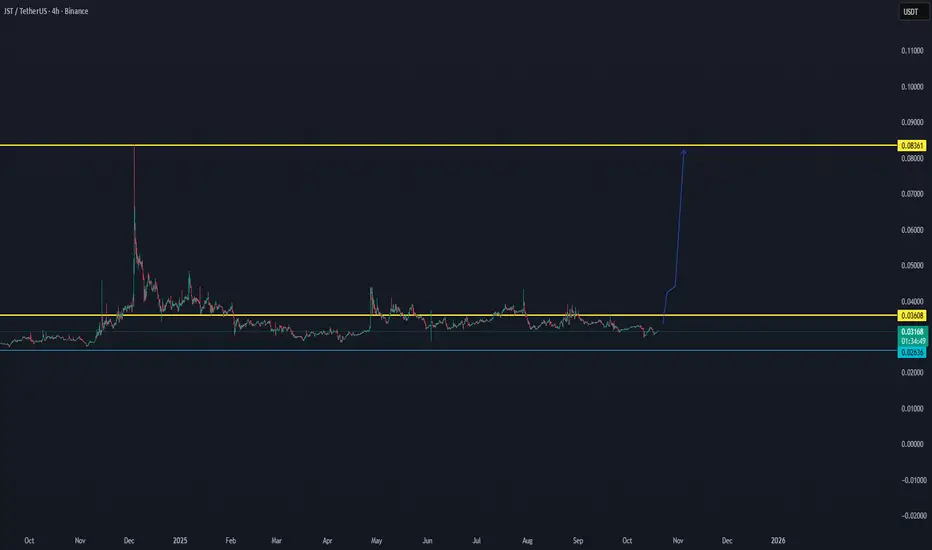
JST/USDT Second BREAKOUT ON WAY..Data view shows that there is a high chance JST can break out for the second time since the last volume data. We will follow these coming time frames to see what is able to do.
DMTR/USDT - ABSOLUTE GEM!! x50 MINIMUMTargeting the 0.003/35 area! Strong bounce and strength since last weeks crash - Real giant in RWA and AI sectors proven tech and innovation - BUYING ANY FURTHER DIPS BUT CONFIDENT OF UPWARDS PRICE - DONT SLEEP ON DMTR OVER THE NEXT 12months!! SEND ITTTT

Bitcoin Eyes $116.6K Breakout Confirmation📊 Market Update — Bitcoin (BTC/USDT)
BTC has successfully confirmed the low time frame zone, holding steady above both the support and volume range, which signals continued short-term strength.
Currently, price action is consolidating within the upper boundary of the range — a sign of buyer absorption before potential expansion.
🔹 Key Level to Watch: $116.6K
This level acts as an important confirmation point — a 1-hour (or higher) close above this zone could validate a breakout continuation, opening the path toward the $120K–$125K range.
If BTC sustains this structure, the bullish momentum remains intact, with low time frame structure aligning with higher trend support.
📈 Bias: Bullish Continuation
🎯 Next Targets: $116.6K → $120K → $125K

Bitcoin Bullish Scenario: Bitcoin Bullish Scenario:
*Expecting price to retrace to 50% of current daily trend range and bounce back to may another All time High.
*Purple area is Support for current bullish trend.

JOE ANALYSIS📊#JOE Analysis
✅There is a formation of Descending triangle pattern on daily chart🧐
Pattern signals potential bullish movement incoming after a small retest 📉
👀Current Price: $0.1944
🚀 Target Price: $0.2370
⚡️What to do ?
👀Keep an eye on #JOE price action and volume. We can trade according to the chart and make some profits⚡️⚡️
#JOE #Cryptocurrency #TechnicalAnalysis #DYOR

BB ANALYSIS🔆#BB Analysis : Channel Following ⛔️⛔️
As we can see that #BB is following ascending channel on daily time frame. We can see a bullish formation here. And if it trade with good volume then we can see a proper bullish move in #BB 📈📈
Also there is an instant resistance zone and if it breaks with good volume when we would see a huge movement
🔖 Current Price: $0.1714
⏳ Target Price: $0.2323
⁉️ What to do?
- Keep your eyes on the chart, observe trading volume and stay accustom to market moves.🚀💸
#BB #Cryptocurrency #ChartPattern #DYOR

DOGE ANALYSIS🔮#DOGE Analysis 💰💰
#DOGE is trading in a symmetrical triangle in a weekly time frame and breakouts with high volume and we could see a bullish momentum in #DOGE. Before that we will see little bit retest and then bullish movement
🔖 Current Price: $0.28110
⏳ Target Price: $0.43210
⁉️ What to do?
- We can trade according to the chart and make some profits in #ARKM. Keep your eyes on the chart, observe trading volume and stay accustom to market moves.💲💲
#DOGE #Cryptocurrency #Pump #DYOR

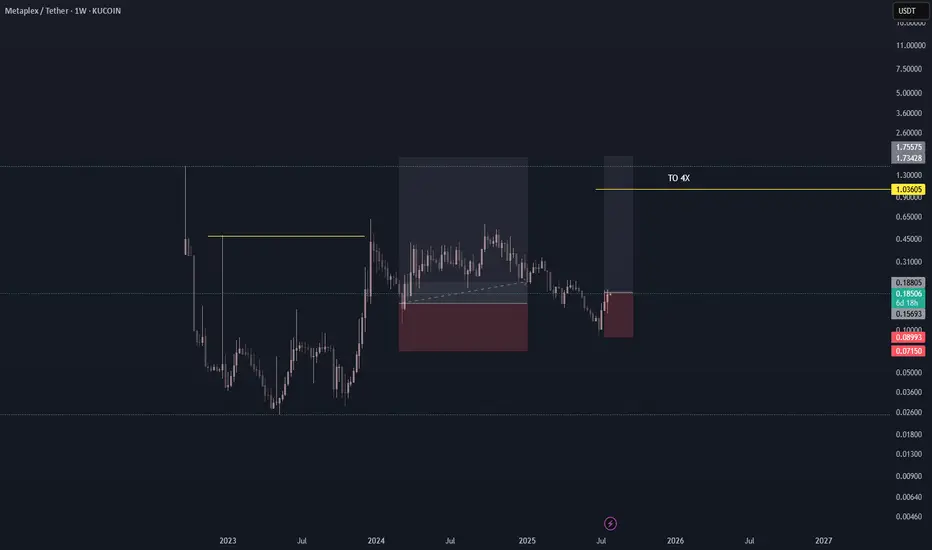
METAPLX/USDT BUY LONG FOR 4XCRYPTO - METAPLEX/USDT
EXPECTED RETURN TO 400-500%
** Crypto investing is highly volatile, you may lose all invested money, please keep it in mind and invest what you can lose and be ok.**
Here's Why XLM is on the Verge of a Massive breakoutThe next 10 years of success for the Stellar Network (XLM) are being shaped by decisions, developments, and trends happening right now (2024–2025). Here’s a breakdown of the long-term shaping factors currently in motion that will influence Stellar's trajectory through 2035:
------------
🌍 1. Real-World Use Cases Being Built Now
Stellar is not waiting for hypothetical adoption — it’s already deploying use cases that are foundational to its future success.
Examples:
MoneyGram Access gives real people the ability to cash in/out of crypto in over 180 countries.
USDC on Stellar enables stablecoin remittances with instant settlement and low fees.
Stellar Aid Assist provides governments and NGOs a working model for humanitarian digital cash aid.
Long-Term Impact: Building trust and infrastructure in the real world now means exponential network effects later — especially in emerging markets where crypto utility > speculation.
-------------------------------------------------------------------------------------------
🛠️ 2. Soroban (Smart Contracts) Rollout
Stellar is rolling out Soroban, a Rust-based smart contract platform that will transform the network into a programmable blockchain.
Why Soroban is Important:
Enables DeFi, lending, NFTs, on-chain identity, and DAOs.
Designed for predictable gas fees, making it ideal for finance and compliance.
Makes Stellar more competitive with Ethereum, Solana, Avalanche, etc.
Long-Term Impact: Soroban turns Stellar into a platform where real, decentralized applications can live — critical for long-term value capture and developer retention.
-------------------------------------------------------------------------------------------
🌐 3. Laying Global Payment Infrastructure
Stellar is quietly building global payment rails through partnerships with:
Fintechs (MoneyGram, Leaf, Settle, Cowrie)
Stablecoin issuers (Circle for USDC, Novatti for AUDC)
Payment aggregators in Africa, Latin America, Southeast Asia
Long-Term Impact: By 2030, these partnerships could evolve into a globally interconnected network of on/off ramps, anchors, and stablecoins. This gives Stellar real utility far beyond speculation.
-------------------------------------------------------------------------------------------
🏛️ 4. Regulatory Alignment & Compliance Tooling
The Stellar Development Foundation (SDF) is heavily involved in regulatory dialogue, including:
Working with the BIS Innovation Hub and IMF working groups
Building on-chain compliance tools (e.g. KYC/AML anchor guidelines)
Developing the Stellar Disbursement Platform, which complies with aid distribution requirements
Long-Term Impact: As crypto becomes more regulated, networks that built with compliance in mind will thrive. Stellar is positioning itself as a compliant blockchain for finance, especially for governments and NGOs.
-------------------------------------------------------------------------------------------
💸 5. Tokenization of Real-World Assets (RWAs)
The future of blockchain is heading toward tokenizing everything — and Stellar is already positioning itself at the front of that movement.
Franklin Templeton tokenized a U.S. mutual fund on Stellar.
Stablecoins like USDC and native fiat tokens are in active use.
Discussions are ongoing around CBDC pilots and tokenized bonds.
Long-Term Impact: The network that supports the most trusted tokenized assets — from CBDCs to real estate to securities — will gain enormous value from volume and liquidity. Stellar is in that conversation now.
-------------------------------------------------------------------------------------------
🧠 6. Mission-Aligned Ecosystem Funding
The Stellar Development Foundation holds billions of dollars in XLM and is using it to:
Fund early-stage startups building on Stellar
Run accelerator programs and hackathons
Expand into new regional markets (Africa, Asia, LATAM)
Long-Term Impact: Unlike many ecosystems that fizzle due to lack of funding or misaligned VC interests, Stellar has long-term strategic capital to guide the network toward its mission of financial access.
-------------------------------------------------------------------------------------------
🔐 7. Security, Speed, and Simplicity
From day one, Stellar has prioritized:
Fast block finality (~5 seconds)
Very low fees (< $0.001)
Energy-efficient consensus (SCP – Stellar Consensus Protocol)
These strengths are especially important for high-volume, low-margin applications like:
Micropayments
Remittances
Real-time settlements
Tokenized wages and aid
Long-Term Impact: As the blockchain infrastructure layer for finance matures, efficient networks will dominate. Stellar’s technical foundation makes it a sustainable long-term option.
-------------------------------------------------------------------------------------------
🧭 8. Stellar’s Focused, Long-Term Vision
SDF’s mission isn’t to be “just another smart contract chain” — it’s to improve access to equitable financial services, especially in underbanked regions.
That vision is:
Clear
Consistent
Attractive to partners, governments, and NGOs
Long-Term Impact: Clarity of mission = better talent, partners, funding, and resilience during market cycles.
-------------------------------------------------------------------------------------------
Chainlink Price on 14/June/2025Chainlink is trading at 13.25$ as of 14/June/2025. In Next week, It need to retest at 12.4$ -12.6$ before it break 15.51$. To claim the bull the price should be 20$.

TONUSDT Forming Falling Wedge TONUSDT is currently forming a classic falling wedge pattern—a historically bullish setup that often precedes major price breakouts. The recent breakout from the wedge accompanied by a significant surge in volume indicates a shift in market sentiment. This pattern suggests the end of a downtrend and the beginning of a new bullish wave. Such formations often result in strong upward price action once the resistance trendline is broken with volume confirmation.
Market participants have shown renewed interest in TON, with price currently stabilizing above a previous key resistance level, now potentially acting as support. This shift aligns with the historical behavior of wedge breakouts, where the asset consolidates briefly before continuing its climb. The current structure and momentum signal a potential 90% to 100% price appreciation, especially as investors recognize the strength of the breakout and the fundamental developments behind the project.
The volume profile further supports this bullish thesis. An increase in buying pressure at the breakout level reinforces the conviction that a trend reversal is in play. If TON maintains its bullish structure, the next major resistance zones could be tested, offering traders and long-term holders a strong opportunity to capitalize on this technical shift.
With rising investor interest and a textbook bullish pattern breakout, TONUSDT is a crypto pair to watch closely. The breakout from the falling wedge combined with solid volume growth and increasing sentiment across crypto communities signals that a new uptrend could be underway.
✅ Show your support by hitting the like button and
✅ Leaving a comment below! (What is You opinion about this Coin)
Your feedback and engagement keep me inspired to share more insightful market analysis with you!

BTC Hits ATH Time But Dont Let Euphoria Ruin Your PerceptionBitcoin has pushed into new all-time highs and is now testing the same resistance zone we saw back in December–January. While the breakout is technically impressive, price is stalling at the exact level where strong sell pressure previously kicked in.
Today’s weekly close is a key confirmation point. But the bigger issue? Next week is stacked with macro volatility — PPI, FOMC, and other data drops that could rattle risk-on assets.
⚠️ What I’m Seeing:
- Weekly RSI divergence continues to build
- Volume is drying up, not confirming the move
- Macro pressure is incoming — timing matters
🧠 My Bias:
I wouldn’t be surprised by a final liquidity grab into the $120K–125K range — enough to trap late longs and generate downside liquidity.
Personally, I’m de-risking. Not shorting yet — just locking in some gains.
Ask yourself: Are those extra 10% upside gains worth the risk of giving back 30%-50%?
Not calling tops. Just following structure.
Always open to opposing views — discussion sharpens conviction.
Don’t let euphoria cloud your perception.
📉 Stay safe out there.

BTC shorts will get liquidatedHello everyone!
As we all witnessed, BINANCE:BTCUSDT experienced a sharp drop following Trump's announcement of new tariffs starting June 1st on all European Union . The big question now is: is this the end for Bitcoin, or just a temporary dip?
In my opinion, BTC is likely to move as follows:
It will retest the long wick on the 1-hour chart, which previously bounced from a 1-hour Fair Value Gap (FVG) , and then continue its upward movement.
Don't worry, everyone, BTC remains very strong!

BTC DOMINANCEBitcoin dominance could break down at this point, potentially signaling the start of an exceptional altseason.

Falling towards pullback support?Ethereum (ETH/USD) is falling towards the pivot which has been identified as a pullback support and could bounce to the 1st resistance which acts as a pullback resistance.
Pivot: 1,940.23
1st Support: 1,827.50
1st Resistance: 2,107.47
Risk Warning:
Trading Forex and CFDs carries a high level of risk to your capital and you should only trade with money you can afford to lose. Trading Forex and CFDs may not be suitable for all investors, so please ensure that you fully understand the risks involved and seek independent advice if necessary.
Disclaimer:
The above opinions given constitute general market commentary, and do not constitute the opinion or advice of IC Markets or any form of personal or investment advice.
Any opinions, news, research, analyses, prices, other information, or links to third-party sites contained on this website are provided on an "as-is" basis, are intended only to be informative, is not an advice nor a recommendation, nor research, or a record of our trading prices, or an offer of, or solicitation for a transaction in any financial instrument and thus should not be treated as such. The information provided does not involve any specific investment objectives, financial situation and needs of any specific person who may receive it. Please be aware, that past performance is not a reliable indicator of future performance and/or results. Past Performance or Forward-looking scenarios based upon the reasonable beliefs of the third-party provider are not a guarantee of future performance. Actual results may differ materially from those anticipated in forward-looking or past performance statements. IC Markets makes no representation or warranty and assumes no liability as to the accuracy or completeness of the information provided, nor any loss arising from any investment based on a recommendation, forecast or any information supplied by any third-party.

$PENGU Falling Wedge Bullish Daily CSECY:PENGU forming a falling wedge this will explote soon guaranteed I’m loading hard already! See you at the top!
