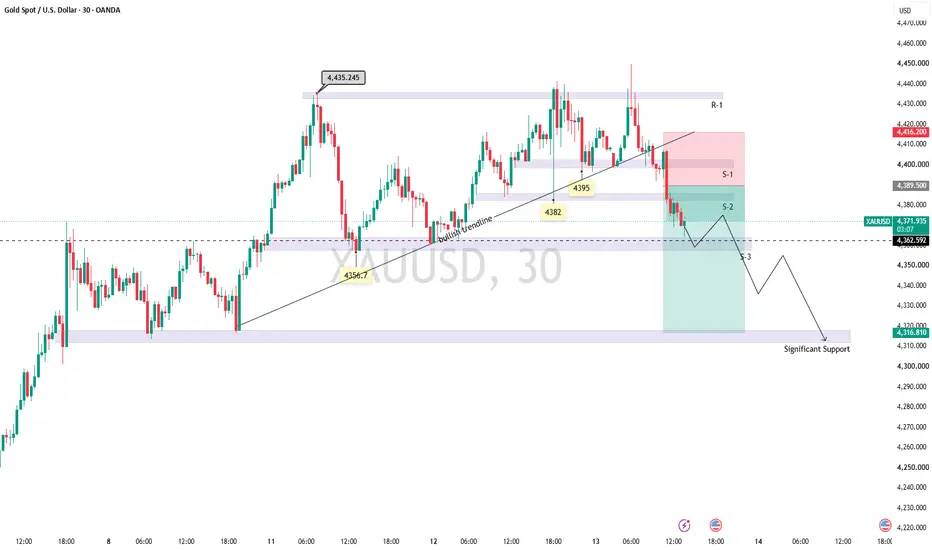
Gold (XAUUSD) Retracement started, declines to continue!Price has faced multiple rejections form R1 ~4435, after facing rejection from strong resistance, it had consolidated within R-1 and S-1 and there after broke below the S-1 and a bullish trendline, expected to continue it's decline S-3 might act as strong support but, if that is breached it could directly retest 4300 levels.
After a week long one sided up move, trend was clearly showing signs of exhaustion, inability to achieve newer highs had made the price structure fragile.
Bearish sentime
Decline
Is Face book undervalueLet’s start with fundamentals:
1.Earning for q4 was about 4 % below estimate (33.67 B) but still 20 % higher than same period last year.
2.Totall net income for 2020 was 29.15 B and for 2021(4 quarters) is 39.37 B. Isn’t it wonderful?
And FB is trading at 232$ (is equal to the average price of 2020, but with 34% higher net income.)
And after all FB is heavily investing in metaverse. This investment reduces net income for the current year and it will gain it back in near future.
Now technical:
1
FLong
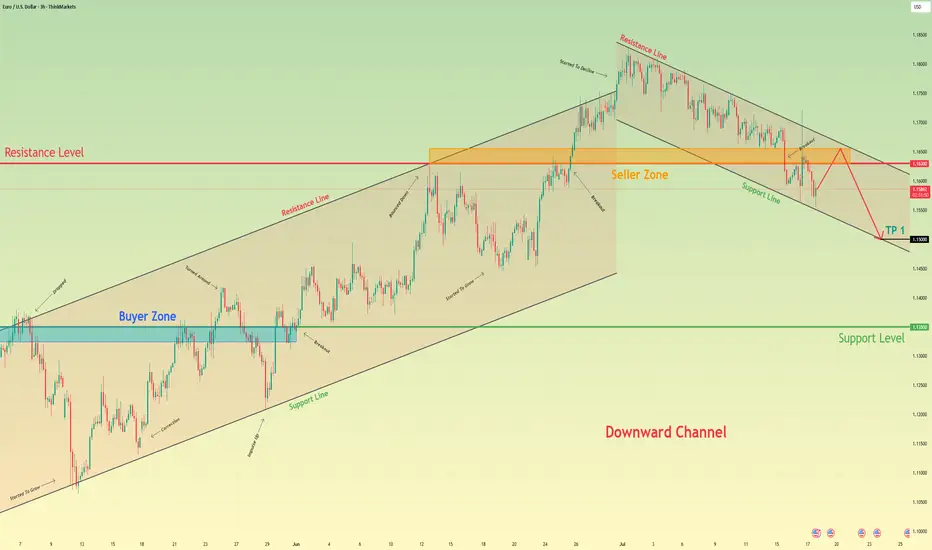
EURUSD: Downtrend will Continue in ChannelHello everyone, here is my breakdown of the current Euro setup.
Market Analysis
The price action has been clearly bearish, with the market being guided lower by a well-defined Downward Channel. This structure has been in place for some time, creating a series of lower highs and lower lows after a failed breakout above the 1.1775 Resistance.
Currently, the price is in a corrective rally after a 'fake breakout' below the major 1.1575 Support. This bounce from the lows is now carrying the pri
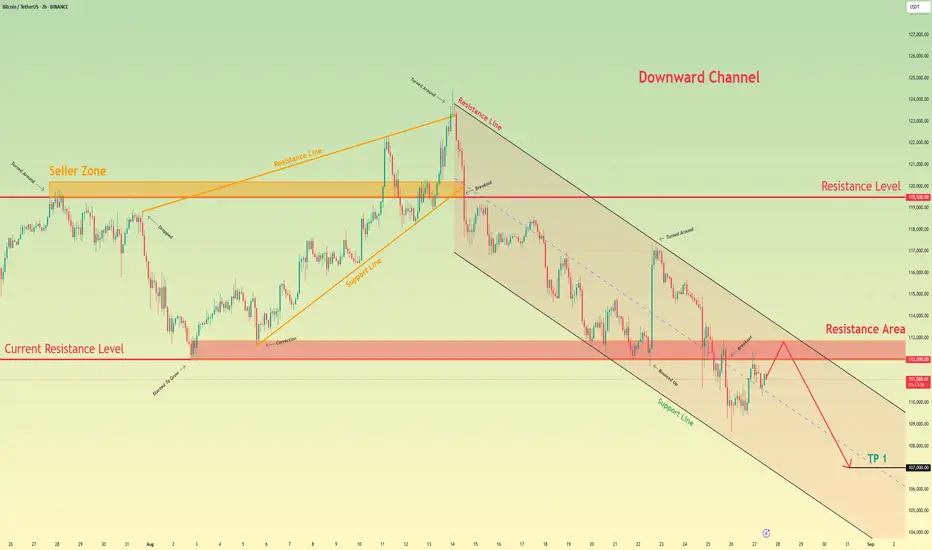
Bitcoin will rebound from resistance area and continue to fallHello traders, I want share with you my opinion about Bitcoin. A distinct shift in market control from buyers to sellers has defined the recent price action for Bitcoin. After the prior upward wedge failed at the major 119500 resistance level, a significant breakdown occurred, initiating the current bearish phase, which has been neatly contained within a downward channel. The price action within this structure has been orderly, consisting of downward impulses followed by corrective rebounds. The
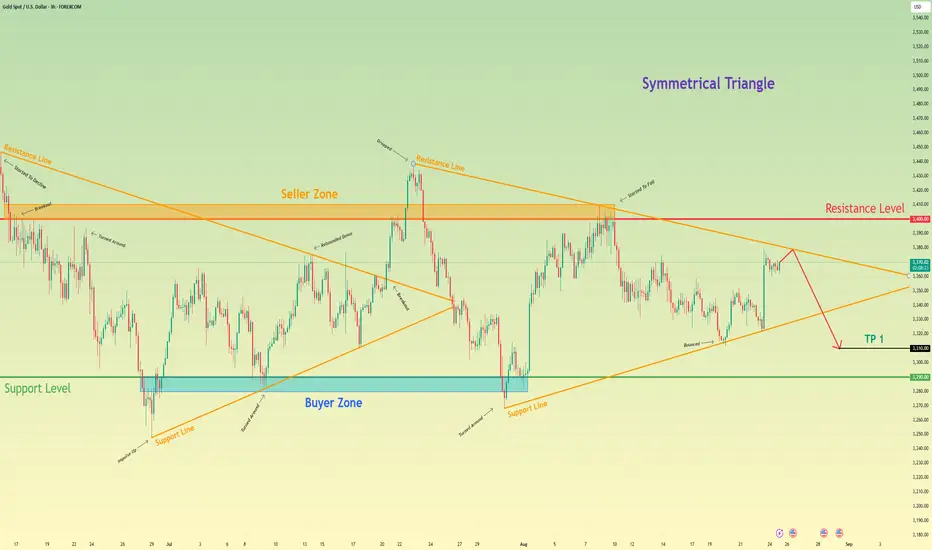
Gold will drop from resistance line of triangle to 3310 pointsHello traders, I want share with you my opinion about Gold. The market for Gold is currently defined by a large symmetrical triangle, a pattern of equilibrium that has formed after a strong rebound from the 3290 buyer zone halted the previous downward trend. This new market structure indicates a period of contracting volatility, with the price action for XAU being methodically squeezed between a descending resistance line and an ascending support line. These boundaries are anchored by the major
XAUUSD Short: Sellers to Maintain Control at 3380 SupplyHello, traders! The macro structure for the XAU price auction has been defined by two critical pivot points, establishing a wide and volatile consolidation range. A major pivot point high was formed at the 3390 supply zone, while a subsequent pivot point low anchored the market at the 3300 demand zone. All price action since has occurred between these two dominant control zones, transitioning the market into a state of balance.
Currently, the price action is contracting within a large symmetric
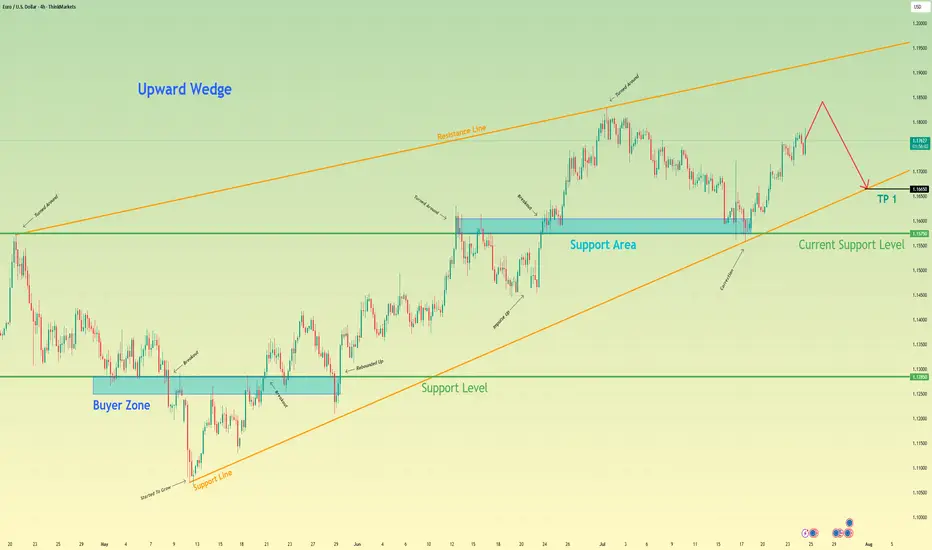
Euro will rise a little and then start to fall to support lineHello traders, I want share with you my opinion about Euro. After a prolonged consolidation period, a strong upward trend was initiated from the buyer zone around 1.1285, propelling the EUR significantly higher. This initial impulsive move has since transitioned into a more complex and mature phase, taking the shape of a large upward wedge formation, a pattern which often signals underlying exhaustion in the prevailing trend. Currently, the pair is operating within this defined market zone, char
Euro may reach seller zone and then continue to fall in channelHello traders, I want share with you my opinion about Euro. The price pair has recently shifted its market structure, establishing a clear downward channel after breaking its previous uptrend. Before this breakdown, the price was consistently trading within an Upward Channel, repeatedly finding support in the buyer zone (1.1325–1.1350) and reversing upward. The bullish momentum eventually faded when the price failed to break the major horizontal resistance level at 1.1630. This failure triggered
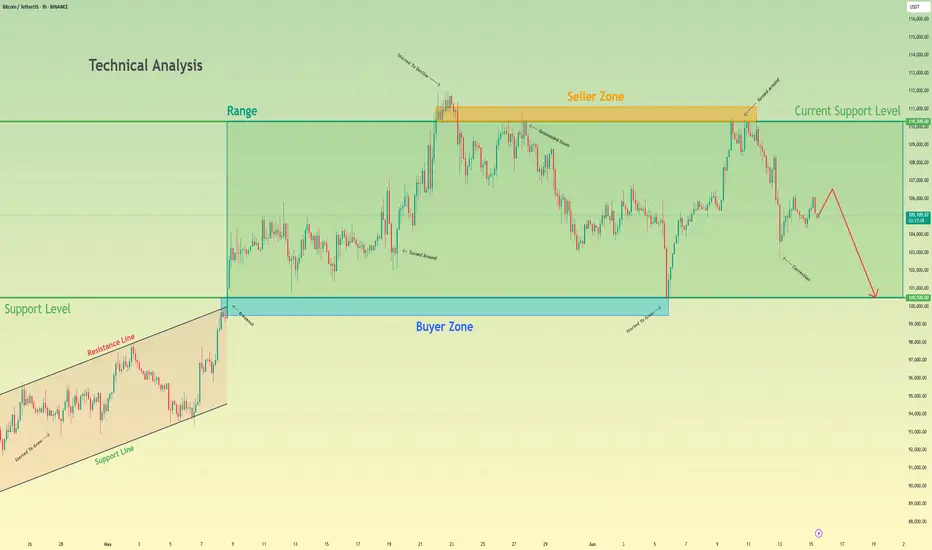
Bitcoin will make a small upward move and then continue to fallHello traders, I want share with you my opinion about Bitcoin. Earlier, the price was confidently growing inside an Upward Wedge, showing a series of higher highs and higher lows. This rising structure was supported by consistent momentum until BTC reached the seller zone between 110300 and 111100, where the growth slowed down and started to fade. From there, the price rejected this resistance and shifted into a Range, bounded by 100500 and 110300. BTC has been fluctuating inside this horizontal
Bitcoin will continue to fall to support level in channelHello traders, I want share with you my opinion about Bitcoin. This chart shows how the price rebounded from the support line and started to grow. In a short time, it rose to the support level, which coincided with the buyer zone, and it even soon broke this level. Next, the price rose a little and then continued to move up, but later corrected the support line. After this, BTC rebounded and rose to the seller zone, breaking the 108800 resistance level. Then it rose a little more and turned arou
Bitcoin may break support level and continue to fall in channelHello traders, I want share with you my opinion about Bitcoin. Previously, price was moving inside a horizontal range, consolidating between resistance and the buyer zone near 103500 - 102900. The market lacked clear direction, and price repeatedly rebounded within this structure, failing to build strong momentum either way. Eventually, BTC exited the range and began forming a downward channel. This shift introduced a clear bearish bias, with each high being lower than the previous one. Price ac
Euro may break support level and fall to support line of channelHello traders, I want share with you my opinion about Euro. In this chart, we can see how the price after another rejection from the resistance boundary of the descending channel, the Euro began to show renewed bearish pressure. The price attempted to gain ground above the buyer zone, but the breakout lacked follow-through and quickly reversed. This false breakout scenario often acts as a trigger for a deeper drop, especially when it occurs near the mid-range of a well-defined channel. The marke
Bitcoin can drop from wedge to 100K pointsHello traders, I want share with you my opinion about Bitcoin. After consolidating for an extended period within a triangle pattern, the price eventually broke out with strong bullish momentum. The move was supported by a solid rebound from the buyer zone and a clean breakout above the 92800 - 94200 support area. This breakout initiated a steep climb, forming a new upward wedge structure, defined by narrowing trend lines and rising local highs. Currently, the price is trading near the resistance
Euro will rise a little more and then make correction to 1.0950Hello traders, I want share with you my opinion about Euro. Earlier, the price started to grow from the lower region near 1.0730, where it bounced off the buyer zone between 1.0690–1.0730 points and entered a strong upward movement. This impulse helped Euro break through previous resistances and approach the upper boundary of the support area, which lies between 1.0950–1.0990 points. After reaching a local high, the price formed a pennant pattern, consolidating within narrowing trend lines while
A big decline on BAN/USDT upcomingWhile every single indicator shows that BAN/USDT shows strong buy , our team diagree. Let's find out why..
Ban in the past 24hrs had a big pump of 120% , clear sign of manipulation..
Buyers started coming in and the coin will liquidate all of them..
A drop of 33% is expected from this coin..
Lets see if we are right on this one..
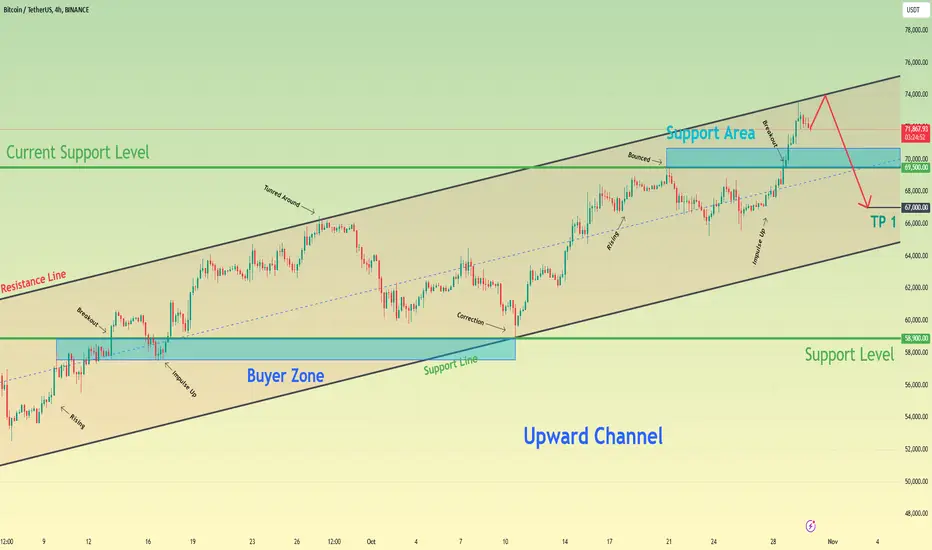
Bitcoin can reach resistance line of channel and start to fallHello traders, I want share with you my opinion about Bitcoin. Observing the chart, we can see how the price some days ago entered an upward channel, where at once it made little correction and then rose to a support level, which coincided with the buyer zone. Then BTC broke this level, after which made a correction to the buyer zone, and then BTC made an impulse up to the resistance line of the upward channel. After this movement, the price turned around from this line and then started to decli
Euro can reach resistance zone and then continue to fallHello traders, I want share with you my opinion about Euro. By observing the chart, we can see that the price some days ago tried to grow, but failed, turned around, and started to decline inside the downward channel. Inside the channel, the price firstly declined to the seller zone, after which tried to grow to the resistance line of the channel, and when it reached this line, the price continued to fall. Soon, EUR broke the 1.0910 level, made a retest, and later continued to fall. Some time la
Bitcoin will break support level and continue to fall to 61800Hello traders, I want share with you my opinion about Bitcoin. By observing the chart, we can see that the price some days reached the support level, which coincided with the buyer zone, but at once rebounded and declined a little below. After this movement, the price started to grow inside an upward channel, where it soon reached the 59000 level and broke it. Next, the price made a correction to the buyer zone and then continued to move up to the channel's resistance line, which coincided with
Euro can reach resistance line of channel and then continue fallHello traders, I want share with you my opinion about Euro. Observing the chart, we can see that the price some days ago entered to downward channel, where it at once rebounded from the resistance line and started to decline. In a short time price reached the 1.1030 level and some time traded inside the seller zone, after which broke this level. Next, the price fell to the support line of the channel and then tried to grow, but later failed and fell to the current resistance level, which is loca
Euro can break support level and continue to declineHello traders, I want share with you my opinion about Euro. Observing the chart, we can see that the price some days ago entered to pennant, where it at once made an upward impulse from the support line to the support level, which coincided with the support area. Then it rose higher than the 1.0930 level, but soon fell back to the support area, where some time traded and then finally broke the 1.0930 level. Next, EUR continued to move up to the resistance level, which coincided with the seller z
Euro can reach resistance level and then start to declineHello traders, I want share with you my opinion about Euro. Observing the chart, we can see that the price declined to 1.0775 points, after which turned around and made a strong impulse up to the 1.1000 support level, which coincided with the support zone. Then the price rebounded from this level and made a small correction movement, and then continued to move up next. Soon, the price broke the 1.1000 level and made a retest, after which rose to the resistance level, which coincided with the sel
Euro can start to decline from resistance line of wedgeHello traders, I want share with you my opinion about Euro. Observing the chart, we can see that the price entered to upward wedge, where it at once turned around from the support line and rebounded up to the 1.1000 support level, which coincided with the support area. After this movement, the EUR made a correction movement and then bounced up higher than the 1.1000 level, breaking it, but soon turned around and declined below. Then price started to grow and later reached the current support lev
Bitcoin can continue to decline inside range to 54800 pointsHello traders, I want share with you my opinion about Bitcoin. By observing the chart, we can see that the price some days ago entered to triangle, where it at once started to decline from the resistance line and soon fell below the 61200 level, breaking it. Then the price dropped more and broke the 53300 level, reaching the support line of the triangle, after which it turned around and started to grow. In a short time price rose to a resistance level, which coincided with the seller zone, break
Euro can reach resistance level and then rebound down to 1.1080Hello traders, I want share with you my opinion about Euro. Looking at the chart, we can see how the price entered to downward wedge, where it at once rebounded from the resistance line, which is located in the seller zone, and started to decline. In a short time price fell to the support line of the wedge, and then tried to grow, but failed and continued to decline to the buyer zone. In the buyer zone, EUR reached the support line of the wedge and at once rebounded up, thereby exiting from the