Value investing chart setI would like to share the set of charts I use to find and analyse candidates for value investing.
It is a rather dense and telling setup where you can find a lots of information. Please allow me to explain them one by one.
(The chart is made on the company Nippon Tel. It is not a recomendation for anybody to buy Nippon Tel, I use this chart for educational purposes only)
So: what can you see in this chart? A LOT! You can, in a glance asses if a company would qualify for value investing or should be avoided. From bottom up here are the panes, charts, indicators explained:
There are 3 panes in this setup.
In the lowest pane you will find the dividend information. There are 3 indicators telling a lot about the company's endurance and discipline. We can see that in our example
- the company has never been missing a dividend payment over the last 15 years (even during the 08 crisis)
- the company has been constantly raising the dividends over the last 15 years
- the company has made an ever growing diluted EPS (earnings per share) over the last 15 years
- the investment in the current price levels would yield 3,69% (bottom right scale)
- the company has been very disciplined to pay out about 50% of the earnings per share and retain the rest within the company resulting growing book value
In the middle pane you can see the net income (green territory) of the company and the number of common shares outstanding (blue line). We can see that in our example
- the company has been constantly making profit over the last 15 years (even during the 08 crisis)
- the company constanly buying its shares back thus helping the existing shareholders to keep/grow the equity per share
Now the top, main pane tells the most about the company and its share. Here is what you can read from this chart:
- the yellow line will show the Debt to Equity ratio
What this is telling you is that the company is ran by vigiliant leaders who are keeping a close eye on the company's long and short therm debt and resist the temptation of today's really cheap loans. As Peter Lynch use to say: it is almost impossible to go bankrupt for a company without excessive debt. The ratio Ben Graham and Warren Buffet (also Peter Lynch) finds healthy here is a 1 to 2 debt to equity ratio. In other words, it is assuring if half of the equity covers all the debt of the company.
In the case of our example the current value of this ratio is 0,415 which is a very good level of debt. (Industry specific figure!) The company has been constantly paying it's debt back over the last 15 years and although the figure has been growing during the last 2 years it is still under a acceptable level.
- the light brown line is the book value or the shareholder1s equity per share
Needless to say the for a value investor it is imperative that the book value is steadily growing, just like in our example from 8,8 to 21. What is even more important is that the current price is below the book value per share or in other words a buyer in these price levels gets a 1 on 1 value for his bucks. Just to give you a comparison: today this value for Apple (AAPL) is 30 to 1! So you pay $ 30 for $ 1 of equity when you buy Apple stock.
In our example the book value of this company is steadily growing and the price is currently below the book value.
- the pink line on the pane is my "invention" as this is the intrinsic value graph which is calculated by the script I have posted already here. I would not explain in details here, please check out my post and all the comments below it for details.
This line shows you what would be a fair value of the stock if you take all the dividends and the book value growth that will happen in the next coming 10 years and discount it back to today's value using the 10 years US Note's yield. This is called the intrinsic value of the company and calculating it is rather art than science, says Buffett.
In the case of the example company the Intrinsic Value is around 43 while the price is a bit above 20 which means that a value investor has a 100% margin of safety when buying this stock.
- the green/red line is another calculated line: Warren's limit price
Ben Graham and Warren Buffett uses a rule of thumb saying that the PE (price earning ratio) multiplied by the Price to Book ratio can not result a higher value than 22.5 to be considered a cheap stock. Here I use the Diluted Earnings figure to calculate the PE ratio to take all the convertible securities (options, prefered stocks, warrants, etc) into consideration.
This line shows if the stock can be valued as cheap or overpriced.
In the case of our example the current price is under the limit price and can be considered an underpriced stock.
As you can see there are lots of fundamental informations you can visualise and asses with this chart setup in order to pick your winning stocks for value investing.
Dividend

Procter & Gamble ~a safe gamble~The green arrow in the chart show the support being tested around $135.
The upside is around $144, and a stop-loss exit below the 100ema makes sense for at least 50% of the trade.
RSI has slightly improved, showing bullish intent.
PG is probably being used to collect dividend, so choppiness in the drawn channel isn't a negative thing.

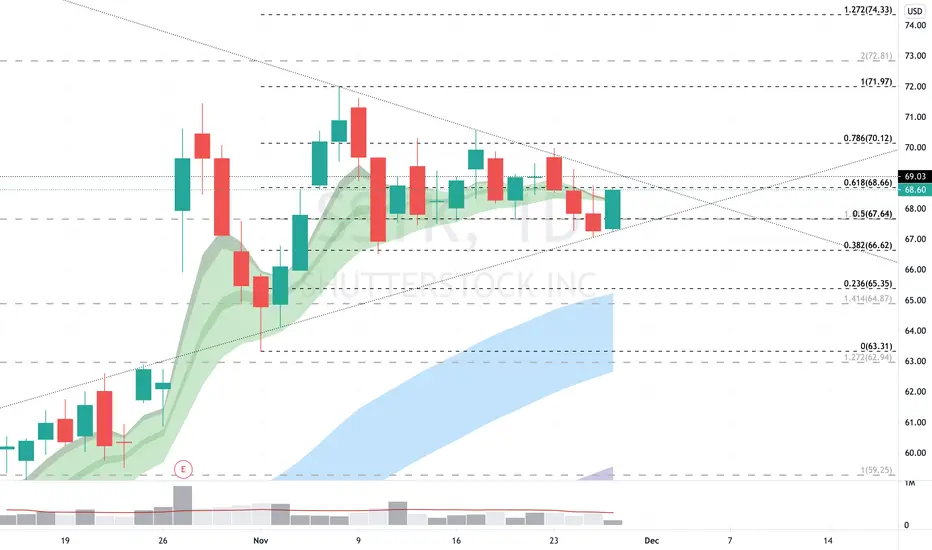
SSTK over 69.03 with 12/2 catalystTight price consolidation on this one with an upcoming ex-dividend catalyst on 12/16, although purchase on or before 12/2 is required to receive it. This means we should see some buying on and before that date. From Yahoo Finance: "If you purchase the stock on or after the 2nd of December, you won't be eligible to receive this dividend, when it is paid on the 16th of December.
Shutterstock's upcoming dividend is US$0.17 a share, following on from the last 12 months, when the company distributed a total of US$0.68 per share to shareholders."
Note it is a stock that trades on lower volume and has some illiquidity in the options chain.
#IMB Long at 1480 ahead of ex-dividend dateEnough is enough.
Tobaco is not in favour these days but #IMB has just cleared its EMA200 (long-term resistance).
Good setup emerged for the Long trade: Buy 1480, TP1 1635, TP2 1730, TP3 1820, SL 1410.
Additional reward is ex-dividend date on 26/11 (adds 48 per share).


INTERESTED IN BUYING NAT? WATCH THIS ANALYSIS (93% profit?)NAT has been falling drastically in price for the last 6-7months, after it was hyped up through March and April for the record low oil prices. After the oil prices started to rise again, NAT has just been going DOWN, showing no strenght what so ever.
Many people are interested in this stock because of the high dividend it's paying out which currently sits at stunningly 24%! If this is good or bad for the company can be discussed.
Now let's look at the technical of this stock. NAT are currently in a long lasting descending channel. Price is currently at 3.06, and as you can see price got rejected at the horizontal and trendline resistance. Its not ready to break out yet. I think we will have another leg down to about 2.30-2.50, where the blue box is placed. This level is probably the best place to enter NAT if the price resumes up. Because of the horizontal and trendline support at the 2.30-2.50 zone.
So how high do I think the price will go from there? My target is around 4.82. That's the zone where the price started to go into a descending channel and we also got strong support up there.
This is the absolute best and safest place to enter NAT in the following weeks/months, If the price breaks below this level price will probably enter a consolidation like January 2018-September 2019.
If you like this analysis and find it helpful, please leave a like! Appreciate any feedback, and sorry for bad English :3


$MGK Pullback Buyers Hunting For The Entry$MGK has had a great run higher doubling in value from the lows. This move higher did get quite overextended creating an overshoot on the highs. When a market blows through a level (in this case the channel highs) and overshoots it, the response is very important. In this case, the response was immediate bear pressure which caused the bulls to fail hard. Now that we have seen the overshot high failure, it is expected to see an overshot on the lows too to equalize. Buyers are lying in wait for the best dip opportunity to jump back in this monster.

3m - Dividend Star - Long TradeHey everyone,
3m is one of the most suggested stocks when it comes to dividends. But also for traders there are decent opportunities atm. The stock goes along the support area, the RSI is on the buy side but not overbought but the trend aims up. The dividend is 3.5% and the company raised their dividend since the past 62 years. One could say, you can buy it now no matter what kind of investment style you have <3
Buy: Now / 162$
( Stop: 159$ )
( Take Profit: 182$ )
Much fun with that trade / invest!
Leave a follow please, my goal is 200 :)

Altria with mixed feelingsHey everyone,
atm i got Altria on the screen with mixed feelings in terms of technical analysis. The green line gives good support while the red box is a huge resistance. The Trend points upwards while the RSI got a divergence. There is also a chance for wave 3 in this current consolidation.
You could buy that stock as a dividend position (7,9%) and buy more f the stock goes down. You could also buy with a tight stop included. I will go with the dividend position though.
Buy: now / 43.15$
( Stop: 42.50$ )
Goal: ?
Much fun with that trade!
Leave a follow please, my goal is 200 :)

invest idea EPD 10% STRONG DIVIDENDEnterprise Products Partners L.P.
fantastic dividend stock
DIVIDEND YIELD (FWD) ANNUAL PAYOUT (FWD) PAYOUT RATIO 5 YEAR GROWTH RATE DIVIDEND GROWTH
10.14% $1.78 85.98% 4.18% 21 Years


NEXO in Aug 2020: Long or ShortIt's rare to find a good cryptocurrency project among hundreds of failed, scam projects.
NEXO is one of those, for those who have followed NEXO from first days, it will not be hard to see the possibility of their success in the future.
The Crypto Market 2020 seems to be getting back on track. Can Bitcoin break the old peaks or can Ethereum successfully update to version 2.0? All of which can affect to NEXO's price.
Technically, the ability of NEXO growth in 2020 is entirely possible, fundamental analysis also supported this.
I'm looking at $0.40 in the next 6 months to 1 year.
This analysis is for reference only. Not an investment advice. Disclaimer!
Good luck guys!

BAC compared to SPX and NDX: Dot com top and bottomBerkshire Hathaway bought 33.9 million shares of the banking giant between Monday and Wednesday. That increased Berkshire's stake in Bank of America by $813.3 million to more than $24 billion. BRK holds 11.5% of BAC now.
BAC chart compared to S&P500.
Observe the top of both the NASDAQ and S&P
BAC started bottoming when the 2 indices started falling.
2008 was a banking crisis which directly impacted BAC and it fell relatively harder than the indices. In 2020, Banks are well capitalised and backed by the FED, so chances of a banking crisis are slim.
Add to that, NASDAQ is clearly overcooked at the moment(Check the historical chart. Top of the major trendline. That said, it Could also break up)

Intel Corp (INTC)Dividend adjusted and unadjusted price data.
Unadjusted, INTC Is still below its ATH.
Adjusted, INTC is above its 2000 high.

ABBV buy the dip ahead of pharma seasonAbbvie's volume has slackened somewhat after its recent triangle breakout, and it has broken its steep upward trendline. We may see a small correction late this month as Abbvie pulls back toward triangle top. However, if healthcare and pharmaceutical sector earnings continue to deliver this month (as they have so far), then Abbvie should get some buying volume along with the rest of the sector.
And then in August, a period of seasonal pharmaceutical strength begins. In The Stock Traders' Almanac, Jeffrey Hirsch makes an extensive study of seasonal stock market performance by sectors. His third-best-performing seasonal trade by average 10-year return (16.8%) is to go long biotech from early August to early March. I believe that's because this is the busy season for FDA drug application reviews.
The pharma sector does have an unusual level of political risk this year. Democrats have traditionally been hard on the pharma sector, and they look poised this year for a sweep. If the polls remain strongly blue, then we might see pharma underperform this year.
That said, I think a lot of the political risk is already priced in. Whereas most of the stocks I look at are at the very top of their 3-year valuation range in terms of forward earnings and sales, pharmaceutical companies like Abbvie and Merck are trading in the bottom quartile of their 3-year valuation range. With forward PEG ratio around 2, forward PSG ratio around 0.5, and a whopping 5% dividend, Abbvie looks really attractively valued. I've been doing a lot of deal-hunting lately, and this is one of the only stocks I've seen with both a strong growth story and a valuation I really like. The analysts and options traders like it too; Abbvie has a 9.9/10 Equity Starmine Summary Score, and near-dated options positions are heavily skewed toward calls.

APLE Probability of price movement and good MONTHLY DIVIDENDSAPLE took my attention .
Could be a very good long term investment for its dividends but we have to pay attention on Balance Sheet and other factors that can give an idea about the good standing of the company.
Wish you all the best .
Thank you .

Wrong-way earnings play on Kroger offers opportunity to buyKroger reported blow-out earnings and sales today, handily beating both the Wall Street and Estimize consensuses. The stock is moving down, however, perhaps because this quarter's earnings were a blip and next quarter's earnings are expected to be in a more normal range. I could see the stock selling off over the next month or so as the "Covid-19 bump" goes away.
However, some increased demand will remain over the next few quarters as consumers remain too scared to eat at restaurants. Next quarter's estimates are lower than the current quarter, but still quite a bit higher than 2019 YoY. Also, Kroger's increased cash flow this quarter will get reinvested into the business, leading to higher earnings in the future. Based on Zacks estimates of Kroger earnings for 2021, I estimate the stock's fair value at around $37 per share.
We've got a support around $31 per share today, but the reality is that we probably will break that support and continue downward toward the volume support at $28.50. And since it's the slow season, I wouldn't even be surprised to see Kroger hit secondary volume support at $25. I will be scaling in as the stock falls, because I think Kroger is an attractive, dividend-paying investment for a recessionary environment.

Global Dominion: Short that Head & Shoulders patternTechnical: RSI below 30 might mean a rebounce to 3.16 not later than Tuesday, however DOM is expected to pay dividend in a few days (6/7/2020) so the fallout may continue after early investors sell their stock on the firm bought on March 13.

TSM - 10% Potential by EOY PLUS DividendsIf price breaks above the local high (look at green dotted line), we might have a runner back to ATH. My stop will be a close below the rising trend line and will move accordingly with price.
If you found this to be insightful or helpful, please show appreciation by hitting that like button. If you want more ideas I invite you to follow as well! I try to be here for all of my followers with any questions they might have. Feel free to shoot me a DM or comment below to start a conversation!

Overstock broadening wedgeNASDAQ:OSTK broadening wedge forming. I think it will go up eventually.
Related names: OTC:OSTKO COINBASE:BTCUSD KRAKEN:XTZUSD NASDAQ:EBIZ AMEX:ONLN NYSE:W

Long WBC!There are so many reasons to go long on WBC here.
Just a few:
At this price WBC is massively undervalued.
WBC just broke above its local trend.
WBC pays huge dividends.
Australia has beaten COVID-19.
Get on it doggon it
