AAPL: The 30% Rule — Why Apple’s Next True Low Likely at 200 USD🍎 AAPL WEEKLY SNAPSHOT — EXECUTIVE SUMMARY
✨ Apple Inc. is entering the late phase of a multi-year corrective cycle
📉 Primary thesis: A ~30% correction is still unfolding, consistent with prior Apple macro drawdowns
🏛️ Macro backdrop: Dow Jones Industrial Average extended near psychological 50,000 → late-cycle risk elevated
⏳ Timing focus: 2025 distribution → 2026 corrective low
🎯 Projected downside target: $200 ±10 macro support + valuation reset
________________________________________
🔍 Why the 30% Correction Matters Historical Fractal Logic
Apple has repeatedly respected ~30% drawdowns during secular bull markets — not crashes, but controlled re-ratings:
• 📌 2021 → 2022:
• High → Low ≈ -30%
• Trigger: tightening cycle + growth multiple compression
• Outcome: strong multi-quarter recovery
• 📌 2024 → 2025:
• High → Low ≈ -30%
• Trigger: AI-led over-extension + index concentration risk
• Outcome: range repair, not trend resumption
• 📍 Current Cycle (2025 → 2026):
• Structure suggests another proportional leg
• Distribution at highs → rolling lower highs → trend exhaustion
• Measured move from 286 ⇒ ~200 aligns with historical symmetry
📐 Market logic: Apple doesn’t usually collapse — it compresses.
________________________________________
🧱 Key Technical Zones Weekly / Monthly
• 🔺 286–280: Macro ceiling / cycle high (distribution complete)
• ⚖️ 245–235: Mid-range congestion (temporary reactions possible)
• 🟨 215–200: High-probability terminal support zone
• 🚨 Invalidation (bear thesis): Sustained acceptance above 286
________________________________________
🧠 Macro Confluence Why 2026 Matters
• 📊 DJIA near historic extension → mean reversion risk rising
• 💰 Passive flows crowded into mega-caps (AAPL = core holding)
• 🧮 Valuation sensitivity at cycle peaks historically resolves via price, not time
• 🕰️ Apple corrections often lag index tops, bottoming after broader sentiment breaks
________________________________________
🎯 Strategic Trade Framework
• ❌ Avoid chasing long exposure at highs
• 🧘♂️ Expect volatility + range expansion before clarity
• 🛒 Best long-term accumulation: only near 200 zone, not earlier
• 🧭 Tactical traders may short rallies below 280 with tight risk
• 🏦 Post-2026: High-quality reset likely sets up next secular advance
________________________________________
🗳️ AAPL Weekly Scenarios — Levels Quiz
Which path do you see next?
🅰️ Hold above 245 → extended range before final breakdown
🅱️ Break 235 → acceleration toward 215–200 macro support
🅲 Flush to ~200 in 2026 → generational accumulation window
🅳 Your level: comment the one price that changes your bias
Djia

S&P500 Index Guess for 2026 Using Wall Street Ests
S&P 500 Index
19 hours ago
S&P500 Index Guess for 2026 Using Wall Street Ests
1
1
Grab this chart
256
19 hours ago
Wall Street each January makes an estimate for the year ahead S&P500 Index, the largest index used for indexing returns and for managing capital. It's a fascinating practice to take a 'snapshot' of the mentality of the collective wisdom of Wall Street brokerage firms. These are the top 12 brokers in the US which guide portfolio managers globally.
I included the long term average of 9%-10% as a reference so you can see that in 2025 Wall Street was bullish and clustered right around the average return as shown by the cluster of black rectangles. Oddly, the previous year estimates seem to have a "value support" function too where the market held on the pullback in the first quarter of 2025 at the level of the 2024 guesses. See for yourself how this worked in 2025.
You can also see that the cluster of guesses around 6600 in the SPX created multiple rounds of volatility in the fall of 2025 as the market ran into selling at the "common guess level". This turbulence could have been the result of people either raising cash or rotating from growth to value stocks in the 3rd-4th quarter.
So, on initial glance for 2026, I think the mid-term elections will have the most impact on the market and the uncertainty will cause sideways action through the year and finish with a sub-average, but positive year. IF we go under 6400, then I could see the market head down to 6200-6000 where I had seen it for last year.
Either way, stay tuned as I update this "guess" along the way as I have done in years past. Overall, the batting average is quite good, but decide for yourself.
Wishing you all a healthy and successful 2026!
Tim West
January 6, 2026 2:16PM EST
(hidden since yesterday due to additional scripts accidentally left on the chart hidden)

DJIA: Major Formation About to Breakout!Hello There,
welcome to my new analysis about the Dow Jones Industrial Average Index (DJIA). The index recently came through with some important developments that caught my attention. Especially, the bullish build-up should not be underestimated here. Currently, the index has already completed a main formation, which is setting up the path for further price action upcoming. In my analysis I detected the most important signs to consider for the upcoming price action.
As when looking at my chart, we can see there that the DJIA is trading within this major ascending channel formation. Within this formation, the Dow Jones already bounced several times within the lower boundary. These signs are really bullish and point to a continuation of the bullishness and a major breakout just about to set up. Currently the index is already penetrating the upper boundary of the ascending channel, marking a structure from which a breakout is likely.
The most important part within this whole structure is the inverse head and shoulder formation. Within this formation, the left shoulder and the head were already formed. Now the index is about to complete the right shoulder of the whole formation. Once the breakout happens and the index stabilizes above the neckline, the whole formation will be completed. Once this major breakout happens, the target zones as seen in my chart will be activated.
What should not be underestimated here also is that a majority of analyst recommendations point in the bullish buy direction. Therefore, the index is currently considered as a strong buy candidate. Also, there are many major industry developments that support further bullish price action within the next times. Especially when the index attracts more industry leverage from major firms moving into the market, this will also confirm the breakout from a fundamental perspective.
Right now, we will watch out for the major confirmational price actions to set up within the upcoming times. Especially when a strong breakout happens, this will confirm the next steps within the structure. Currently, there are not many signs of invalidation. However, when the index falls below the 48600 level, this will firstly invalidate the bullish continuation. If this happens, further assumptions need to be made.
With this being said, it is great to consider the important trades upcoming.
We will watch out for the main market evolutions.
Thank you very much for watching!

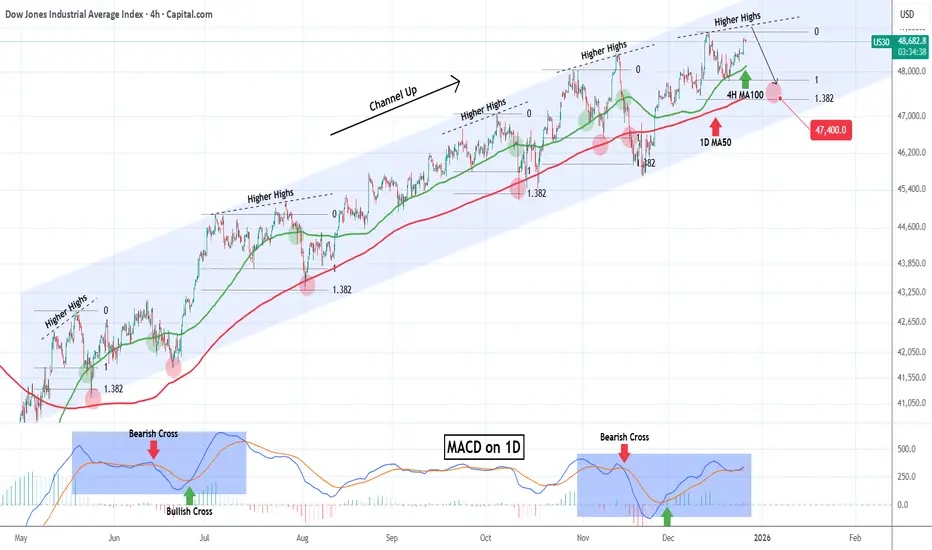
DOW JONES headed towards a rejection.Dow Jones (DJI) has been trading within a nearly 8-month Channel Up and is close to its All Time High (ATH) after rebounding last week on its 4H MA100 (green trend-line).
This pattern is cyclical and every time the latter support broke after a medium-term rally from its 1D MA50 (blue trend-line), the index got rejected on a Higher Highs trend-line and corrected back to the 1D MA50. Even the 1D MACD is printing a sequence similar to June - July.
As a result, we expect the new year to find Dow on its 1.382 Fibonacci extension at 47400 at least, which is the Fib level that every such correction pulled back to.
---
** Please LIKE 👍, FOLLOW ✅, SHARE 🙌 and COMMENT ✍ if you enjoy this idea! Also share your ideas and charts in the comments section below! This is best way to keep it relevant, support us, keep the content here free and allow the idea to reach as many people as possible. **
---
💸💸💸💸💸💸
👇 👇 👇 👇 👇 👇
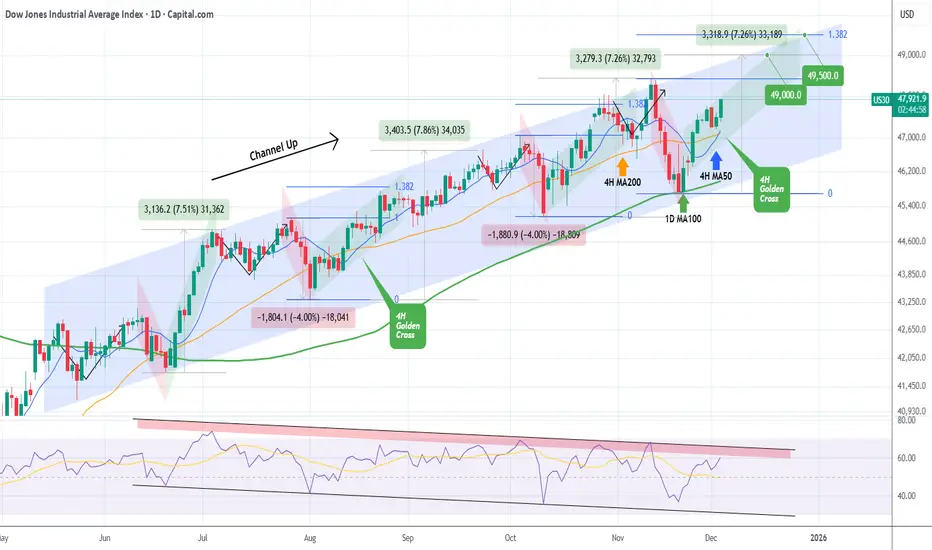
DOW JONES formed its first 4H Golden Cross since August. BullishDow Jones (DJI) has been trading within a 6-month Channel Up and today it formed its first 4H Golden Cross since August 15. Coming off a Higher Low bottom 2 weeks ago on the 1D MA100 (green trend-line), we are currently on the new Bullish Leg of the pattern.
The last one rose by +7.26%, roughly the % amount of the previous two as well, so our immediate Target remains 49000 as we've shown on last weeks analysis.
This time we also see an over-extended Target if the end-of-year rally lasts a bit longer, on the 1.382 Fibonacci extension at 49500, as this level has been hit on every Bullish Leg of this pattern.
If the 1D RSI though hits its Lower Highs Zone (red) earlier, it might be a good idea technically to book profits before those Targets are reached.
---
** Please LIKE 👍, FOLLOW ✅, SHARE 🙌 and COMMENT ✍ if you enjoy this idea! Also share your ideas and charts in the comments section below! This is best way to keep it relevant, support us, keep the content here free and allow the idea to reach as many people as possible. **
---
💸💸💸💸💸💸
👇 👇 👇 👇 👇 👇
WARNING! 22 States Already In Recession.What the map is actually saying
This map claims that as of October 2025, 22 states are either:
Already in recession (red)
At high risk of recession (also red)
“Treading water” (yellow — basically flat growth)
Only the green states are shown as still expanding.
What this really means
This is a state-level business cycle indicator. States can slip into recession long before the national data officially confirms a U.S. recession.
Why? Because:
State economies depend heavily on specific industries (energy, tech, manufacturing, tourism).
Those sectors can crash regionally without the whole country being in recession—yet.
So a cluster of red states = early warning signal.
The big takeaway
When half or more of the states show contraction, historically, the national recession follows within months.
It means:
Job growth is stalling.
Local tax revenues are falling.
Credit conditions are tightening.
Businesses are cutting spending.
Consumers are slowing down.
In simple terms:
When enough states catch pneumonia, the U.S. national economy gets sick. You have been WARNED!
GTFO and STFO!
THANK YOU for getting me to 5,000 followers! 🙏🔥
Let’s keep climbing.
If you enjoy the work:
👉 Boost
👉 Follow
👉 Drop a solid comment
Let’s push it to 6,000 and keep building a community grounded in truth, not hype.

DOW JONES INDEX GOES 'CUP AND HANDLE' PATTERN. HERE'S WHYA cup and handle is a bullish technical analysis pattern that signals a continuation of an uptrend and a potential buying opportunity. It appears as a U-shape (cup), followed by a slight decline or consolidation (handle), after which further price gains are expected. The pattern was popularized by William O'Neil in 1988.
Cup and Handle
Cup: A U-shaped movement that forms when an asset's price, after a rally, initially pulls back and then recovers to its previous highs.
Handle: After completing the cup, a slight correction or consolidation occurs, appearing as a downward-sloping line, sometimes shaped like a small cup. The handle typically forms on lower trading volume.
How it works
Buy: Traders look for a breakout from the handle amid rising trading volume, which is considered a buy signal. Trend Continuation: The pattern indicates that after a short pause, the asset is likely to continue its upward movement.
Target Calculation: The target price is often calculated by measuring the cup height and adding it to the breakout price to forecast the potential price movement.
What to Consider
The pattern can form on various timeframes, from intraday to monthly charts.
It is important to pay attention to the depth of the cup and handle, as well as the trading volume that confirms the signal.
Due to nearly 50% retrace we consider to take it up rn.
--
Best wishes,
@PandorraResearch Team

US Stock Indexes Broke New RecordsCBOT: Micro E-Mini Dow Jones Futures ( CBOT_MINI:MYM1! )
After a 9-day delay due to the U.S. government shutdown, the Bureau of Labor Statistics (BLS) released the September CPI data on October 24th. Here are the highlights:
• The Consumer Price Index for All Urban Consumers (CPI-U) increased 0.3% on a seasonally adjusted basis in September, after rising 0.4% in August.
• On an annual basis, the headline inflation rose 3.0% before seasonal adjustment.
• The CPI index for all items less food and energy, commonly known as the Core CPI, rose 0.2% in September, after rising 0.3% in each of the 2 preceding months.
As cooling inflation data spurred investor optimism, U.S. stocks reached new heights again on Friday. The market expects the Federal Reserve to stay on its rate-cutting path, boosting the U.S. economy and justifying higher stock valuations.
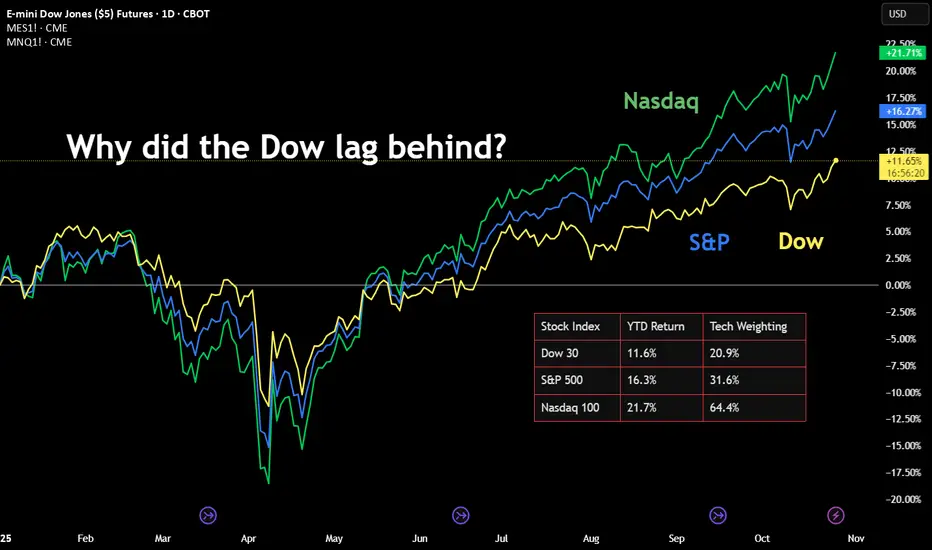
The Dow Jones Industrial Average rose 472.51 points, or 1.01%, to 47,207.12, securing its first close above the 47,000 level. The S&P 500 added 0.79% to 6,791.69, while the Nasdaq Composite climbed 1.15% to 23,204.87. All three closed at records.
Following the CPI data, traders increased their stakes that the Fed will cut rates in October and December. Odds for a December cut jumped to 98.5% from roughly 91% before the data, per the CME FedWatch tool. Odds for a cut next week remained above 95%.
The Case of Dow over S&P and Nasdaq
As of Friday, the Dow gained 10.55% year-to-date, while the S&P rose 15.01% and the Nasdaq was 20.18% higher in 2025.
Why did the Dow lag behind the S&P and the Nasdaq? A simple answer is due to its lower index weight on technology. Since the current bull market is primarily driven by A.I., the Dow benefited less comparing to the other two stock indexes.
The Dow has six component companies in the technology sector. Their combined weight comes to 20.91% of the 30-stock index as of today.
• Microsoft (MSFT), 6.82%
• IBM (IBM), 4.00%
• Apple (AAPL), 3.42%
• Salesforce (CRM), 3.32%
• Nvidia (NVDA), 2.43%
• Cisco (CSCO), 0.92%
For a comparison, the S&P 500 has a weighing of 31.6% on Information Technology, while the Nasdaq-100 has a weighing between 62.48% - 64.45% for Technology.
In my opinion, the stock market has already beaten up so much on the A.I. hype, and it is late in the bull market cycle. The Nasdaq-100 has a lofty valuation with a Price/Earnings ratio of 33.25 (trailing 12-month), according to Birinyi Associates. Meanwhile, the Dow has a more reasonable P/E ratio of 24.90.
I am bullish on U.S. stocks long term. However, I share the growing concerns about potential collusion among AI companies. Types of AI collusion under investigation:
• Partnerships and investments: Tech giants invest billions into AI startups. Are these deals designed to control the AI ecosystem and suppress competition?
• Algorithmic price-fixing: Companies may use AI-powered pricing algorithms to inflate prices. Antitrust agencies are actively scrutinizing potential collusive outcomes.
• AI companies may use shared platforms or common algorithms to align market strategies, potentially forming a tacit "hub-and-spoke" conspiracy.
• Companies initially release AI models as "open source" to gain market share, accumulate data, and establish an ecosystem, only to later close off access.
• Dominant tech firms with control over cloud computing infrastructure, proprietary data, and massive financial resources could entrench their positions in the AI market.
To summarize, the Dow is a safer bull-market strategy given its more reasonable valuation. Investors are wise to stay clear off the potential crush on the A.I. hype.
Trading with Micro E-Mini Dow Jones Futures
If a trader shares a bullish view on the Dow, he may consider using stock index futures to enhance investment returns.
Micro E-Mini Dow Jones futures (MYM) offer smaller-sized versions of CME Group’s benchmark Dow Jones futures (YM) contracts. Micro futures have a contract size of 0.5 times the DJIA index, which is 1/10th of the standard contract.
CME data shows that the E-Mini and Micro Dow Jones futures have a combined open interest of 105,674 contracts as of Friday. Due to the government shutdown, the CFTC Commitment of Traders report has not been updated since September 23rd. We are currently in the dark about the “Smart Money” positions in the Dow.
Buying or selling one MYM contract requires an initial margin of $1,371. With Friday settlement price of 47,396, each December contract (MYMZ5) has a notional value of $23,857. Compared with investing in stocks, the futures contracts offer a built-in leverage of about 17 times (=23857/1371).
Hypothetically, if Dow futures price moves up 5% to 49,766 by December, the index gain of 2,370 points will translate into $1,185 for a long position, given each index point equal to $0.50 for the Micro contract. Using the initial margin of $1,371 as a cost base, the trade would produce a theoretical return of 86.4% (=1185/1371).
Futures contracts have expiration days, and you may not hold them forever like stocks. To stay long in the DJIA, a trader may consider a futures rollover strategy. An illustration:
• A trader buys the lead contract December now, and holds it till the end of November
• He will then sell December and buy March, which will become the next lead contract
• He will repeat this process: buy June 2025 and sell March 2026 in February 2026
• Repeat this again to buy September 2026 and sell June 2026 in August 2026
This series of trades allows a trader to establish a long position in the DJIA throughout the year, while holding the most liquid contracts.
There is no guarantee that each trade will yield positive returns. But if the Dow is trending up over time, the position would likely pay off.
The leverage feature in futures works both ways. It would magnify the losses as well as improving the winnings. The good news is, a trader could put stop-loss on his futures trades, limiting the downside risks.
For example, our trader may set stop-loss at 45,000 when he buys the MYM at 47,396. If the Dow falls to 40,000, his position will be liquidated well before that when the price hits 45,000. The maximum loss incurred will be $1,198 (= (47396 - 45000) * 0.5), which is less than the initial margin of $1,371.
The combination of Futures Rollover with Stop-loss could yield higher returns (thanks to the leverage) while maintaining a limited loss exposure. If the index bounces up and down but trends up in the long stretch, the trader will see both wins and losses. Since the wins are unbounded but the losses are contained, the overall returns would likely be positive.
Happy Trading.
Disclaimers
*Trade ideas cited above are for illustration only, as an integral part of a case study to demonstrate the fundamental concepts in risk management under the market scenarios being discussed. They shall not be construed as investment recommendations or advice. Nor are they used to promote any specific products, or services.
CME Real-time Market Data help identify trading set-ups and express my market views. If you have futures in your trading portfolio, you can check out on CME Group data plans available that suit your trading needs www.tradingview.com
DOW JONES waiting for a rebound on its 4H MA50.Dow Jones (DJI) gave us last week (October 01, see chart below) an excellent Buy Signal on its 4H MA100 (green trend-line) that almost instantly hit our 47000 Target:
This time it is the 4H MA50 (blue trend-line) that is providing the new buy opportunity as following the 47000 Higher High of the Bullish Leg, the index pulled-back on a Bearish Leg.
As you can see, the symmetry within this pattern remains high with all three Bullish Legs so far rising by around +2.75% and the 4 MA50 / 4H MA100 providing support for the Bearish Legs.
As a result, we expect a new short-term rebound, as long as the 4H MA50 holds, targeting the 1.5 Fibonacci extension at 47180.
-------------------------------------------------------------------------------
** Please LIKE 👍, FOLLOW ✅, SHARE 🙌 and COMMENT ✍ if you enjoy this idea! Also share your ideas and charts in the comments section below! This is best way to keep it relevant, support us, keep the content here free and allow the idea to reach as many people as possible. **
-------------------------------------------------------------------------------
💸💸💸💸💸💸
👇 👇 👇 👇 👇 👇

DJI Holy sh!% Bubble, 2028Just an idea I was playing around with, Dow Jones on this long parabolic move and the resulting crash wIll be fantastically devastating for the american people, again.

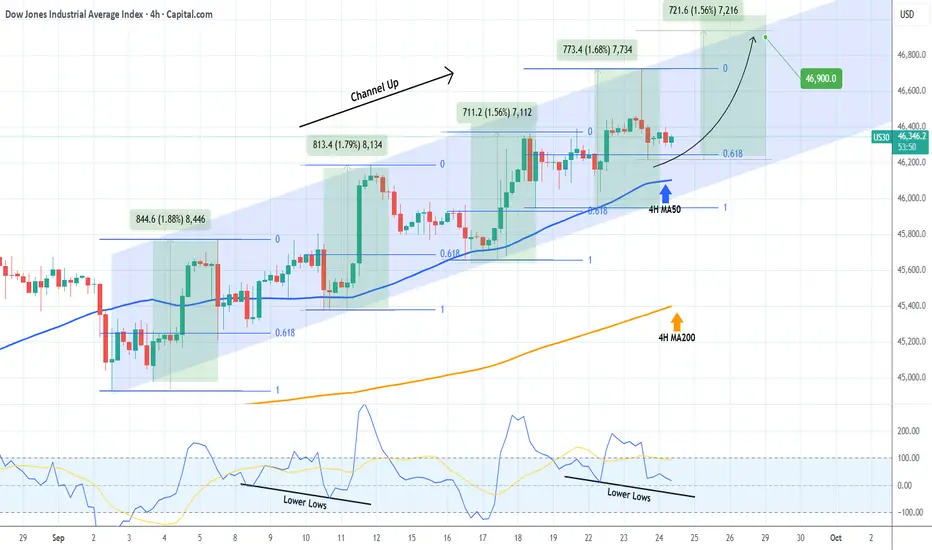
DOW JONES forming a bottom ahead of the next rally.Dow Jones (DJI) has been trading within a Channel Up since the start of September and right now it is consolidating after having hit the 0.618 Fibonacci retracement level, following a Higher High rejection at the top of the pattern.
As you can see, the 0.618 Fib was always pull-back tested after a Higher High, with the 4H MA50 (blue trend-line) also or at least coming very close to. As a result, the current 4H candle consolidation is technically a bottoming process before the new Bullish Leg.
The weakest Bullish Leg of this Channel Up has been +1.56%, which more than covers our 46900 Target.
-------------------------------------------------------------------------------
** Please LIKE 👍, FOLLOW ✅, SHARE 🙌 and COMMENT ✍ if you enjoy this idea! Also share your ideas and charts in the comments section below! This is best way to keep it relevant, support us, keep the content here free and allow the idea to reach as many people as possible. **
-------------------------------------------------------------------------------
💸💸💸💸💸💸
👇 👇 👇 👇 👇 👇
Dow Jones support levels to watchThe Dow was the star of the show yesterday. After chopping sideways for a few days above the 45,000 mark – a crucial resistance level taken out back in late August – we’ve finally got that breakout everyone was waiting for. Thursday's push through the resistance around 45,760 is a strong signal that the bulls are still in charge. As long as we hold above that level on any retest, the uptrend looks very healthy. If we slip back below, yes, things could get a bit messy, but honestly, the broader structure still screams bullish. The 45,000 level remains the real line in the sand – lose that and the tone changes, but for now, I’d be surprised if we don’t see higher highs from here.
By Fawad Razaqzada, market analyst with FOREX.com

DOW JONES close to a Triangle break-out leading to 47500!Dow Jones (DJI) has been trading within a Channel Up pattern since April 24. Following the August 21 Low, it entered a short-term Ascending Triangle pattern, looking identical to May - June, which also started after a 4H MA50 (blue trend-line) test.
That pattern was a re-Accumulation phase, which after breaking upwards pushed the price just below its 2.5 Fibonacci extension.
With also similar 4H RSI sequences, we expect a similar reaction upon a Triangle break-out, targeting 47500 (Fib 2.5 extension).
-------------------------------------------------------------------------------
** Please LIKE 👍, FOLLOW ✅, SHARE 🙌 and COMMENT ✍ if you enjoy this idea! Also share your ideas and charts in the comments section below! This is best way to keep it relevant, support us, keep the content here free and allow the idea to reach as many people as possible. **
-------------------------------------------------------------------------------
💸💸💸💸💸💸
👇 👇 👇 👇 👇 👇

DOW JONES Buy opportunity on oversold 4H RSI.Dow Jones (DJI) has been trading within a Channel Up since the July 31 High and yesterday hit its bottom (Higher Lows trend-line) and rebounded.
Every short-term break just below the 4H MA50 (blue trend-line) of this pattern since August 11, has been the most optimal buy opportunity. Technically as long as the 1D MA50 (red trend-line) holds, the medium-term trend remains bullish.
Given also that the 4H RSI made an oversold rebound, first since August 04, we have a strong buy signal currently, which based on the previous Bullish Legs of the pattern, can rise by at least +2.67%. As a result, our short-term Target is 46100.
-------------------------------------------------------------------------------
** Please LIKE 👍, FOLLOW ✅, SHARE 🙌 and COMMENT ✍ if you enjoy this idea! Also share your ideas and charts in the comments section below! This is best way to keep it relevant, support us, keep the content here free and allow the idea to reach as many people as possible. **
-------------------------------------------------------------------------------
💸💸💸💸💸💸
👇 👇 👇 👇 👇 👇

DOW JONES assisted by the 4H MA50 this Bullish Leg targets 47200Dow Jones (DJI) has turned its 4H MA50 (red trend-line) into Support and following the August 01 (Higher Low) bottom on the 1D MA50 (blue trend-line), it is extending the new Bullish Leg of the 4-month Channel Up.
With the 1D RSI also bouncing on its medium-term Support, this is a strong short-term buy signal. The previous two Bullish Legs both rose by a little over +9.00%. This gives us a 47200 Target on the short-term.
-------------------------------------------------------------------------------
** Please LIKE 👍, FOLLOW ✅, SHARE 🙌 and COMMENT ✍ if you enjoy this idea! Also share your ideas and charts in the comments section below! This is best way to keep it relevant, support us, keep the content here free and allow the idea to reach as many people as possible. **
-------------------------------------------------------------------------------
Disclosure: I am part of Trade Nation's Influencer program and receive a monthly fee for using their TradingView charts in my analysis.
💸💸💸💸💸💸
👇 👇 👇 👇 👇 👇

Are Longterm Interest Rates Telling Us Something?I rarely cite financial news in my market updates.
My reasoning is simple: all perspectives, bullish or bearish, are ultimately reflected in price action. That price action forms patterns, and those patterns can be analyzed to produce reasonable forecasts. After years of applying Elliott Wave theory, this approach has consistently stood the test of time.
That said, I’ll break from tradition today, as I believe the following excerpt is particularly relevant to my latest Trading View update. It comes from Barbara Kollmeyer’s article, “There’s a slow-motion crisis in bonds — and this bearish strategist thinks it will hit stocks.”
For context, I regularly track multiple market indices, futures contracts, single stocks, and notably, the yield on the 30-year U.S. Treasury Bond. For the past year, I’ve highlighted the counterintuitive rise in long-term yields that ironically began when the Fed started cutting its benchmark rate in September 2024. While brief divergences between long-term yields and Fed policy aren’t unusual, this persistent uptrend is different. The yield has been carving out a clear pattern of higher highs and higher lows, appearing now on the verge of a breakout—not just toward incremental new highs, but potentially into a runaway scenario for long-term rates.
This is why Albert Edwards’ recent comments caught my attention:
“There is a slow-motion crisis unfolding in the government bond markets that equity investors continue to ignore at their peril. The upward grind for long bond yields has been relentless, yet investors keep ignoring that to focus instead on more bullish metrics such as the latest reporting season driven by the mega-cap IT stocks, that promises a pot of gold at the end of the AI rainbow.”
His perspective resonated with me.
Having lived through the dot-com boom and bust, I recall how new technologies can fuel outsized market optimism. AI undoubtedly carries transformational potential, much like the Internet. But just as it took nearly two decades for the Internet to fully translate from speculative boom to tangible economic value, AI’s payoff will likely follow a similarly extended trajectory. It’s not an immediate catalyst.
What I am certain of is this: the cost of long-term money is rising, with implications far beyond bond charts. Higher yields directly affect mortgage rates and other long-term financing costs. More importantly, sustained upward pressure in long-term rates has the potential to weigh heavily on equities, broader markets, and asset valuations for far longer than many currently expect.
DJIA bull flagging ahead of 45KThe Dow has opened lower, but with all eyes on the Fed's Powell tomorrow the weakness can be explained away in part by profit-taking. Whether this turns into something more signifcant remains to be seen.
For now, the bullish trend is intact. The 45,000 level has been tested multiple times since November 2024, and this level has held as resistance every single time. Most recently, it was Friday when it finally looked like the bulls were given the all-clear. But the index turned lower to close below that hurdle and again frustrated the bulls.
So far, though, the downside has been limited on this latest failed breakout attempt. This suggests that the index is still gearing up for a potential breakout.
Short-term support at 44,750 has held so far this week, and was being tested again at the time of writing. Below here, 44,500 and then 44,300 are the next key short-term support levels. Even if we see renewed weakness here, so long as the long-term support in the range between 42,800 to 43,150 holds, the path of least resistance would still remain to the upside in so far as the slightly longer-term is concerned. Here, we also have the 200-day average residing.
By Fawad Razaqzada, market analyst with FOREX.com

DOW JONES Double MA50 Support Zone coming to the rescue?Dow Jones (DJI) has been trading within a 4-month Channel Up and following the recent High, the price started to pull-back ahead of this week's major macroeconomic events.
By doing so, it has approached the 4H MA50 (blue trend-line), which has been the first line of Support inside this pattern. The previous (Higher) Low of the Channel Up was priced on the 1D MA50 (red trend-line) and the 2 form the strongest medium-term Support Zone at the moment.
With even the 4H RSI fractals identical, the current price action resembles the June 12 one, post 1D MA50 Low (May 23). Even if the 4H MA50 breaks, the trend will remain bullish unless it closes a 1D candle below the 1D MA50 (which would also be an invalidation of the Channel Up).
The most common rise on a Bullish Leg on this pattern has been +9.00%. As a result, our Target is 47200 as we enter September.
-------------------------------------------------------------------------------
** Please LIKE 👍, FOLLOW ✅, SHARE 🙌 and COMMENT ✍ if you enjoy this idea! Also share your ideas and charts in the comments section below! This is best way to keep it relevant, support us, keep the content here free and allow the idea to reach as many people as possible. **
-------------------------------------------------------------------------------
Disclosure: I am part of Trade Nation's Influencer program and receive a monthly fee for using their TradingView charts in my analysis.
💸💸💸💸💸💸
👇 👇 👇 👇 👇 👇

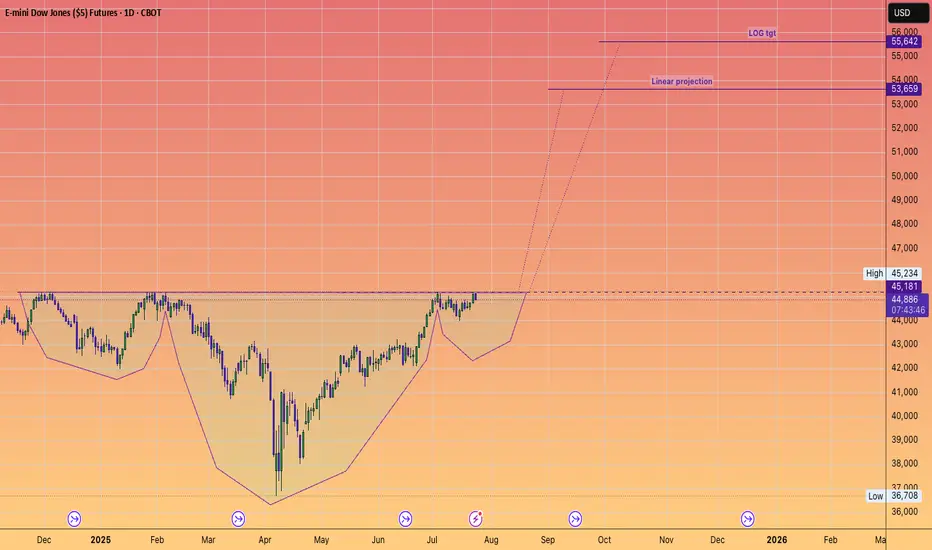
DOW JONES to 55,642#InverseHead&Shoulders
Projects record new highs.
Another stepping stone to our long held forecast of 64,000
Why?
Because AI will significantly contribute to an EXPANDING #GDP
DOW JONES Channel Up on its strongest Support.Dow Jones (DJI) has been trading within a Channel Up since the April 25 Low and right now it is consolidating straight after a direct contact and bounce on the 1D MA50 (blue trend-line).
Given that this also took place at the bottom of the Channel Up, it is a technical Higher Low formation, thus the strongest Support level possible.
With the 1D RSI also rebounding around the same level as the previous Higher Low, we expect the next technical Bullish Leg of the Channel Up to begin. The previous two rose by at least +7.00%, so the minimum Target we are looking for on the short-term is 46350.
-------------------------------------------------------------------------------
** Please LIKE 👍, FOLLOW ✅, SHARE 🙌 and COMMENT ✍ if you enjoy this idea! Also share your ideas and charts in the comments section below! This is best way to keep it relevant, support us, keep the content here free and allow the idea to reach as many people as possible. **
-------------------------------------------------------------------------------
Disclosure: I am part of Trade Nation's Influencer program and receive a monthly fee for using their TradingView charts in my analysis.
💸💸💸💸💸💸
👇 👇 👇 👇 👇 👇

SPX to 6600+ by Aug 5This leg up in SPX is not over yet. Target at upper bound of the channel around 6.6K+ by Aug 5.

US30 Robbery Blueprint: Breakout, Pullback, Escape Setup💎 Dow Jones Robbery Blueprint: The US30 Vault Crack Plan 💎
(Maximized for reach — within TradingView title limit)
🌟Hi! Hola! Ola! Bonjour! Hallo! Marhaba!🌟
Dear Market Robbers & Money Movers 🕵️♂️💰🚨
This ain't your average analysis — it’s a Thief Trader-style 🔥tactical mission🔥 aimed at the mighty "US30/DJI" (Dow Jones Industrial Average). We're talkin' about a precision heist with a full blueprint: entry zones, trap setups, and escape exits. Read carefully — this ain’t for the faint-hearted traders! 🧠🦾
🧠 Entry Zones (The Break-In) 📈
🛠 ENTRY 1: Crack the wall near 44700.00 – that’s the resistance gate. Wait for confirmation.
🎯 ENTRY 2: Sneak in at the Market Makers’ Trap around 43500.00 – a dirty zone where retailers get baited. Perfect time to strike long!
🧱 DCA/Layering strategy recommended. Stack those buy orders like a thief layering explosives on a safe. 💣💸
🛑 Risk Levels (Escape Routes/Stop Loss)
🔊 "Listen up, vault raiders! Never drop your SL until breakout is confirmed. If you jump early, you might land in a bear trap! 🪤"
🔐 Stop Zones (Based on Strategy):
📌 Swing Buy SL (2H TF): Place at 44100.00 for the stealth buy.
🏦 Institutional SL (Swing Zone): Drop it around 43000.00
🔐 Max Risk SL (3H TF): If you're deep, your last stand is at 39200.00
☝️ SL depends on your position sizing, number of entries, and risk appetite. Trade like a thief, not a gambler.
🎯 Heist Target (Profit Exit)
🏁 Escape Point: 46200.00 — or exit before heat rises! Don’t be greedy. Rob and vanish. 💨💰
🔥 Market Mood: Why the Heist Is On
"US30/DJI" is bullish AF — thanks to:
📊 Macro-Economic Wind at Our Back
📈 Institutional momentum
📰 Strong sentiment and intermarket flows
Check your chart radar: Fundamentals + technicals aligning = green light for robbery! 🟢
⚠️ Tactical Reminder: News Can Jam the Plan
📵 Avoid new entries during major economic releases
🛡 Use trailing SLs to protect running trades
Stay alert, stay alive. 💡
❤️ Support the Robbery Crew
Hit that 💥BOOST💥 — your love fuels our next mission.
Join us and ride daily heist plans with Thief Trading Style 🏴☠️🚀💰
