DIA — Bullish Coverage Initiated | 04/06/2026Summary
DIA is the SPDR Dow Jones Industrial Average ETF, a fund that tracks 30 major blue-chip U.S. companies and is widely used as a proxy for the Dow. Buyers are in control right now, and 477.87 is the key level that matters most. As long as DIA holds above that line, the bullish structure remains intact.
Current Read
DIA gives exposure to large, established U.S. industrial and blue-chip names, with strengths in stability and broad corporate leadership, while remaining vulnerable to econo
Djx
Bearish Forecast for the Dow Jones Starting May 15, 2025Bearish Forecast for the Dow Jones Starting May 15, 2025
The Dow Jones Industrial Average is poised to begin a significant decline, potentially as early as today, May 15, 2025, targeting a retest of the price low from April 7, 2025 (~36,611.78), and possibly lower. This movement is driven by renewed trade tensions, disappointing economic data, and bearish market sentiment.
1. Fundamental Factors Driving Potential Decline
Fundamental factors provide the macroeconomic and policy-driven rati
Ride the Japanese Wave, Don't Grab That China Falling KnifeIt was nearly three years ago when the China stock market notched a short-term peak. Recall how the world's second-largest economy was initially seen as a growth engine coming out of the worst of the pandemic. An authoritative regime in China, led by President Xi Jinping, crippled the economy's expansion trajectory through harsh ongoing lockdowns and by clamping down on many industries, one after another. Then in early 2023, hope sprang eternal that China would re-open amid a burst of consumer s
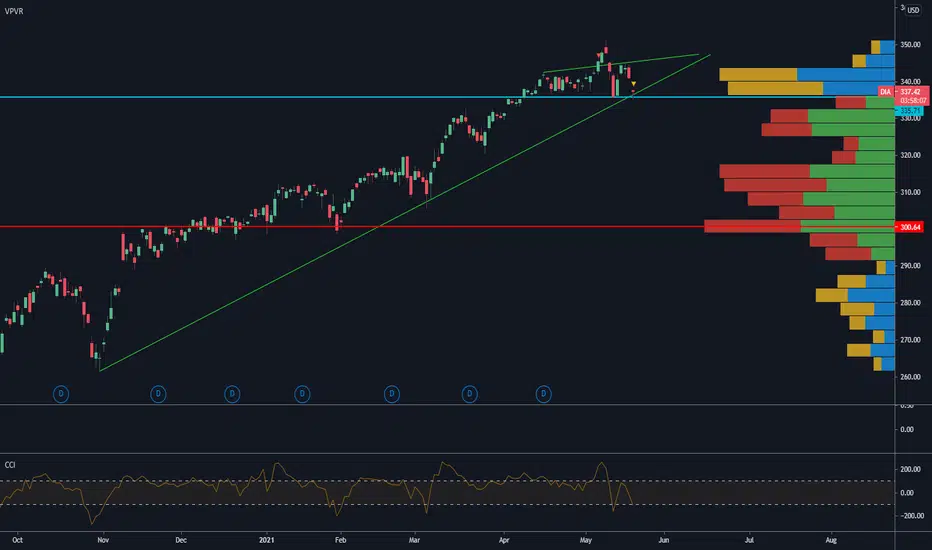
[Dow Jones] bearish- strong resistance around 340
- bearish divergences
- bearish S&P500 (coming recession)
DShort
11 Trade Ideas Predicting The DJI Crash | Where Is The Bottom?The Dow Jones Industrial Averages index has been holding much, much better compared to the S&P 500 and Nasdaq indexes.
While the other two indexes have been down considerably since we started to predict the crash (18% SPX & 25% NDX), the Dow Jones (DJI) has gone down only by 12%.
This is the last one of this series of articles.
Feel free to relax as we get started!
Thanks a lot for your support.
---
Let's start with the chart above on the Monthly timeframe.
The DJI closed last month below E
💾 DJI Bear-Run 2023 & Beyond | The New World OrderWhy do you think there is such a strong rush to close/shutdown everything crypto?
The traditional global financial system is about to crash and they don't want competition. Remember, they are owned by banks and banks are used to having a monopoly on money.
If the financial system crashes due to its many weaknesses, it will lose all of its customers to the other side.
If they can shut down the other side, people can just cry and rebel but they would have no other choice other than to use what
💾 DJI Bullish But Why? & BitcoinNotice how the August 2022 peak is followed by a strong correction, instantly.
The November and December 2022 peak is followed by sideways consolidation.
That's why I consider this chart to be bullish.
I make the same argument for Bitcoin.
In the past, each time a peak is hit we have a strong correction immediately after.
In the present, as each new peak is hit, we get sideways consolidation.
That's a bullish signal.
Thank you for reading.
Namaste.
[Dow Jones] bearishBearish divergence and death cross.
This idea is a trend hypothesis, do your own research.
DShort
DJI And The 20 Year MACD SupportWe have the Dow Jones Industrial Average Index (DJI) opening red below MA200... Full bearish control.
This is the same signal we looked at on the S&P 500 Index (SPX).
Just like Ethereum, Cardano, Bitcoin, Solana, Polkadot, etc. The SPX, DJI, NDX all move together.
What one does, the rest follows.
Here is the daily MACD for the DJI:
We just lost a 20+ year long support.
This is a very bad signal that tells us of a potentially strong correction to come.
The correction has already started.
Wh
Bearish Stockmarket DJXA fortnight ago gave us a real warning with big drops in the market.
10th May was the last higher high and the stochastic RSI showed pressure and selling commenced
.Close to a month later 7th June the stochastic RSI was overbought once again but this time the price had dropped a lower high position
The structure is the same and the price making a 2nd lower high.
Being out of the market and being patient right now is a smart move
These are my opinions of how I view the market
DShort
DShort
$DJX Daily TOP #Dow$DJX may be on the verge of a major decline.
Many signals points into that direction:
- S13 exhaustion point recorded today (October 6th)
- Daily Price Flip
- Daily close near Demand Line
- Wave B recently triggered after a recent advance of 5 upwaves
- RSI lagging near neutral zone
From this observation, 3 different scenarios can be drawn:
1. Moderate Bear
Wave C ends near 240/250 before resuming a new uptrend
2. Strong Bear
There is a larger picture where the decline generated by Covi
DShort
DShort
HOW TO USE MACD INDICATOR? [EDUCATION]✅We talked about MACD indicator and 2 ways that we can use it.
I really enjoyed making this video, I hope you as well. 🙏
We will continue our education videos, so, i am looking forward to sharing them.
Take it easy.
~Bo Bugra Sukas
✌️
---------------------
✅We talked about MFI indicator here.
---------------------
✅We talked about RSI indicator here.
look with new lens I think we are at the point where there could be a rapid change in sentiment based on the viruses progress, global tensions, oil price war, etc.
If there is no "event" to push the market down rapidly, I believe the return to "normal" will be slower than anticipated for many people. The virus obviously has had, and continues to have, major effects on every industry/sector.
lines on chart are levels of interest/loose trends based on
blue = 3M
purple = 1M
grey = 1W
I think we may reach 2300-240
UShort