ADA Double BottomADA gets a double bottom signal from early April to mid June. The chart momentum broke the neckline twice, confirming the double bottom signal, promising a break to the upside. (LONG) I'm hoping for a break at $1.01.
Double Bottom

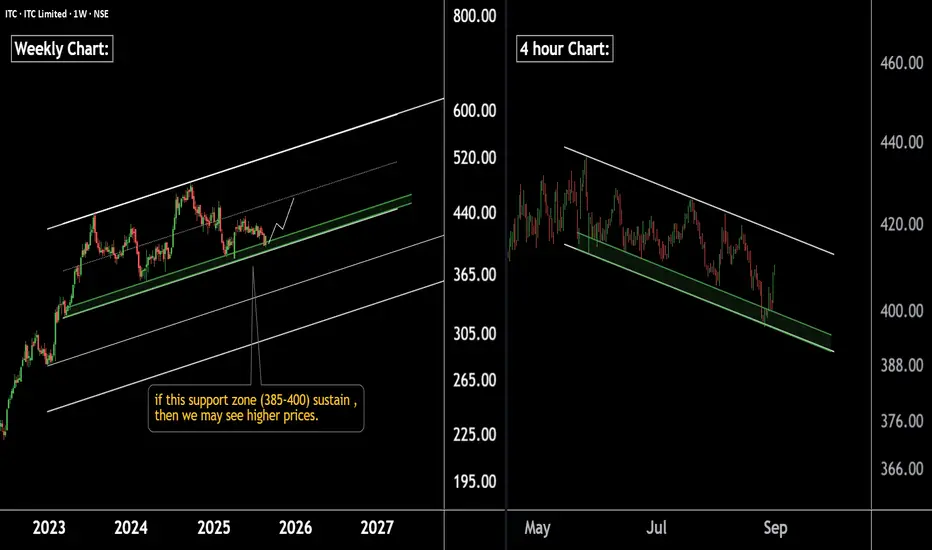
ITC at strong support zone. A good opportunity for accumulation.ITC Chart Update (Weekly & 4H Timeframe)
On the weekly chart, ITC is moving within a well-defined parallel channel, with immediate support in the 385–400 zone. A breakdown below this zone could take the stock towards the next strong support near 300.
On the 4-hour chart, ITC is forming a falling channel, with support also placed around the 390–400 zone. If this level holds, we may witness a potential upside move in ITC.
Conclusion: The 390–400 zone will play a decisive role. Sustaining above it may trigger an upward move, while a breakdown could extend weakness towards lower levels.
EURUSD Breakdown or Double Bottom? Catalysts at Jackson Hole!EURUSD has broken below the key 1.16 support ahead of the Jackson Hole Symposium, raising the stakes for both bulls and bears as markets become more aware of the likelihood of a hawkish stance.
But will it be the case?
Let's see what the possible scenarios are at play.
Bearish Catalysts :
Hawkish Fed Signals: Recent FOMC minutes and a potential hawkish tone from Chair Powell could push EURUSD lower. Rate cut odds for December have dropped sharply, and further Fed focus on inflation may accelerate downside.
Technical Breakdown: The loss of 1.16 opens the door to 1.1530, 1.1460, and possibly 1.14. No clear bullish divergence on RSI suggests more downside risk.
Geopolitical Risks: Uncertainty around the Ukraine ceasefire could weigh further on the euro.
Bullish Catalysts :
Oversold Conditions: EURUSD is approaching oversold territory, with a potential double bottom forming near 1.1530/1.1460.
Dovish Surprise: If Powell signals concerns over the labour market or hints at a pause, a short-covering rally could target 1.16 and above.
ECB Commentary: Any unexpected hawkishness from ECB President Lagarde could support the euro.
Key Levels to Watch :
Support: 1.1530, 1.1460, 1.1400
Resistance: 1.1600, 1.1660
Trading Plan :
Volatility is likely post-symposium. Bears may look for breakdowns and rallies to resistance for entries, while bulls might watch for reversal signals at key supports if the Fed surprises dovishly.
This content is not directed to residents of the EU or UK. Any opinions, news, research, analyses, prices or other information contained on this website is provided as general market commentary and does not constitute investment advice. ThinkMarkets will not accept liability for any loss or damage including, without limitation, to any loss of profit which may arise directly or indirectly from use of or reliance on such information.

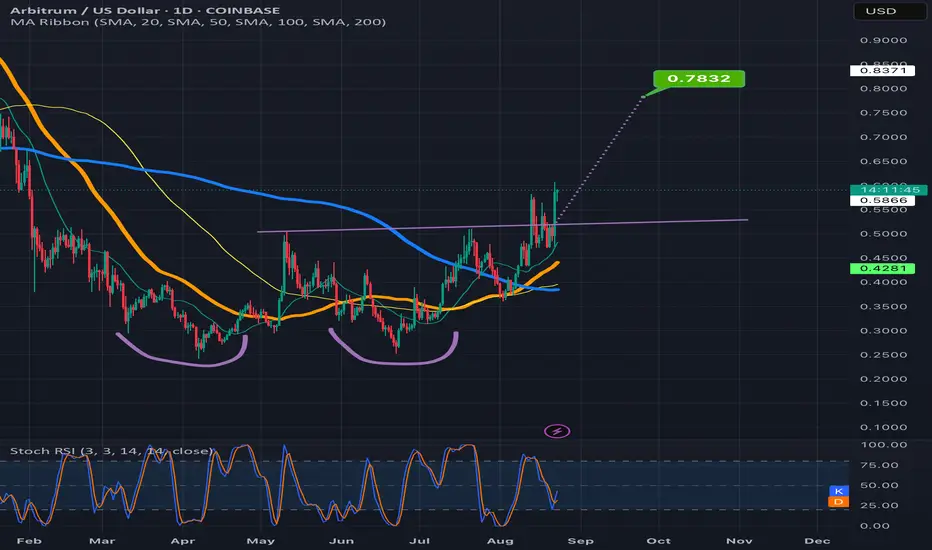
Arbitrum ready for the double bottom breakout?It’s already broken above the neckline recently then dipped back below so another dip back below is certainly possible, however after the recent bullish sentiment from Jackson Hole, I think probability favors the breakout getting confirmed in the very near future. *not financial advice*
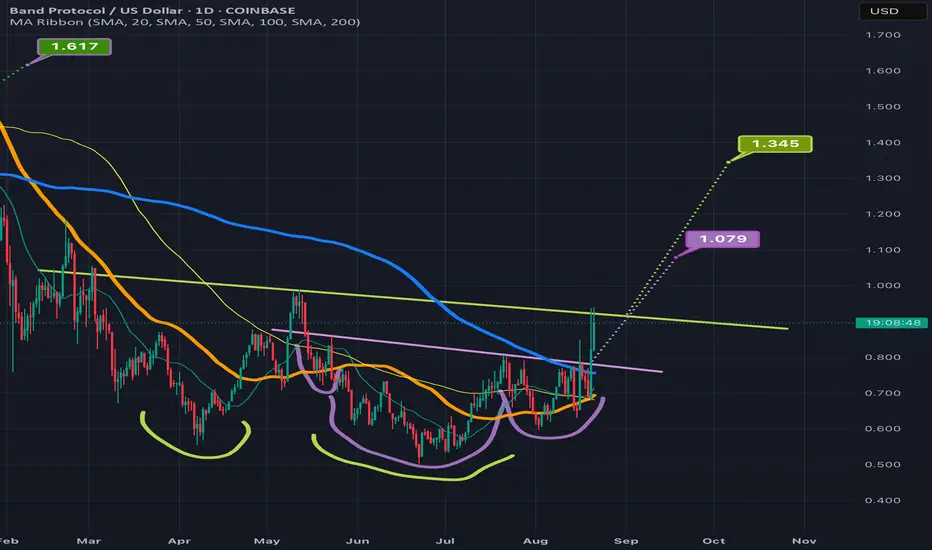
BANDUSD attempting an invh&s + double bottom breakoutBAND has been available for a significant iscount lately but the sale may be ending soon as it is now attempting both an inverse head & shoulders breakout, as well as sending wicks above the neckline of a slightly larger double bottom pattern. The double bottom pattern is in chartreuse and the inverse head and shoulder pattern is in lilac. We can also see BAND looks lke it’s about to have a golden cros in the next week or 2 which should increase probability to confirm the breakout of these two bullish patterns as it will add bullish confluence as long as prce action isn’t two high above the 30&200 moving averages at the time of the golden cross *not financial advice*
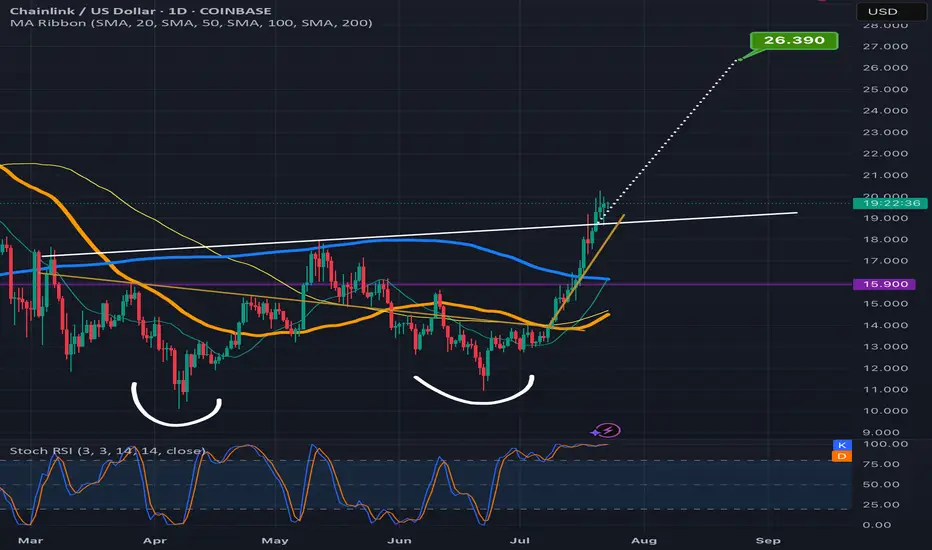
Chainlink looks ready 2 break up from bullflag & a double bottomGreen target is the bullflag white target is the double bottom. *not financial advice*
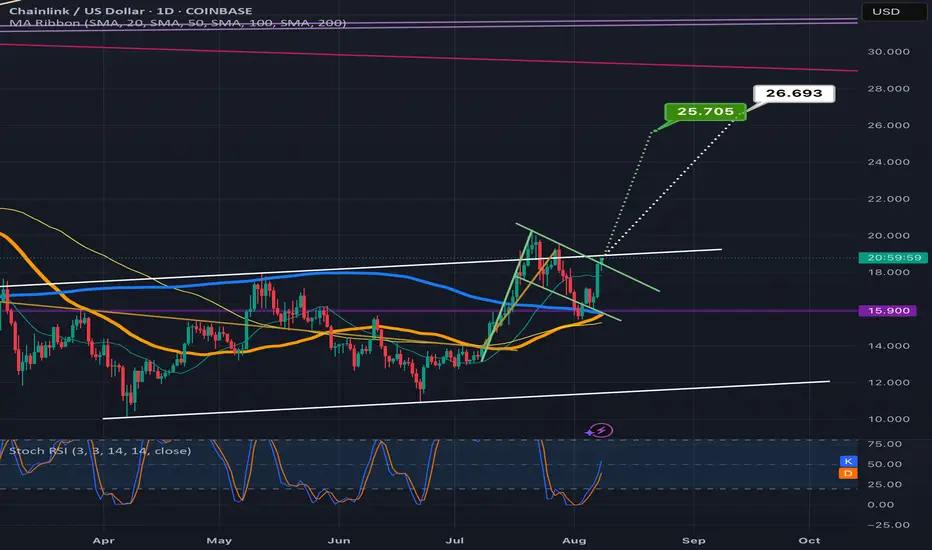
Chainlink climbing the measured move line staircaseLooks like Chanlink is ready to confirm the double bottom breakout here as the past few candles have already started to climb up the measured move line like a staircase.Always possible for a dip back below the neckline at this point but probability slightly favors the readout being validated instead for now. *not financial advice*
10Y Futures Case Study: Trading the Breakout with Defined Risk1. Introduction
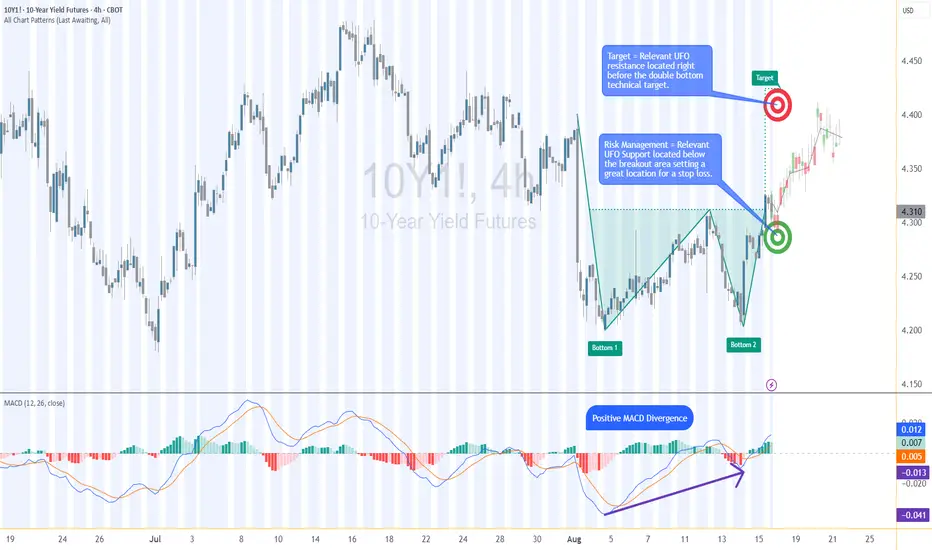
The 10-Year Yield Futures market has recently drawn attention as it builds a constructive base and attempts to shift momentum higher. After weeks of choppy movement, price action on the 4-hour chart has resolved into a breakout scenario that could define the next leg for yields. At the heart of this case study is a double bottom formation, a classical reversal structure, confirmed at 4.321. What makes this setup more compelling is the presence of nearby support and resistance zones, providing a precise technical framework to define entries, targets, and stop placement with discipline.
2. Double Bottom Pattern
The double bottom is one of the most reliable chart patterns signaling the potential exhaustion of selling pressure. It typically forms after a downtrend, with two consecutive troughs creating a strong support base before buyers regain control. In the current 10-Year Yield Futures chart, the first bottom occurred near 4.20, followed by a retest close to the same level. The neckline breakout emerged at 4.312, marking the confirmation point. Applying classical pattern analysis, the measured move points toward a target near 4.396. This alignment of structure and projection provides traders with a clear and objective technical roadmap.
3. MACD Confirmation
Momentum indicators often add depth to price action analysis, and the MACD (Moving Average Convergence Divergence) is one of the most widely followed. Built from the relationship of short- and long-term moving averages, it helps reveal underlying shifts in strength. In the current 10-Year Yield Futures chart, the MACD displayed a positive divergence: while price carved lower lows during the second bottom, the MACD lines began to slope higher. This divergence often signals weakening bearish momentum and the early stages of accumulation. In this case, it reinforces the validity of the double bottom breakout and its bullish potential.
4. UFO Support & Resistance
UnFilled Orders, or UFOs, represent areas where pending buy or sell orders may remain active, providing powerful zones of support or resistance. On the 10-Year Yield Futures chart, a key UFO support sits just below the breakout at 4.278, making it a logical stop-loss placement to protect the trade. Meanwhile, the upside target of the double bottom at 4.396 coincides with a UFO resistance zone. This overlap creates a clear exit area where supply may re-emerge. By combining classical charting techniques with order-flow–based zones, traders gain a structured plan that balances opportunity with risk control.
5. Trade Idea (Illustrative Case Study)
In this case study, the trade idea develops around the breakout point of 4.312 with the current price at the time of writing this article of 4.321. A trader could consider going long if the market sustains above this neckline level. The projected target is the resistance zone at 4.396, while the protective stop loss can be placed just below the UFO support at 4.278. This creates a defined risk profile with a reward-to-risk ratio of roughly 2:1. Alternatively, more conservative traders might consider a wider stop beneath the second bottom, offering more tolerance against volatility but at the expense of risk-reward efficiency. Both options maintain risk clarity and structure.
6. Contract Specifications & Margin Overview
The 10-Year Yield Futures (ticker: 10Y or 10Y1! on TradingView) is a cash-settled futures contract that tracks the 10-year U.S. Treasury yield directly. The gain or loss per tick per contract is as follows: 1 tick = 0.001 Index points (1/10th basis point per annum) = $1.00.
According to CME’s margin schedule (which changes as market conditions change through time), the current margin requirement is approximately $300 per contract. These relatively modest requirements make the product accessible while still providing meaningful exposure to U.S. interest rate markets.
7. Importance of Risk Management
Even with technically strong setups, the defining factor between consistent traders and inconsistent ones is risk management. Futures are leveraged products, meaning a small price move can translate into significant profit or loss. Using stop-loss orders helps enforce discipline, ensuring that one trade does not spiral into uncontrolled exposure. In this case, the support at 4.278 provides a logical technical area for a stop. Regardless of market outlook, avoiding undefined risk is key to long-term survival and consistency.
8. Closing Remarks
The alignment of a double bottom breakout, positive MACD divergence, and key support and resistance zones creates a textbook technical case study in the 10-Year Yield Futures market. With a clearly defined entry, target, and stop-loss, this setup demonstrates how combining price patterns with momentum and order-flow levels can help build structured trade plans. Yet, no analysis guarantees outcomes, and discipline remains at the core of every approach.
When charting futures, the data provided could be delayed. Traders working with the ticker symbols discussed in this idea may prefer to use CME Group real-time data plan on TradingView: www.tradingview.com - This consideration is particularly important for shorter-term traders, whereas it may be less critical for those focused on longer-term trading strategies.
General Disclaimer:
The trade ideas presented herein are solely for illustrative purposes forming a part of a case study intended to demonstrate key principles in risk management within the context of the specific market scenarios discussed. These ideas are not to be interpreted as investment recommendations or financial advice. They do not endorse or promote any specific trading strategies, financial products, or services. The information provided is based on data believed to be reliable; however, its accuracy or completeness cannot be guaranteed. Trading in financial markets involves risks, including the potential loss of principal. Each individual should conduct their own research and consult with professional financial advisors before making any investment decisions. The author or publisher of this content bears no responsibility for any actions taken based on the information provided or for any resultant financial or other losses.
USDT Dominance at crucial 3.8 percent support level !USDT dominance is hanging around the 4% mark, and history shows it doesn’t spend much time below here. The 3.8% zone has been a strong bounce point—think March 11, 2024, and again late December / late January, both forming a clean double-bottom.
Right now, we could be setting up for the same pattern. If 3.8% holds, a bounce is likely, and we could see dominance climb back toward the 6–6.5% zone before rolling over.
But if it breaks decisively below 3.8%, that would be a first in years and could trigger a larger market shift—possibly a super cycle where BTC runs toward 150–200K.
Historically, late August into September often brings corrections or dumps, so I’m watching closely over the next few weeks.
Bottom line:
3.8% holds → bounce likely.
3.8% breaks → game changes completely.
What’s your take—bounce or break?

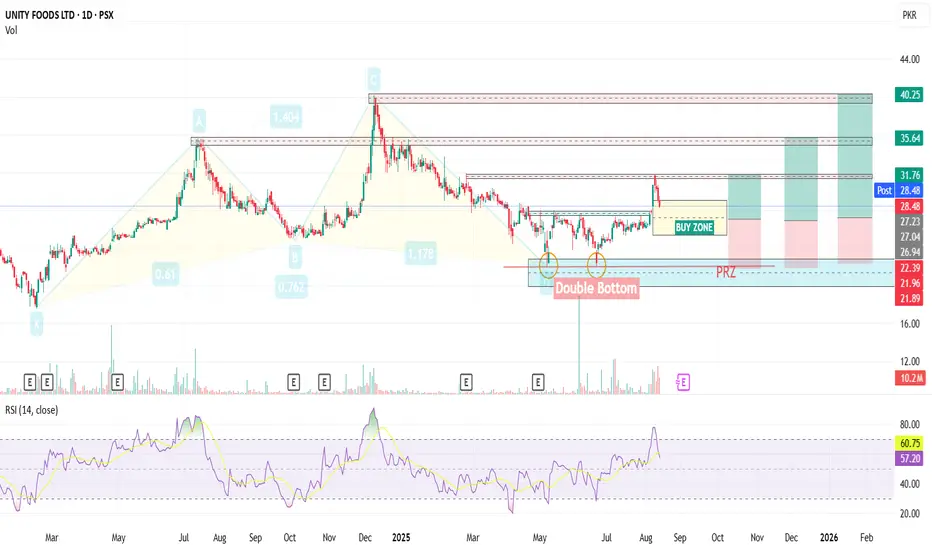
Unity📈 UNITY PSX — Bullish Cypher + Double Bottom + Pullback Buy Zone 💎
🌀 Pattern:
X: 17.60 → A: 35.61 → B: 25.01 → C: 40.14 → D: 22.02
✅ Perfect Bullish Cypher completion at D
📊 Double bottom at D → neckline breakout
📍 Current Setup:
Hit 32.00 🎯 — now retracing to 28.00 🛡 (Fib breakout retest)
This zone is a buy-on-dip 28.50 to 25
🎯 Targets:
TP1: 32 🔁 (recent high)
TP2: 35 🚀 (A-point retest)
TP3: 39--40🌙 (C-point retest — extended move)
🛑 Stop-loss: Below Double Bottom
💼 Fundamentals — Power Boost:
1️⃣ Net Profit Rs 1.09 bn vs. Rs 1.21 bn loss last year 📈
2️⃣ EPS +0.92 vs. –1.01 previously 💰
3️⃣ Gross Profit +10.5% to Rs 7.41 bn (cost of sales down 12.6%) 🏭
4️⃣ Operating Profit +36% to Rs 6.80 bn; Other Income +202% to Rs 2.13 bn 💵
5️⃣ Dividend 75% cash declared 🏦
⚡ Summary:
Technicals + Fundamentals = High-confidence setup 📊
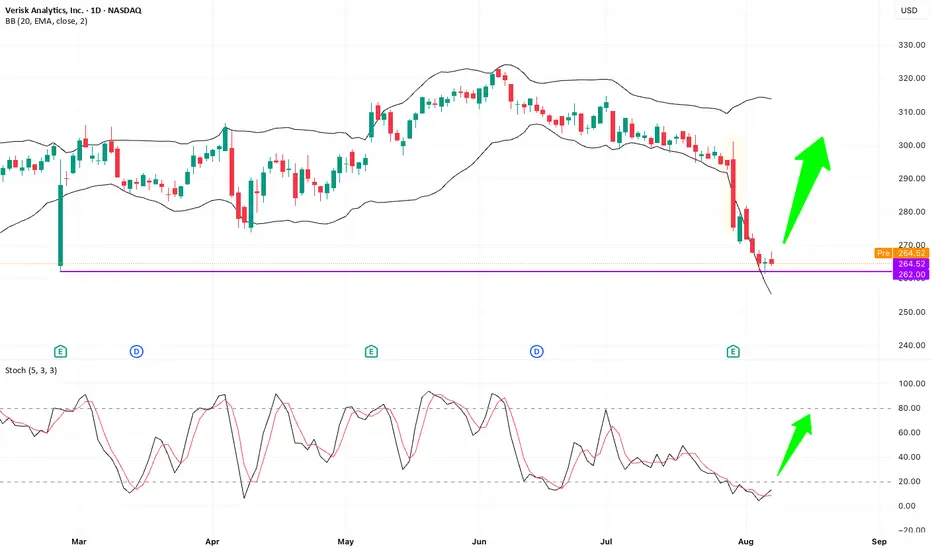
VRSK – Bullish Pin Bar at Key Support after Earnings Flush?NASDAQ: VRSK delivered good quarterly results, yet price action showed a sharp flush-down bar breaking below the lower Bollinger Band. Recently, price retested the key previous low level at $262, triggered some small stop-losses, and closed back at $262 with a bullish small pin bar. Double bottom setup on VRSK.
Key factors supporting this level:
1. Flush-down move likely to stop out weak holders.
2. Break below lower Bollinger Band, indicating short-term oversold condition.
3. Stochastic oversold and attempting a bullish cross.
4. Bullish pin bar closing back above support.
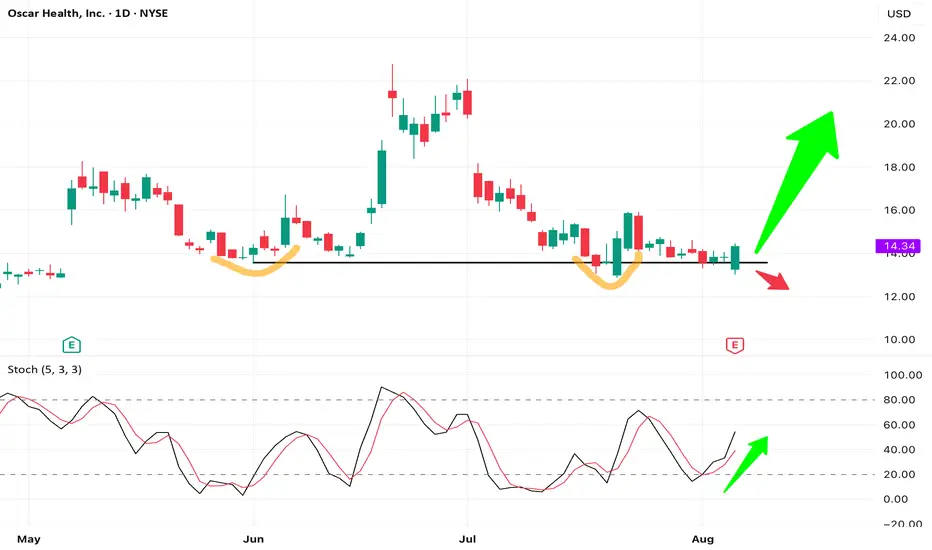
OSCR forming a Double Bottom – Bullish Reversal PotentialNYSE: OSCR - Oscar Health shows a potential double bottom, with a force bottom likely clearing stop-losses. Price has reclaimed key support, and stochastic is turning up, suggesting early bullish momentum.
Despite earnings missing estimates, the stock closed strong above support — a positive reaction to bad news. Risk and reward looks favorable at current levels.
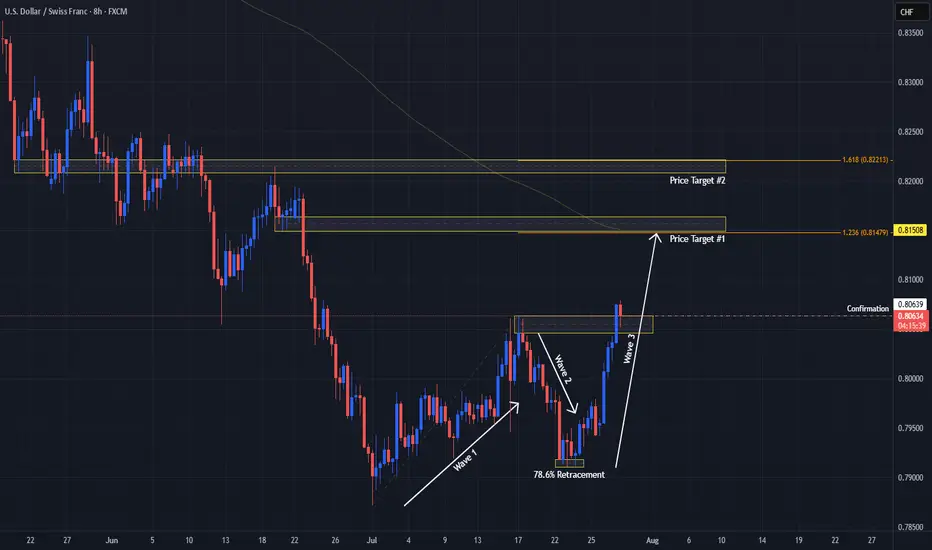
USDCHF Signals Wave 3 With Double Bottom!OANDA:USDCHF has not only formed a Double Bottom Pattern but also may be generating a potential Elliot Impulse Wave!
Bulls are giving the April & June Lows of .8038 - .8088, another go for a second time today after surpassing the first attempted High created July 17th to break above the level.
So far Price today has broken above July 17th Highs and if Bulls are able to hold this level, this would Confirm:
1) A Breakout of the Double Bottom
2) Wave 3 continuing the Impulse Wave in the Elliot Wave Theory!
The Higher Low @ .79106 created on July 25th, broke the downtrend structure as a 78.6% retracement of the Lower Low @ .78719 created July 1st which was a new 14 Year Low, finishing Wave 2 and initiating Wave 3 of the Impulse Wave.
The Extension of Wave 3 typically will end at the 1.236% or 1.618% level which gives us 2 potential Price Targets to start:
Price Target 1) .81479 - 1.236%
Price Target 2) .82213 - 1.618%
Once Wave 3 has ended, we will look for opportunities at the Wave 4 - Wave 5 juncture!
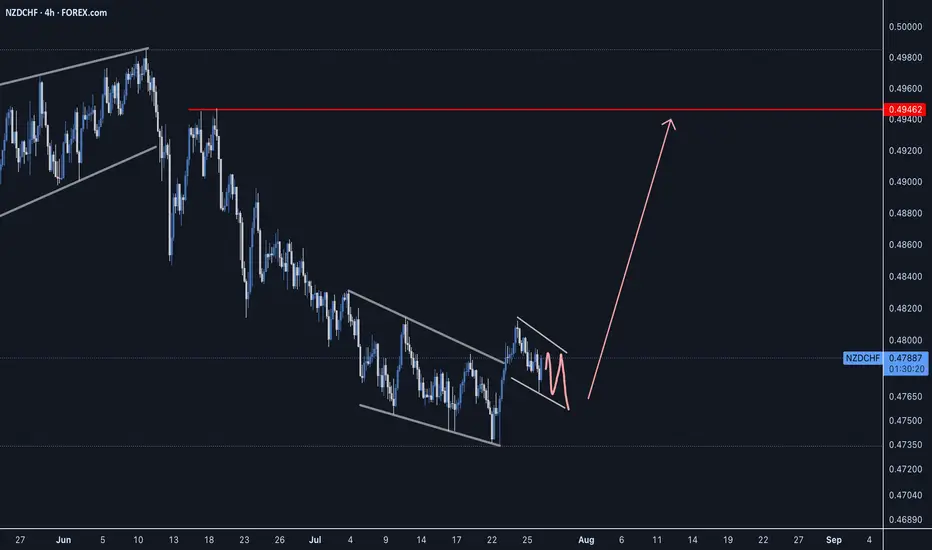
NZDCHF - Can we make it back to previous highs?NZDCHF has been shaping up for the next price movement as bulls strongly rejected any further downside and created a strong reversal impulse which should gain some momentum.
Good Luck
GBPCHF - Classic 'W' PatternGBPCHF has been setting up for the next impulse phase as we can see common 'W' price action pattern which has made the last swing low in this reversal structure to see buyers step in and push price upward.
Always wait for confirmation, Good Luck

The Kiss of Death Trade & Other Reasons for EntryFollowing up on the 2618 opportunity that we looked at on the FOREXCOM:GER40 this past weekend the market has now created more potential trading opportunities to get involved.
1) A bullish bat pattern that has completed due to a result of a complex pullback into the original double bottom.
2) A potential Kiss of Death trading opportunity
3) A bigger potential bullish gartley pattern IF the current 2618 opportunity is violated.
Please leave any questions or comments below & feel free to share your opinion on the setup.
Akil

$UNI - $10 from here?Hi guys! 👋🏻
🔔I'll be trying this setup for Uniswap
🔔 We have bounced from the strong support at $4.80, which we retested in April 25 and May 7 forming a pattern impersonating a double bottom
🔔 With the current chart pattern and levels, I'll be expecting a jump with a target on $10.
🔔 Might drop to $5.70 before another move upwards.
✊🏻 Good luck with your trades! ✊🏻
If you like the idea hit the 👍🏻 button, follow me for more ideas.

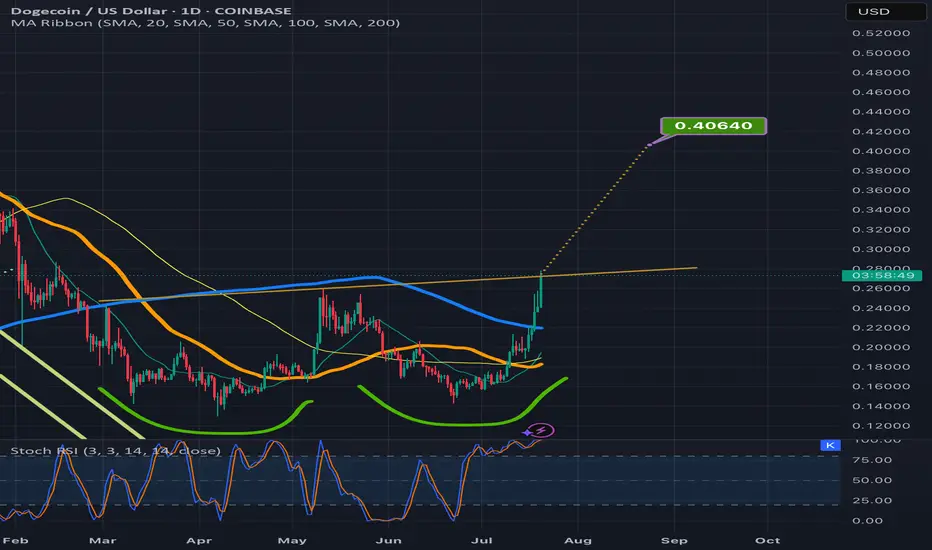
Doge inching above the double bottom necklineIt could easily dip back below the neckline a tie or two before it validates the breakout but definitely getting closer to doing so. Target is around 40-41cents. *not financial advice*
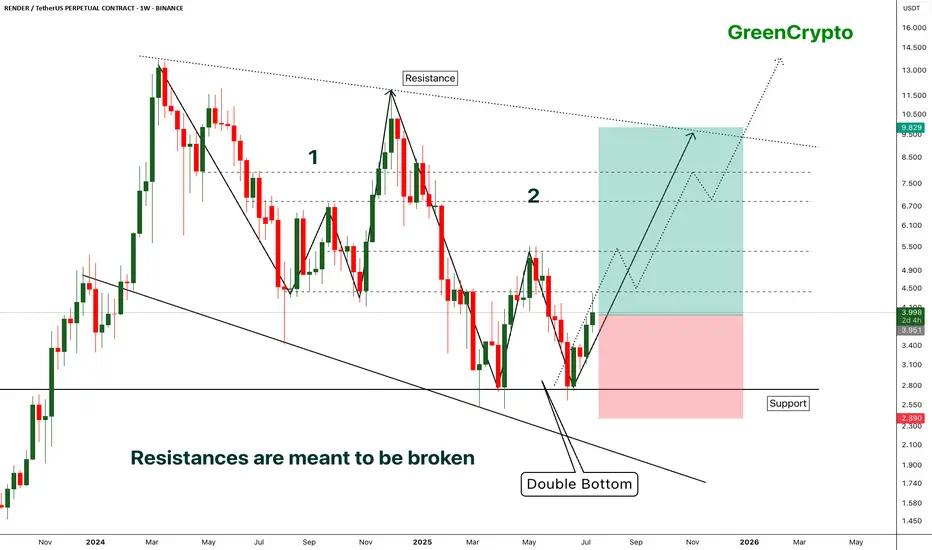
RENDER - [Double bottom] - Resistances are meant to be broken- RENDER has successfully bounced back from the support by forming the double bottom pattern.
- Double bottom pattern is bullish pattern, when it forms at the strong support it becomes extremely bullish. this is one of such scenario.
- Im expecting some minor resistance at the local resistance around 4.3
- A successfull breakout this local resistance will push the price further high.
Entry Price: 3.941
Stop Loss: 2.378
TP1: 4.413
TP2: 5.350
TP3: 6.887
TP4: 8.092
TP5: 9.810
Max Leverage 5x.
Don't forget to keep stoploss.
Support us by Liking and following.
Thanks and Cheers!
GreenCrypto
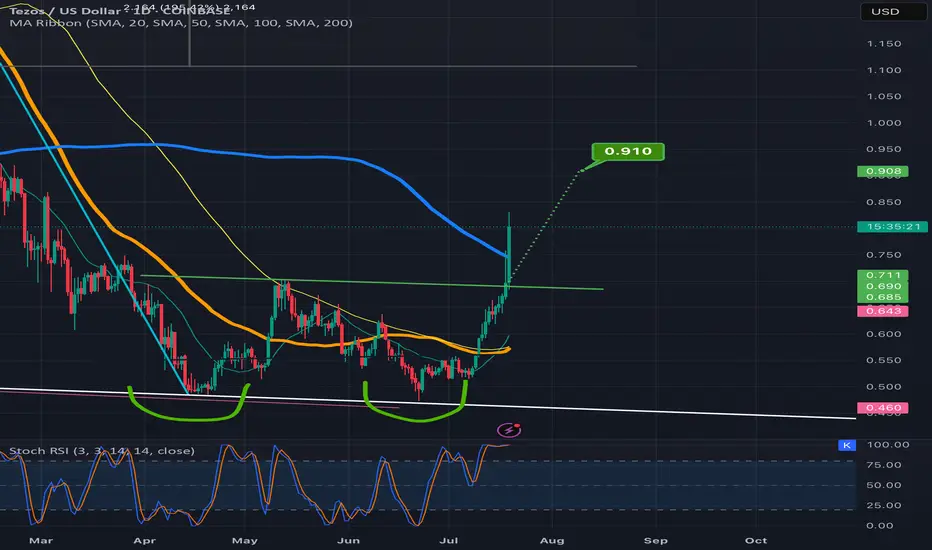
Tezos heading for a double bottom breakout targetPrice action is well above the neckline and already over halfway to the target. *not financial advice*
NZD/USD Technical Analysis | Smart Money Perspective🧠 NZD/USD Technical Analysis | Smart Money Perspective
On the current NZD/USD chart, price is trading around 0.5960, positioned between a clearly defined resistance zone (0.6130–0.6150) and a support zone (0.5890–0.5900).
We can observe the following key technical elements:
🔹 1. Liquidity Sweep
Price recently broke below the previous swing low near 0.5900, tapping into a pool of sell-side liquidity. This movement is commonly interpreted as a liquidity grab, where institutions manipulate price to trigger retail stop losses before reversing.
🔹 2. Double Bottom Formation
The chart indicates a potential double bottom forming at the support level — a classic accumulation signal. This pattern suggests buyers may be stepping in after liquidity has been taken out, anticipating a reversal.
🔹 3. Fair Value Gap (FVG)
An FVG (imbalance) is visible in the range of 0.5985 to 0.6015. This inefficiency was created by a sharp bearish move, leaving price action unbalanced. Price is now expected to retrace into this area to rebalance orders — a common smart money behavior.
🔹 4. Market Structure Outlook
If the double bottom confirms with a bullish break of structure above 0.5980, we could expect a continuation toward:
First Target: FVG zone around 0.6015
Second Target: Major resistance near 0.6150, where past distribution occurred.
✅ Conclusion
This setup combines key smart money concepts:
Liquidity grab below support
Accumulation phase at demand
FVG as target
Potential bullish market structure shift
Traders should monitor price action around the support zone for confirmation (e.g., bullish engulfing or break of short-term highs) before entering long positions. Targets remain at the FVG and resistance zones, but risk management is essential in case of a deeper sweep or macroeconomic catalyst.

CRWV retest incoming?will we retest 130?
That's my bet. I'm sure that Fri 7/18 will be wild as it is the monthly contract. Staying below 140, I'll hold my runners.
After this bottom, I think we will reverse back upward to 145+

Hbar breaking upwar from fallingwedge/pennantAlso in a smaller double bottom setup here. *not financial advice*
