UK100 DOUBLE TOPHey awesome traders! Hope you’re snagging pips. FTSE just printed a clean Double Top—first peak near 9,790, second swing failed beneath it, and price is hovering under the short EL ~9,739.7. This puts sellers in control if we confirm below the neckline.
Key Levels
Peaks: 9,788–9,790
Short EL: 9,739.7
Mid level: 9,679.8 (0.5)
Neckline / Trendline break: 9,571.2
200-SMA: 9,488.3
Measured move T1: ~9,355.7
Trading Plan
Aggressive short: Fade the second top / EL 9,739–9,745 on bearish rejection (engulfing/pin).
Stop: above 9,795 (beyond tops).
TPs: 9,680 → 9,571 → 9,488 → 9,355.
Conservative short (confirmation): Wait for a 4H close below 9,571, then sell the retest as resistance.
Invalidation: sustained reclaim back above 9,571, or especially above 9,740–9,790.
Double Top

Chart Talk - Nifty it not yet Complete Bullish Hey Guys Welcome to Chart Talk
Today Nifty opened Gap-up and sustained went upside but after that the resistance came so market down over all trend looks down for tomorrow I have explained my View
Thank you

Bitcoin looking bearish in the short termBTC is still in the long-term bullish. But in the short term, it has formed a double top and is currently at an area of interest, the point where it could break the neckline of this double top downwards. It has also begun forming what could be the descending channel that drives this bearish move. If the breakout below the neckline does happen, it'll likely move toward the 90k area, which coincidentally also happens to be where a fair value gap is currently waiting to be filled on a 4H. At this point, it would've broken out of the long-term bullish ascending channel and will likely form a structure that suggests reversal of the short-term bearish move, back into the channel to continue the longer-term bullish trend.
What do you think? Let me know in the comments.

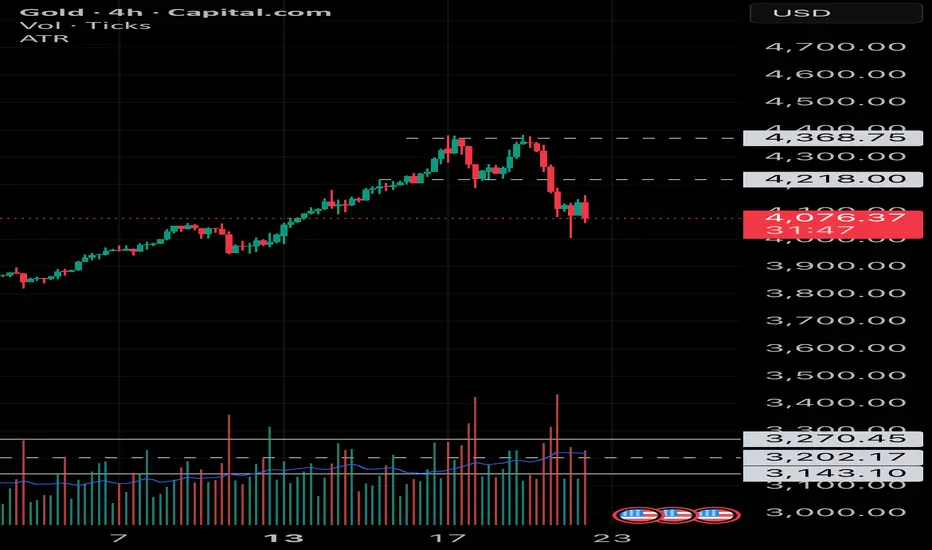
Gold Technical Outlook: Breakout or Breakdown Ahead?Market Context
Gold recently hit fresh all-time highs near $4,400 in mid-October after dovish comments from the Federal Reserve, but has since paused as traders digest the news. The price is consolidating around the $4,000 area, with bulls and bears locked in a tug-of-war, creating a crucial juncture for gold’s short-term trend.
Technical Breakdown
• Trend:
Gold had been climbing steadily along a rising support trendline , but that line has now been broken . This signals that the recent uptrend may be on hold or reversing in the near term.
• Resistances:
The chart shows a classic double-top pattern , with peaks around 4,210–4,225 . After retesting this zone and failing, sellers took control. There’s also a minor resistance zone near 4,040 , which capped a recent bounce.
In short, bulls must reclaim 4,040 first, a breakout above this would open the path toward 4,210–4,225 .
• Support:
Key support lies near 3,914 . This level held strong during earlier pullbacks even after the trendline broke.
If gold retests 3,914 and holds, it could provide a solid base for buyers, but a decisive break below it would confirm downside continuation.
• RSI (Momentum):
The 14-period RSI is hovering near 50 , showing a neutral stance. We can observe both bearish divergence (as price formed a double top while RSI made a lower high) and bullish divergence (as RSI formed higher lows while price dipped).
This mix of signals means momentum is indecisive , traders should wait for confirmation.
What to Watch Next
1. Price Reaction at Key Levels
Watch how price reacts around 4,040 and 3,914 .
A break and hold above 4,040 could shift short-term momentum bullish, targeting 4,210–4,225 .
A rejection or breakdown below 3,914 could trigger further selling pressure.
2. RSI Confirmation
A sustained move of RSI above 50 supports bullish momentum, especially if price also rises.
Conversely, a drop below 45–40 would reinforce bearish sentiment.
If price breaks above the double top and RSI makes a higher high , bearish divergence is invalidated, confirming strength.
But if price breaks below support and RSI follows with new lows , the bullish divergence fails, favoring sellers.
Summary
Gold’s short-term trend depends on how it reacts at these key levels (4,040 and 3,914) .
The market is at a decision point, either breakout or breakdown.
Combining price structure with RSI confirmation can help traders stay aligned with the next impulsive move.
Analysis by @TraderRahulPal | More analysis & educational content on my profile.
Disclaimer: This analysis is for educational purposes only and should not be considered financial advice. Trade responsibly with proper risk management.

Time to book profits in Gold. Textbook Double Top spotted on 4H.After the terrific rally in Gold, it finally showed first sign of reversal with the double top formation on 4H chart. That is actually 70% of the times a good enough indicator/sign/pattern for a reversal/pause/correction. Thus to book the profits, imo this is the right to take atleast part profits off the table in the range of 4100-4200.
Around 3800-3700 would be a good buying zone.
AUDCAD: Wait for the Close – 0.9130 vs 0.9057AUDCAD is sitting at a make-or-break spot. It’s been climbing in a 4H channel but just topped out and pulled back to support. I won’t guess mid-range—I'll trade the break:
Bull: H4 candle closes above 0.9130 → room toward 0.9165/0.9180, then 0.9230–0.9250.
Bear: H4 candle closes below 0.9057 → opens 0.9000, then 0.8950–0.8920.
I prefer a close and quick retest/hold for confirmation. Watch AUD/CAD news and oil (for CAD).

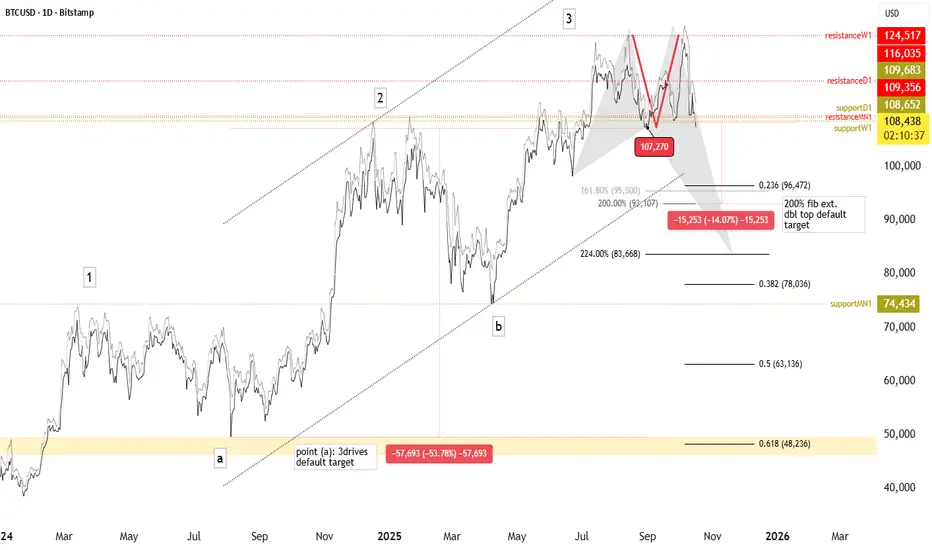
Bitcoin: A 3 Drives Pattern Signals a Potential Market ReversalBITSTAMP:BTCUSD
Bitcoin’s continues to capture the attention as it unfolds into a potentially critical technical formation. The chart suggests that a 3 Drives Pattern — a classic reversal structure — is taking shape, suggesting that the current bullish cycle may be approaching exhaustion. If this pattern completes, the projected move could lead Bitcoin down toward the $50,000 region, implying a 50% price correction from current levels.
This pattern is strengthened by bearish divergences on the Relative Strength Index (RSI), which reveal a gradual weakening of buying momentum even as prices have continued to set new highs. Such divergence often precedes significant retracements, signaling that the underlying strength of the uptrend may be fading.
A clearer confirmation of short-term weakness emerges through a double top formation, with its neckline currently being tested around $107,270 . A confirmed breakdown below this level would favor a correction of roughly 14% , targeting the $93,000 zone.
This move could mark the early stage of a broader bearish sequence consistent with the 3 Drives Pattern, potentially setting the tone for a larger downside continuation.
The convergence of these multiple signals — the 3 Drives Pattern, the double top, and the RSI divergence — collectively reinforces the notion that bullish momentum is fading and that the market may be transitioning into a reversal phase.
Happy Trading,
André
$BTC Double Top - Business Cycle & Global Liquidity Analysis TWIN PEAKS 🎄🌲
How the Business Cycle Supercharges Liquidity (and Crushes Cycles
Many of you may remember my BTC cycle thesis I wrote ~1.5 years ago. It was based solely on technical analysis covering previous cycles and did not take into account macro conditions such as global liquidity and the business cycle.
While that has been a guiding light to get me to this point, after further macro analysis, my views have changed a bit.
Based on my technical analysis, a price target north of $200k remains for CRYPTOCAP:BTC , but I now believe we will see some sort of a DOUBLE TOP like we did in 2021; this time in mid-December 2025 and late-March / early April 2026.
The December 2025 top will fulfill the “4-Year Cycle prophecy” which has been fueled by the current boom in global liquidity.
Whereas the March / April 2026 top will come from a booming business cycle (measured by the ISM PMI); something we have yet to see.
As you can see in the 2017 and 2021 cycles, the business cycle cues Alt Season.
I don’t think we see a real one without it.
That’s where people spend the money they made through safer assets such as Gold > Stonks > ₿itcoin etc.
We saw Altcoins, NFTs, Sports Cards, Sneakers, Watches, Collectibles etc go parabolic during this time in 2021. And it just so happened that the market for a lot of these high-risk assets topped around that time.
Here's a link to a Michael Jordan rookie card in PSA 9 condition that peaked around February 2021 right before the business cycle topped.
www.psacard.com
I think Altcoins went on for a bit longer after the business cycle topped because they were native on-chain and had less friction to transact (crime season anyone?).
NFTs saw sustained speculation because of the novelty and innovation they were bringing to the space. NFTs should act more like traditional risk assets this time around, and top slightly after the business cycle.
THE FURTHER WE ARE IN THE BUSINESS CYCLE, THE FASTER LIQUIDITY REACHES RISK ASSETS.
Think about it… everyone and their mother are making a ton of money from a booming business cycle ie hairdressers, uber drivers, personal trainers etc and dumb money finds high-risk assets near instantly. We see this with an uptick in google searches, youtube views etc.
This is why global liquidity with a 10-12 week lead overshoots cycle tops in the past.
An immense amount of Global QE in 2021 created an outlier for a continued pump in liquidity, even after the business cycle topped.
Then in the bear market, liquidity deviates from risk assets again as money moves back to safe havens first such as GOLD, which is a near 1:1 injection, and we see ₿itcoin lag by 10-12 weeks.
We should continue to see large caps do well for the remainder of the year as money slowly rotates out of BTC into ETH, SOL, BNB etc, but small caps don’t start to outperform until the business cycle starts convincingly rising well above 50.
Alternative investments such as sports cards are starting to see a similar rotation. Michael Jordan is the ₿itcoin of sports cards, and many of his cards are well above 2021 all-time highs. Other high-end cards from GOATs such as Tom Brady, Mickey Mantle, Wayne Gretzky etc continue to shatter prior records.
NFTs are also starting to see a resurgence with high-end collections such as Crypto Punks, X-Copy etc.
I’m not completely sure if the first or second top will be higher for CRYPTOCAP:BTC yet, but I’m leaning towards the first one in December.
The aforementioned riskier assets should get the lion’s share of business cycle capital in March / April.
At this nexus we will see the Treasury General Account refill suck liquidity out of markets due to tax season. TGA refills have marked previous tops in 2017 and 2021, so I see no reason for this time to be different.
Yes, this will be a much shorter business cycle, which is caused by a historic amount of money printing during the pandemic. The outcome left the US economy in a high-inflation / high-interest rate environment.
The business cycle represents Main Street, and it is clear that the aftermath of the pandemic has crushed middle and lower income households.
~FIN~
JK
POST REFERENCES:
-The 4-Year Boom and Bust Cycle is by design
-Synchronized Bear Market Bottoms
-If you want to dive deeper into the current macro landscape, you should definitely read the playbook I wrote ~10 months ago. It’s been playing out near-perfectly.

Gold breaks records and tops out: Where next?Gold achieved a historic breakthrough to $3,759 per ounce, potentially driven by an unusual "barbell strategy" where investors simultaneously bought risk assets while hedging against systemic risks.
On the one hand, continued expectations for two additional rate cuts by year-end supported non-yielding assets. On the other hand, political uncertainty increases as Trump prepares to meet with lawmakers on funding proposals. The probability of a Gov shutdown approaches 70% by October 1st, which would force the FOMC into a 'blind' meeting in October.
Technicals
The short-term setup shows a double top formation at $3,759, suggesting potential consolidation rather than immediate continuation.
Resistance Levels : $3,800 is a critical resistance, both a Fibonacci extension cluster and a psychological level
Support Levels :
Immediate support at $3,740 (breakout confirmation level)
Secondary support at $3,700-$3,730 (previous consolidation zone)
Deeper pullback potential to $3,673 (61.8% Fibonacci retracement)
Wave Structure : Elliott waves suggest completion of a potential Wave 3, with consolidation expected before a possible fifth wave extension toward $3,785-$3,800
Forward Outlook
The setup favours consolidation over the remainder of the week, with key events including Fed Chair Powell's speech and Friday's PCE inflation data serving as potential catalysts for the next directional move.
The momentum divergences suggest limited downside risk from current levels, making any pullback toward $3,700-$3,740 a potential buying opportunity for the anticipated final leg higher toward the $3,800 resistance zone.
Risk management remains crucial given the proximity to potential reversal levels and the unusual nature of gold's correlation with equity strength.
This content is not directed to residents of the EU or UK. Any opinions, news, research, analyses, prices or other information contained on this website is provided as general market commentary and does not constitute investment advice. ThinkMarkets will not accept liability for any loss or damage including, without limitation, to any loss of profit which may arise directly or indirectly from use of or reliance on such information.

Double Top formation on AUDCAD - Risky, okay?Price made a strong rally on AUDCAD, climbing aggressively.
But now, we’re spotting a possible Double Top formation, two peaks at roughly the same level.
At first glance, this looks like a bearish setup.
But here’s the caution: in the context of such a powerful uptrend, a Double Top can be tricky.
Sometimes, it’s just a pause before buyers push even higher.
We can say that the neckline broke rather cleanly, with strong confirmation, but I don't see that much conviction yet from the sellers. Buyers could come back, and the uptrend continues. This is what makes it risky. Above, there’s a strong resistance zone, and that’s exactly where price could be heading next.
So, don’t jump in too early.
Because fading a strong trend is always risky business… or should I say risky biscuit?

BTC Short to 110500BTCShort to 110503
Enter 116596
SL 117952
TP 110503
BTC DoubleTop. Everyone extra bullish on Twitter
SL would have manually in case of wick above the top
Low leverage can enter now
dumping to 110k would push fear and greed index at "Extreme Fear"
Would do weekly double bottom.

XAUUSD Bears Hold the Line at 3650 zone – Next Stop 3570?In yesterday’s analysis, I mentioned that in my view, OANDA:XAUUSD ’s correction is not yet complete and that we could be inside an unfolding ABC-type structure. I also suggested that the 3650 zone should be the main focus for bears.
Indeed, price rallied into that zone, consolidated in a small distribution phase, and then started to roll back down again.
At the time of writing, gold is trading at 3632, after retesting the 3623 recent low, which now acts as short-term support.
Looking forward, my idea remains unchanged: I expect another leg down, with 3570 as the next major target. For now, the 3650–3660 area acts as a strong ceiling, and if we look closely, one could even argue a potential double top is forming—if we discount the 3674 spike that marked the ATH.
On the other hand, a stabilization above 3660 would invalidate this bearish scenario and open the door for a new ATH. 🚀

EURCADDouble Top pattern found with Brarish divergence in EURCAD 1H time frame, which looks like bearish. Expected Entry point, Stop loss and TP mentioned.

$FARTCOIN 50% Correction IncomingSomeone opened the bathroom window and let the air out 🪟
$FARTCOIN appears to have found a local top and closed its 2nd consecutive week below the .236 Fib
If someone doesn't shut the window this week, FARTCOIN could face ~50% correction to its next support.
that stinks 💩

Looking for Zuari's Golden Zone - Fib RetracementZuari's fib retracement on the daily chart on the run up from 200 to 390 shows a clear pullback to 38.2% followed by a failed attempt to break 100% in a seeming double top formation around 390, invalidating immediate bullish momentum.
Daily Macd and RSI look weak with bearish divergences forming against PA, denoted with green brush lines showing both indicators with lower highs against price's equal high.
A retest of the golden zone (61.8% to 78.6%) puts us between roughly 240 and 275, which should offer a high probability zone for accumulation and eventually a bounce.
Look out for confluences of major fib levels with 1d 50ma, 99ma and 200ma. 61.8% also has a horizontal confluence with the Dec 3rd peak, and 78.6% has horizontal confluence with April 24th peak, also potentially infleuntial to support levels.


NEAR USDT Double Top Pattern in PlayNEAR USDT Double Top Pattern in Play
On the daily chart, NEAR/USDT has formed a clear double top pattern. Alongside this, a bearish divergence has also developed, suggesting weakness in upward momentum. At the moment, price is sitting near the key support zone around 2.3.
Support at 2.3 and the Bounce Possibility
If NEAR manages to hold this 2.3 support, a bounce could follow toward the 2.85 resistance area. This zone will act as a critical decision point. A rejection here would likely confirm the double top pattern and bring back selling pressure.
Break of 2.3 Could Lead to 1.8 Retest
On the flip side, if the 2.3 support fails, the double top comes into full effect, and NEAR could slide further down to the 1.8 area, where it has found strong support in the past. Until then, the focus remains on whether the current bounce can push through 2.85 or not.

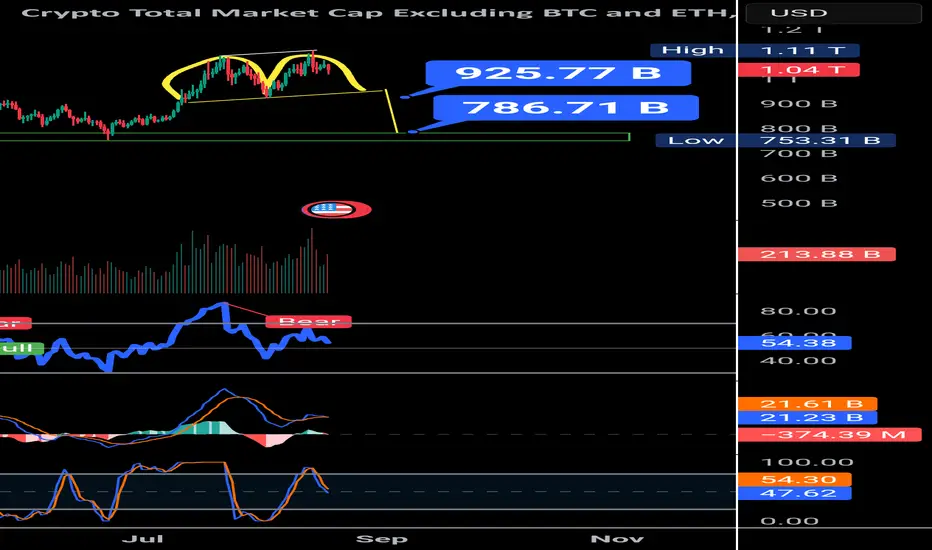
TOTAL3 double top with bearish divergenceThe TOTAL3 (altcoin market cap excluding BTC & ETH) has now climbed back to the $1T zone, almost testing its previous highs. But if we look closer, the chart is flashing a clear bearish divergence alongside a double top (M-pattern) structure.
Here’s the key takeaway:
If the pattern plays out, 950B support becomes the crucial line to watch.
A bounce at 950B could just be a healthy correction from the bearish divergence.
But if 950B breaks, the next strong support sits near 786B.
That zone could open doors for fresh altcoin accumulation opportunities. On the other hand, for those already holding, this level can also be considered a final profit-taking area before a deeper correction sets in.
Overall, the chart suggests the altcoin market is due for correction, especially with Bitcoin dominance on the rise. Patience and risk management are key here.
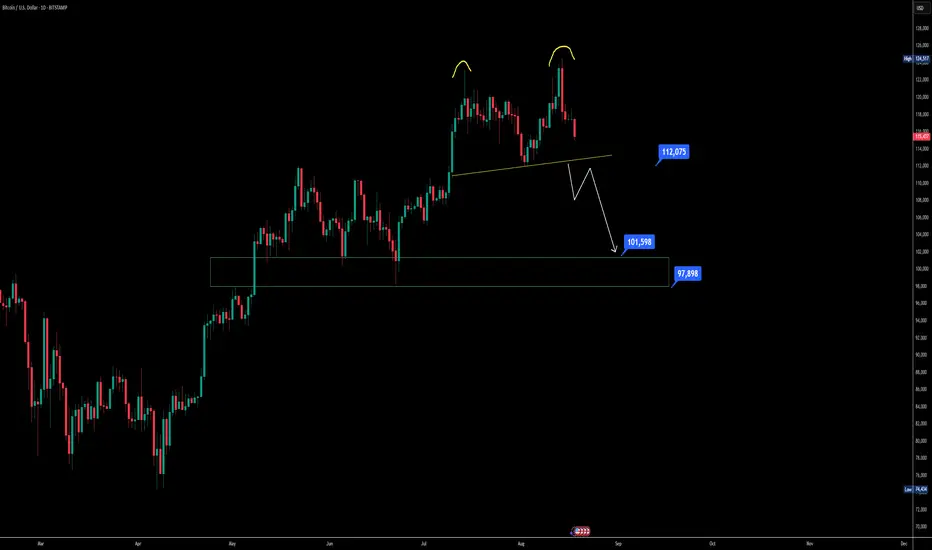
Bitcoin double top hints at deeper correction aheadIf we take a close look at Bitcoin on the daily timeframe, it’s shaping up into a clear double top pattern. Alongside this, there’s a strong bearish divergence that’s hard to ignore. The key level right now is around $112,000—if BTC loses that support, the double top comes into play, and the market could see a sharper correction.
The immediate downside target would be around the $100,000–$101,500 zone, where buyers may attempt to step in. Below that, the stronger support sits near $98,000, and this level could decide whether BTC simply pulls back or actually transitions into a broader bearish cycle. If $98K gives way, we’re not just talking about a correction anymore—we could be looking at the start of a recession-like market cycle.
On the flip side, if BTC manages to hold $112K and bounce, we may see higher levels tested again before any larger trend shift. So right now, the market is in a decision zone where the next few moves are crucial.
Double Top (1h)TOTAL3ESBTC has formed and confirmed a textbook double top, with peaks near 0.347821 and a neckline at 0.336428 . The measured move projects a downside target of approximately 0.3250 , aligning closely with prior horizontal support.
Today’s hotter-than-expected PPI report adds macro pressure to an already bearish technical setup, potentially accelerating the move toward the target.
Key Points :
Pattern : Double top
Top : 0.347821
Neckline : 0.336428
Target : 0.3250 ( measured move )
Invalidation : if price reclaims and holds above 0.336428
Trade Considerations :
Aggressive traders may already be short from the breakdown
Conservative traders could wait for a neckline retest and rejection before entry
Monitor volume behavior to confirm momentum
Disclaimer :
This is not financial advice. Always do your own research before trading.

CADJPY - Downside to continueSellers has taken control with a massive push down, wait for bearish continuation to form to confirm another sell opportunity.
Good Luck

EURAUD - Bearish H*S Retesting Double Tops LevelEURAUD is approaching a strong reversal area which we could see a retest before the next leg down. Wait for bearish confirmation on LTF before entry.
Good Luck

EURCAD - Strong Reversal Impulse off Double TopEURCAD has created bearish price action with a strong reversal impulse pushing down from the double top level. Waiting for a continuation to confirm a sell opportunity with a good R:R.
Good Luck
