EURGBP potential long set-up 4HRStarting to look like a double bottom.
Seeing sign of RSI divergence
Double Top or Bottom

XAUUSD Bears Hold the Line at 3650 zone – Next Stop 3570?In yesterday’s analysis, I mentioned that in my view, OANDA:XAUUSD ’s correction is not yet complete and that we could be inside an unfolding ABC-type structure. I also suggested that the 3650 zone should be the main focus for bears.
Indeed, price rallied into that zone, consolidated in a small distribution phase, and then started to roll back down again.
At the time of writing, gold is trading at 3632, after retesting the 3623 recent low, which now acts as short-term support.
Looking forward, my idea remains unchanged: I expect another leg down, with 3570 as the next major target. For now, the 3650–3660 area acts as a strong ceiling, and if we look closely, one could even argue a potential double top is forming—if we discount the 3674 spike that marked the ATH.
On the other hand, a stabilization above 3660 would invalidate this bearish scenario and open the door for a new ATH. 🚀

BITCOIN (BTCUSD): Strong Bullish Price ActionIt appears that there are two strong bullish confirmations for 📈BITCOIN after testing a significant daily support cluster.
The price has violated a trend line within a falling channel, along with the neckline of a double bottom pattern, as indicated by a single, robust bullish candle.
It is possible that the pair could continue to increase in value, potentially reaching the 113,242 level before encountering the next resistance.

gj shortI have a feeling price is going down from here. Price seems over-extended with large momentum candles going up into equal highs.

9/11: Double Top Pattern, Bearish OutlookGood afternoon, everyone!
Yesterday, the market showed limited volatility, with prices capped around 3343–3358, failing to break through, which delayed the expected downward cycle.
Today, the trend looks clearer:
A double-top pattern has formed;
Price tested the 23 support for the first time and rebounded slightly;
Key resistance levels are 32–37, followed by 41;
If the rebound fails to break resistance, the 23 support is very likely to be broken;
Main supports to watch are 3610 (2H chart) and 3578–3550 (4H chart).
🔹 Trading Strategy
Focus on short positions;
Try quick long trades near support, but avoid being greedy;
If rebounds fail at resistance, shorts may accelerate, so risk is relatively high.

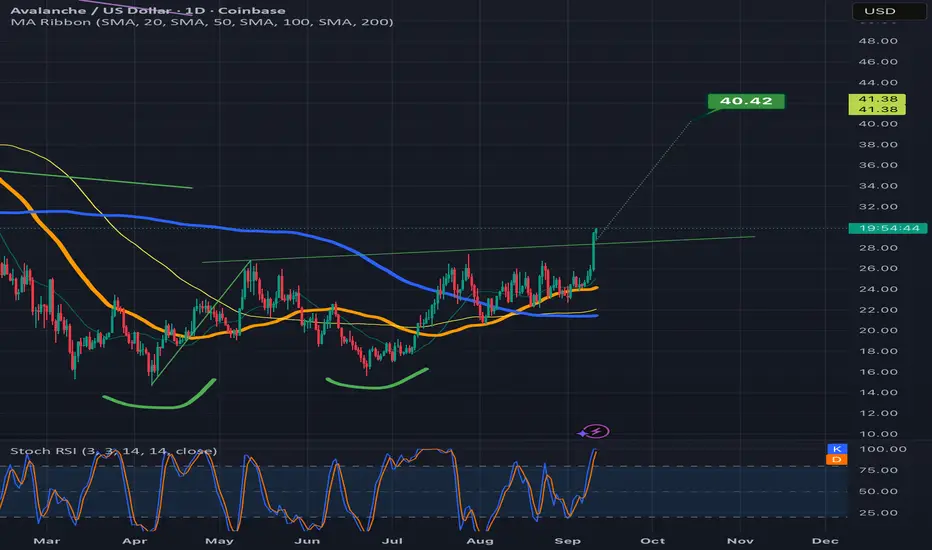
Avalanche with a close above the double bottom necklineNot sure whether it will validate the breakout here or go back below the neckline, but that was a very convincing bullish candle close above the neckline on the previous daily candle so it should give it some reasonable probability. *not financial advice*
DOGEUSDT.P 1WDOGE Update
Key Level: $0.27
Pattern: Double Bottom & Triangle
Bullish Target: $0.50 (on breakout)
Action: Watch for volume on a break above $0.27.
DYOR & NFA

PLTR: Is a New Uptrend Beginning Above 165?PLTR: Is a New Uptrend Beginning Above 165?
PLTR is currently trading above the 165 Resistance level.
We need to observe if it closes above this resistance for a confirmed breakout.
A sustained close above 165 could signal the start of a new uptrend with a target of 185.
The immediate support to watch for any pullback is at 158.
Disclaimer:
The information provided in this chart is for educational and informational purposes only and should not be considered as investment advice. Trading and investing involve substantial risk and are not suitable for every investor. You should carefully consider your financial situation and consult with a financial advisor before making any investment decisions. The creator of this chart does not guarantee any specific outcome or profit and is not responsible for any losses incurred as a result of using this information. Past performance is not indicative of future results. Use this information at your own risk. This chart has been created for my own improvement in Trading and Investment Analysis. Please do your own analysis before any investments.


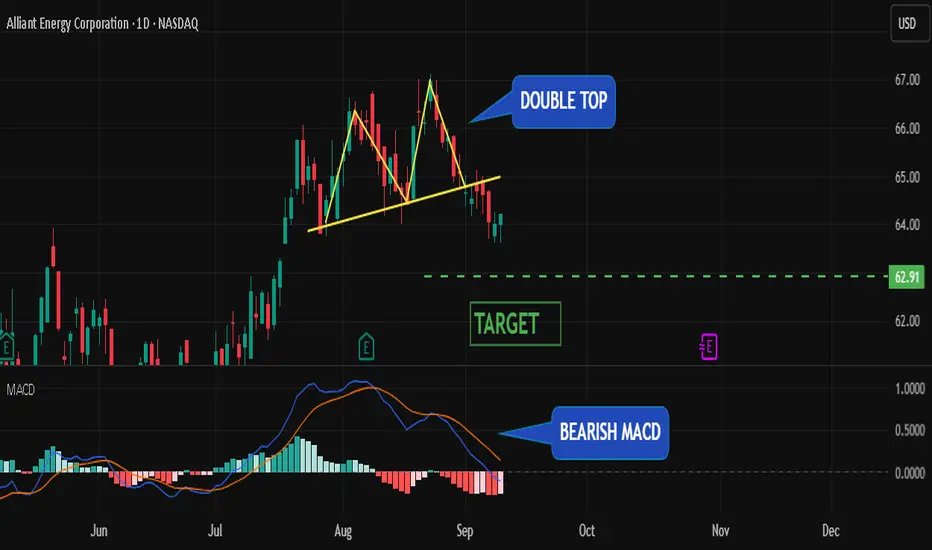
Double-Top Breakdown in Alliant Energy | Short Target ₹62.90Price action in Alliant Energy has developed a clear double-top reversal pattern , with the neckline now broken on strong momentum. This structure signals exhaustion of the prior uptrend and the possibility of a bearish leg unfolding.
Adding further conviction, the MACD indicator has printed a bearish crossover (MACD line crossing below the signal line), showing that momentum has shifted in favor of sellers. This dual confirmation — pattern + momentum — strengthens the short-side outlook.
Trade Plan :
Entry : On breakdown or retest of the neckline zone.
Stop-loss : Just above the recent top / right shoulder (adjust as per risk tolerance).
Target : ₹62.90 (measured move objective).
GOLD (XAUUSD): Bullish Continuation ConfirmedI believe that the price of 📈GOLD is likely to rise.
The formation of a double bottom pattern on a significant hourly support level, along with a bullish breakout of its neckline, indicates substantial buying interest.
It appears that the market will revisit the 3666 level.

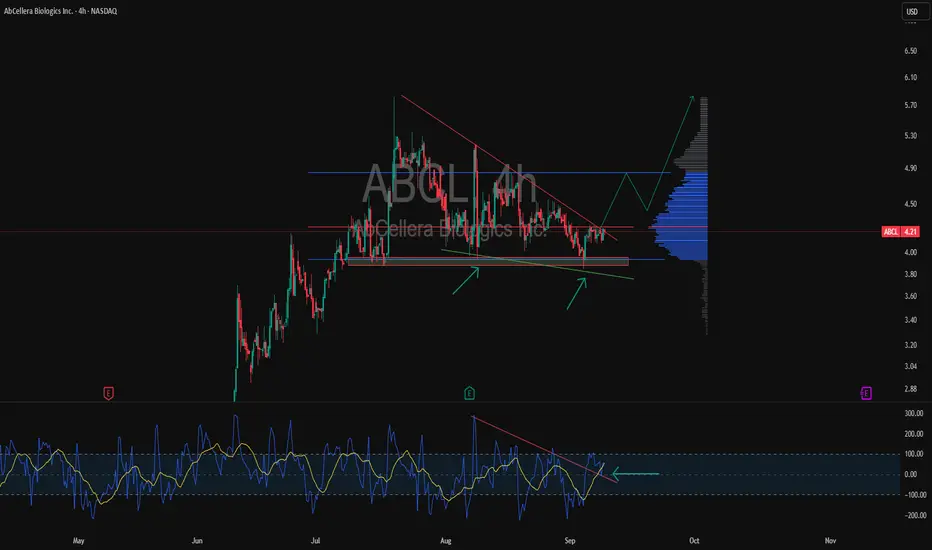
ABCL 4H support test and triangleAbCellera Biologics stock is trading inside a triangle pattern and testing the key support at 3.90–4.00.
Signals are showing that sellers are losing momentum: CCI prints a bullish divergence and the volume profile highlights accumulation above the current level. A breakout above the descending trendline around 4.30 could open the way towards 4.80 and even 5.60.
From a fundamental perspective the company remains an important biotech player focusing on antibody-based drug development. The sector is highly news driven and any announcement on trials or partnerships could trigger sharp moves.
As long as support holds buyers keep the advantage and the market looks like a spring that has been compressed too long and is ready to release.
GBPUSD Observing The Major Resistance AreaAs we can see in this chat, the pair respected the resistance zone and as expected it is heading down 1.3382 as the next partial support.
Possible outline:
hold on short position with 1.3458 as first Tp and 1.3382 as the second take profit.
Like and share your thoughts
Thanks for reading.

EURCADDouble Top pattern found with Brarish divergence in EURCAD 1H time frame, which looks like bearish. Expected Entry point, Stop loss and TP mentioned.

MARI ShortSince July 2023, Mari has never breached and closed below SMA10 on monthly timeframe.
If it breaches it and closes below 588, the downfall will be sharp.
Its first stop would be 519 and then 446 and 415 can also be on cards.
Sorry for Mari lovers but it can become a harsh reality.
However, 415 to 446 can be an ideal time for accumulation for long term investment purpose.
its not a buy / sell call, just my personal opinion.

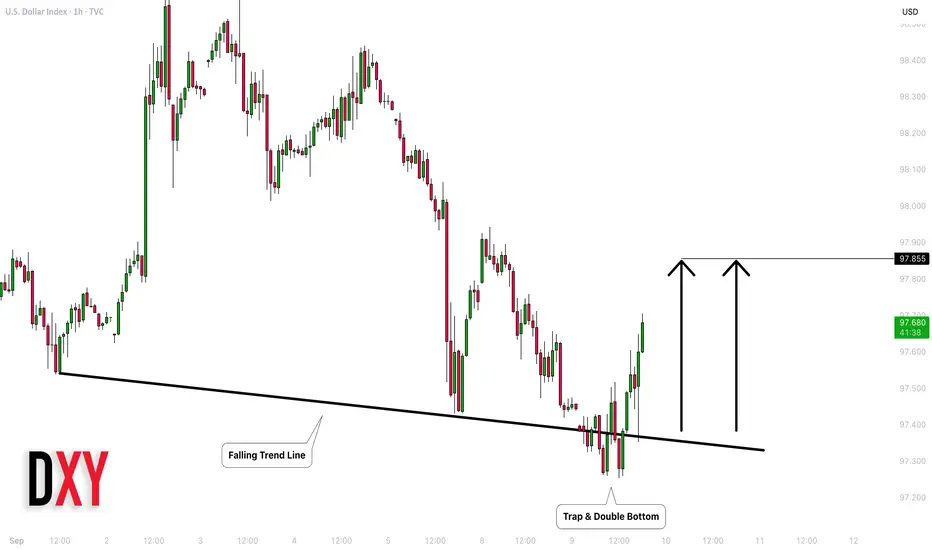
DOLLAR INDEX (DXY): Time to Recover
US Dollar finally shows a strength after a false violation
of a trend line and a formation of a double bottom pattern.
The index will most likely reach 97.85 level soon.
❤️Please, support my work with like, thank you!❤️
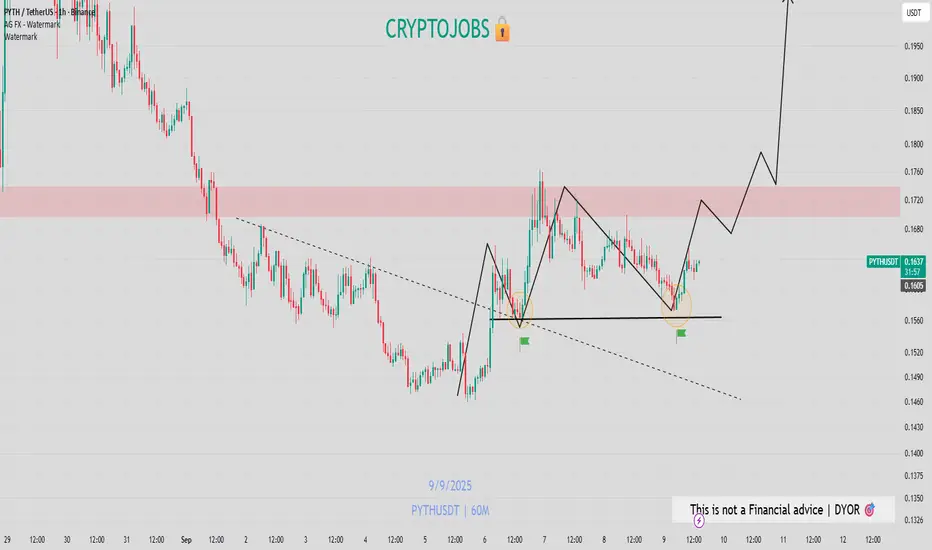
PYTH - bullish setup EURONEXT:PYTH - bullish setup 📈
✅Clean double bottom
✅40%+ retracement happened
✅Monthly support
✅Majors news & adoption on the pipeline
I expect to see another bull rally toward 0.300$+ next!
GOLD– Market Outlook
🔼 Bullish Scenario:
• If the price holds above 3635, the upward momentum is expected to continue.
• Target: 3675 (main resistance level).
• If 3675 breaks, the price may rise further and enter the bullish zone.
🔽 Bearish Scenario:
• If the price stabilizes below the retracement level, a temporary correction may start.
• Target: 3595 (strong support).
• If the price breaks below 3595 and closes under it (especially on the 1h or 4h timeframe):
→ The next bearish target will be 3546.
⚠️ However, if 3595 holds and is not broken, the price will likely bounce and resume the bullish trend.
⸻

HyundaiIt is complicated situation to understand the Hyundai's chart.
by the way
If I am not wrong, it will give me to mark 1:4 RR
Stay on the levels 💪💪

Sell Signal on GBPJPYThe GBPJPY is forming beautiful and obvious Lower Lows. It already formed its first LL which indicating the Bearish Signal below its previous LL below 199.34.
Further the Bearish divergence is confirming the selling point. I am 95% sure for the bearish move towards TP 1 and TP 2.
I have still an eye on Pound Index. If the BXY closes above its resistance at 135.54 then the above Idea may heart yet we have to stick to our Risk to reward ratio.
My risk on two trades is 1% each if TP1 Hit, I will move my SL into Breakeven and let the price move to my TP or revised SL with 0 risk.

CHFJPY: Time to Sell?! 🇨🇭🇯🇵
CHFJPY may continue falling after a confirmed breakout
of a neckline of a double top pattern.
I opened short position on its retest.
Goal - 185.0 psychological level.
❤️Please, support my work with like, thank you!❤️
I am part of Trade Nation's Influencer program and receive a monthly fee for using their TradingView charts in my analysis.

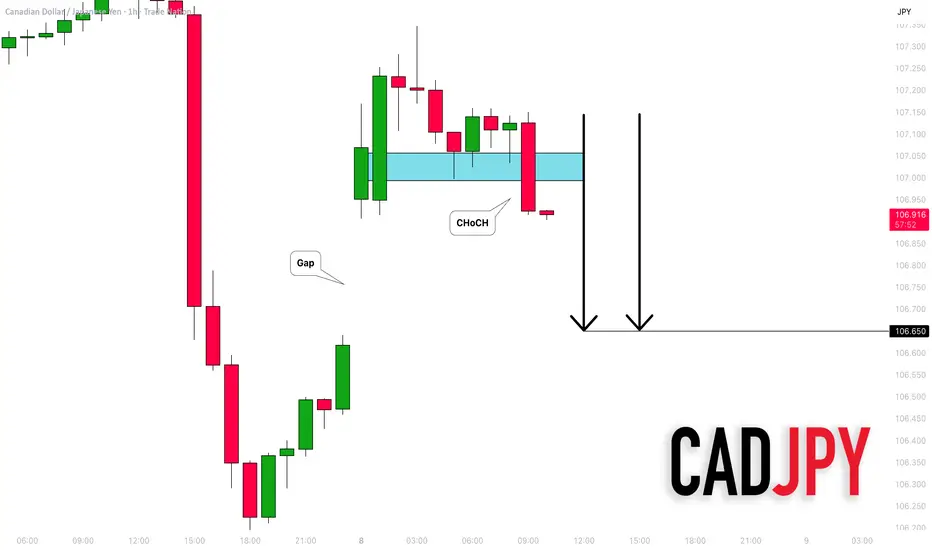
CADJPY: Another Gap 🇨🇦🇯🇵
One more peculiar gap that I see is on CADJPY.
A confirmed bearish Change of Character CHoCH
on an hourly, confirms a local strength of the sellers.
With a high probability, the price will drop to gap
opening level.
Goal - 106.65
❤️Please, support my work with like, thank you!❤️
I am part of Trade Nation's Influencer program and receive a monthly fee for using their TradingView charts in my analysis.
XAGUSD Overextended: Watching 40.50 NecklineIn the past months I argued that Silver should rise and reach 40, and the market not only achieved that but even exceeded the level, printing a high at 41.50.
However, just like Gold, this move looks overextended and vulnerable to correction.
📌 Technically, price has tapped 41.50 twice. While it cannot yet be called a confirmed double top, the possibility exists. The neckline of this potential pattern is at 40.50.
• A break below 40.50 could trigger a deeper correction.
• First target: under 40, toward the 39 technical support zone.
🔑 Trading Plan: I remain cautious at these levels.
If 40.50 gives way, I will look for shorts targeting the 39 area. Counter-trend trades carry very high risk, but the setup is worth monitoring. 🚀
