Double Tops Tutorial based on my last week usdcad tradeHi Everyone,
It's my first tutorial here on tradingview.com based on my last week's trade on usdcad i used the same technique on my last week's trade mentioned in the tutorial..
Good luck & enjoy the tutorial
Double Top or Bottom
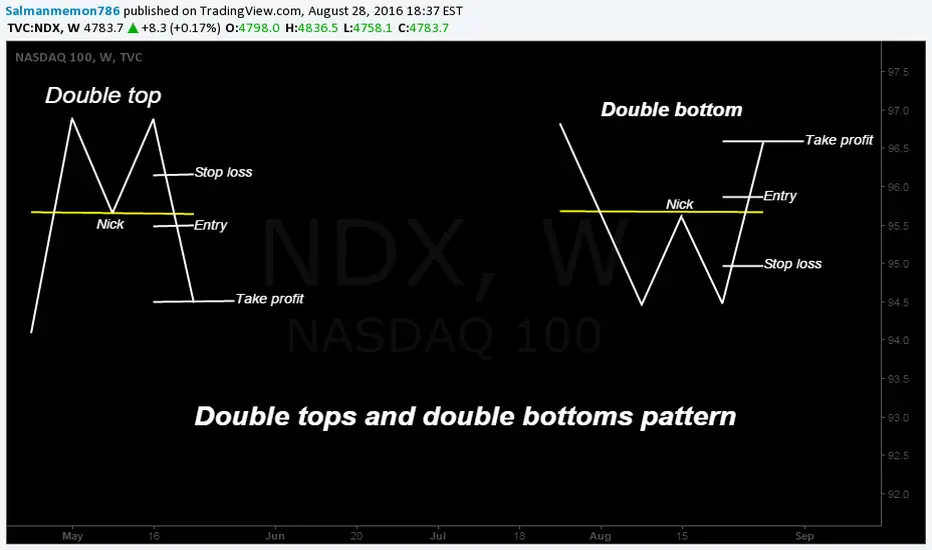
Double tops and double bottoms pattern
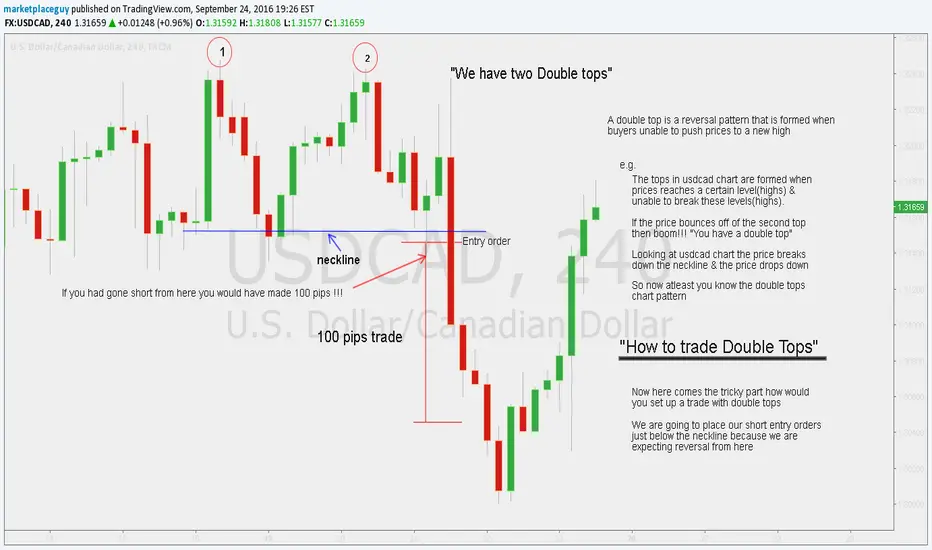
The double tops formation are trend revesal pattern occurring after a strong bullish trend; the market is going to push the market with strong buy orders which will reach a market price that can't be crossed; it will bounce back to test a neckline then, move up again to test the second top! The second top is therefore characterized by the fact that it will test the previous top but won't be able to close or break at previous price ( a little bit below the previous top), giving us a signal of a coming downtrend.
The Double bottom formation is also a reversal Trend, Which occurs after an extended downtrend;
thus, we can observe the formation of a two valley's shapes, pointing bottoms down levels. While they are identified, we need to take some actions
Educational Study: Gartley + 2618 Combo Trade! Educational Study:
This is an example of how you combine
Gartley Pattern and 2618 Trade Together
1 Long the Gartley Entry:
2. Take Profit at TP1 AND TP2
3. Short at 0.618: 0.6790, SL: 0.6903, TP1: 0.6620
TP2: 0.6480
4. Look for RSI Over Bought and Trend
Line Retest.

Reversal Chart Patterns - Part 1Double Top:
The double top is a reversal pattern of an upward trend in a stock's price. The double top marks an uptrend in the process of becoming a downtrend.
Sometimes called an "M" formation because of the pattern it creates on the chart, the double top is one of the most frequently seen and common of the patterns. Because they seem to be so easy to identify, the double top should be approached with caution by the investor.
Head and Shoulders:
The classic Head and Shoulders Top looks like a human head with shoulders on either side of the head. A perfect example of the pattern has three sharp high points, created by three successive rallies in the price of the financial instrument.
Volume is extremely important for this pattern!!
Rising Wedge:
A Continuation Wedge (Bearish) consists of two converging trend lines. The trend lines are slanted upward. Unlike the Triangles where the apex is pointed to the right, the apex of this pattern is slanted upwards at an angle. This is because prices edge steadily higher in a converging pattern i.e. there are higher highs and higher lows. A bearish signal occurs when prices break below the lower trendline.
Over the weeks or months that this pattern forms the trend appears upwards but the long-term range is still downward.

Double Top definition & 2618 trade setup ®What is a Double top, and how to trade it?!
1. We should see a V shape between the two tops;
2. Look left and search for previous structure and eventual PRZ (price reversal zones);
3. The Highest High from the retest candle, MUST meet the previous Highest Close ; (it can go above the HH)
4. The retest candle, MUST CLOSE below the previous Highest Close ; ( CRUCIAL )
5. Once the price breaks the previous structure , it will give us a confirmation of the double top;
6. Price must find some support above previous structure ;
7. Wait the 61.8% retracement ; (It can never happen, indeed, and keep with the free-fall, and that's the risk of not taking this trade aggressively from the real top and wait a confirmation); -I would suggest staying out of the trade if necessary*
8. Sell the 61.8% with one eventual AB=CD basic pattern as target, and eventualy a deep further downward movement (check previous structure for TP targets).
Safe trades ;)
Trading Jazz

USD/JPY - 2618 Trade Explained USD/JPY - H1 - 2618 Trade Explained
Having had a double top and now approaching a retracement back into the 61.8% Fib level, we can now look for reasons to short the USD.
Unlike patterns we can't just place BUY or SELL orders in advanced.
Once we have completed the rules of engagement below, we are looking for confluence within a certain area that all coincide.
This in the long term will give us a better success rate.
Rules Of Engagement 2618
- Double Top
- Break below Neckline / Support
- 0.618% Fibonacci retracement
- Stop loss above double top
- Target 1 at 38.2% Fibonacci
- Target 2 at 61.8% Fibonacci
Good luck.

EURUSD - classic 2618 tradeThey say that consolidation is the best time to trade harmonic patterns and this definitely is not a lie.
If you trade bat patterns, usually you take profit at the 0.382 and the .618 retracement of the AD move.
We have reached that .618 retracement now and it's time to take profits. And immediately we have another setup, the classic 26.18 (or twenty-six eighteen) trade .
What is required for a 26.18 trade :
1. Double top : the A and C points of our bat pattern
2. Break below close below of the neckline : D -point of our bat pattern
3. 0.618 Fibonacci retracement of previous move : where we take profit now
=> all requirements for 26.18 trade are met.
What is expected to happen :
4. price retracement into previous low (Target 1)
5. 1.272 Fibonacci extension of the previous move down (Target 2)
- a potential completion of an AB=CD pattern
Stop Loss : should go minimum above the red dotted line but it is safer to put it above the structure of the double top, which would make Target 1 approximately a 1:1 risk/reward ratio.

EURAUD: Reviewing The Tape (Education not a trade idea)I've already written my "Trading Recap" blog post for today but I wanted to share something with you guys. For you guys that have been following along with my blog you know that I've been working on an article looking at professional athletes and professional traders. One of my main comparisons is the amount of preparation and review that both do.
Just like Peyton Manning or Tom Brady do after every game, after each trading day I review the tape, meaning that I go back through my trading day and critique myself. After all, in this industry we are our own bosses so if we don't do it who will?
Last night I posted a trade looking for a potential breakout to the upside on EURAUD, although we did test the highs of our previous structure level we never got the break that I was looking for and it ended up being a scratch trade (breakeven). This morning in our Warroom meeting Jason Stapleton fired off 2618 idea for this same pair. (I'll attach a link to the FREE 2618 training at the bottom of this post). In the live room we ended up finding a bearish Cypher at the same level and ended up getting short as well. After banking some good pips, I spend the rest of our session going through the rest of my portfolio and basically but this pair on the back burner.
BIG MISTAKE, if only i would have paid more attention to it, i would have seen that IF our 2618 setup were to rally to 2nd targets THEN we'd also have a Bat pattern completion which we plant a stop & reverse at. So yeah I left a few pips on the board today but the important part is that I was able to identify my mistake and turn it into a learning experience. For those who don't take the time to review their day, well that mistake may continue to be a future mistake.
Thanks for taking the time to read this and I'll see you next week at the Technical Trader Workshop!!!
FREE 2618 Training Lesson: www.youtube.com
2015 FREE Technical Trader Workshop: promos.tradeempowered.com

GBPUSD - a textbook example of a 2618 tradeSince some people do not know what a 2618 trade is, and the opportunity is there, I thought I'd make an example for educational purposes.
A 2618 trade is probably the safest way to trade a double top or double bottom and although the Risk/Reward ratio is a little less favorable, my preferred way to enter a double top/bottom trade.
Basically, you wait for the downward trend, away from the double top (the upward for double bottom) to break and close below the neck line of the double top/bottom.
Then, if a retracement occurs, you put a limit order at the .618 retracement of the previous leg of the move, in the direction of the previous move.
You might miss a couple of double top/bottom trades if no retracement occurs, but percentagewise you'll win a lot more of these trades.
Hope this was informative to you, don't forget to hit the like button :)

BTCE - trading opportunities and lessons learnedToday I noticed a very interesting setup in BTCE that I thought it was worth mention. As traders we are constantly hunting for 'setup' that we can rely on. I was taught the above mentioned setup may years ago and it still seems as relevant today as it was then. If a double bottom in price occurs and the distance from the breakout-point to the 50% level is more then twice the distance back down to the lows then it is a setup worth taking. When I talked to someone about 2:1 risk reward setups today in my tutorial session we put this chart together.
