Understanding Equal High LiquidityThe concept around equal high liquidity comes from the understanding that stop losses hold above these points.
In this example, price broke out of bullish structure and began to form bearish market conditions.
This would of course attract sellers, especially at the double top point marked.
The idea is simple, tackle the impulsive sellers before the trend continues.
You can see that price began to lure sellers in from the double top but then came back to take them out before continuing with the true move.
This type of move falls under all concepts of money distribution within liquidity and is definitely worth adding to your strategy.
Double Top or Bottom

Learn How to Trade Double Bottom Formation | Full Guide 📚
Hey traders,
If you are learning price action trading, you definitely must know a double bottom pattern.
Double bottom is a reversal pattern.
It is applied to spot early market reversal clues and catch the initiation of a new bullish trend.
Preconditions for a double bottom:
1️⃣ The market must trade in a bearish trend.
2️⃣ After a formation of the last lower high, the price must set equal low.
3️⃣ The price must return back to the last lower high level.
✅Once these conditions are met the pattern is considered to be completed.
The formation of the pattern is considered to be a ⚠️WARNING sign.
Even though many traders buy the pattern once it is completed,
for me it is not enough.
❗️Remember that the price can easily start to consolidate and form a horizontal channel for example.
The trigger that we will look for is the breakout (candle close above) the last lower high level (based on a wick and its highest candle close) - the neckline.
Being broken to the upside, the market sets a new higher high.
It signifies a violation of a current bearish trend.
⬆️Attempting to catch an initiation of a bullish trend, we will buy the market with a buy limit order on a retest of a broken neckline.
❌Safest stop will lie below the lows of the pattern.
💰Your reward must be at least 1.5 of your risk.
Following these simple rules, you will be impressed by how accurate this pattern is!
❤️Please, support this idea with a like and comment!❤️

Dow Theory, AppliedDow Theory is a foundational set of principles that underlies modern technical analysis. One of the main tenants of the theory involves trend confirmation by comparing similarities between equity indices' price behavior. Originally, the Dow Transportation Index was used to confirm trend direction in the Dow Industrial Index. Now things are a bit more complicated, with multiple indices covering a wide array of sectors and ever-evolving niche technologies.
To get a confluence of direction across the four major American indices (DJI, SPX, IXIC, RUT) to close the week has not been a simple task. I believe this is one of the reasons why a systemic selloff has been delayed in spite of the increasingly opaque economic picture. There are just too many cross-correlates that offset each other on the basis of what each sector "should" do in such-and-such situation. For example, the notion of fleeing to technology as a safety measure may have manifested as a "real" reaction in the middle of 2020, but it was the media's promulgation of such an idea that popularized it into today's common market wisdom. In any case, I would argue that fleeing into tech will work until it doesn't - and that day is looking closer by the hour. Literally.
Just take a look at the four charts displayed above - each of the four indices mentioned sports a bearish hourly candle to close the week. While this is subtle information, I was able to see the price action from a tape reader's point of view, and I will tell you that the price movement during this last hour was categorically different than any I have seen in months. This was real selling; institutional selling en masse. Each of the four underlying ETFs were seemingly stuck in quicksand for an hour and in order to confirm this back=end observation, I turned to the charts after the close.
The results depicted above depict consistent heavy selling across all four indices, in the form of nasty looking candles to close the session. Charles Dow and his then-clever, and now-accepted theory, would point to this as a prime example, were he still trying to convince the world of its validity.
While nothing is certain in markets, this is some pretty compelling data suggesting that, at the very least, there will be some serious volatility for the first time in a long time.
I'm short, but it's not so simple with the other side being a hysterical bubble and all. My suggestion is to get creative and take advantage of the four-way confirm.
-ConfirmPig
TVC:IXIC
CURRENCYCOM:US100
TVC:SPX
CURRENCYCOM:US500
TVC:DJI
CURRENCYCOM:US30
AMEX:IWM
TVC:RUT

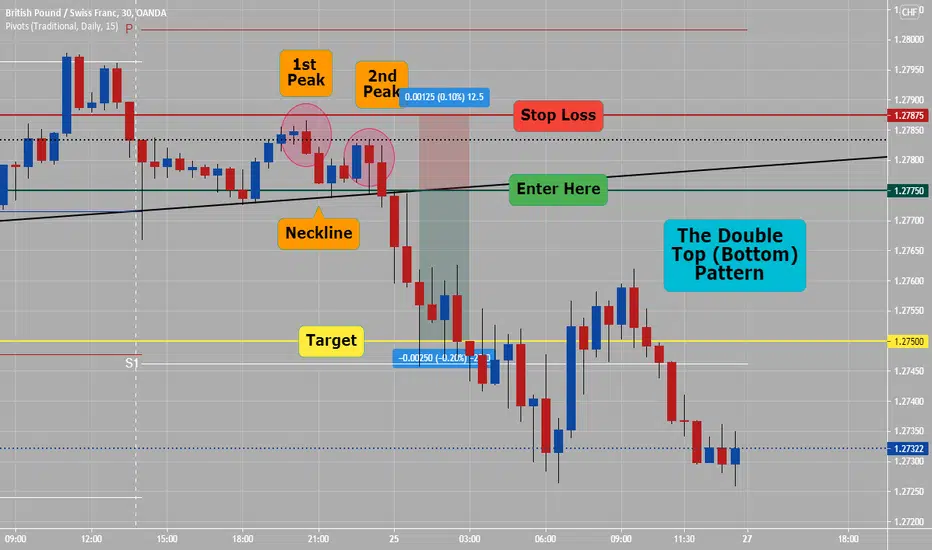
Top 10 Patterns (Double Bottom or Top) # 2Chart example is on 30 minute GbpChf (can be on any time frame) The Double Top Pattern:
The double top pattern is also a type of reversal patterns similar to the head and shoulders pattern. It is also a bearish reversal pattern, but the difference is that this pattern has two high swings that loom around the same price level.
The price level in the double top pattern forms a peak. It retraces itself back to a support group only to create a peak again just before it moves away from the ongoing trend.
In terms of graphical representation, this pattern almost has an M shape, making it relatively easy for traders to spot it on their trading charts.
One thing to take care of while dealing with both the double top and the double bottom pattern is to be entirely sure of their interpretation.
If identified on the right on time and interpreted correctly, both of these patterns can be an invaluable asset to you. However, if misinterpreted, then these or any Forex chart patterns can make irreparable your trades.
Rules:
1) Conservative traders will set up trades on breakout of neckline: on chart easy 25 pips with 12.5 pip stop would have been great at right price, right pair, right session and right time. All four boxes would have been check out. All about risk management and lot size.
Tweezer Tops and why they're reversal indicatorsHey there. Highlighting one of my favorite candlestick patters, Tweezers.
Identifying:
Green bar. Red bar. Approximately same size bodies. Wicks are the same height. Ezpz.
The story:
During an uptrend, everyone is confident prices will continue to rise, so they continue paying more. "Bulls are in control" but really, it's just the average sentiment; prices are going up so everyone wants a piece before it stops. At some point, early entrants take their profits, prices stop rising, and drop a little bit. Some people get nervous and overall confidence drops a little. It retests the price level again, but more people sell so it fails again, and this repeat price-level failure lowers confidence even more. If the price falls back to where this whole thing started, "bears are now in control" but really people have just lost their confidence that price will rise; everyone thinks that the double-tested price level is the max, whereas before they though it would go to the moon. Positive momentum has shifted to negative momentum.
Different time frames
The fun thing is that this story is the same as that of a double-top reversal pattern, because that's what tweezers are: zoomed-out double tops.
Depending on the first bar's open and the second bar's close, it could also be an ascending triangle. So, you don't know if it's going up or down, but you know buyers are more nervous than before the pattern started.
If you were to zoom out from the double top, and then zoom out again from the tweezer top, the whole thing would look like a gravestone doji.
It would have the same open and close with a long upper wick (not the best example picture since this also has a long bottom tail, but hopefully you get the idea). But not every gravestone doji is a double tests, so tweezers tell the story of the markets a little bit better. At the end of the day though, they all say that prices ran up hard, got rejected, and fell back down hard. Not enough for a buy or sell signal, but if you identify a tweezer top, you now know important price levels and can make slightly better decisions about what will happen in the future if it rises above or falls under them.
Good luck!


📚Reversal Patterns - How To Identify & Trade Them 📚
Though, there is a wide variety of reversal price action patterns.
Here is the list of the classic ones that you must know if you trade technical analysis.
The head and shoulders pattern is believed to be one of the most reliable trend reversal patterns. It is one of several top patterns that signal, with varying degrees of accuracy, that an upward/downward trend is nearing its end.
The Head and Shoulders pattern has a distinctive appearance which includes a distinct ‘left shoulder’, ‘head’, ‘right shoulder’ and ‘neckline’ formation.
A double top/bottom is an extremely bearish/bullish price action reversal pattern that forms after a price reaches a high/low two consecutive times with a moderate fluctuation between the two highs/lows. It is confirmed once the price falls below/above a neckline level.
Ascending/descending triangle is a classic reversal pattern. It signifies the exhaustion of the market. The price sets a sequence of higher lows / lower high and respects the same highs/lows signifying a highly probable forthcoming trend reverse.
The reversal trigger is a breakout of a horizontal neckline.
Do you find these patterns reliable?
❤️ Please, support this idea with a like and comment! ❤️
⬇️ Subscribe to my social networks! ⬇️

MOST COMMON FOREX PATTERNSHello Traders and welcome to our channel. If you like this educational content please support it with a like so we can keep posting more content like this. Market Analize Team wish you a successful trading week

Which timeframe is best? Do Sniper entries exist? Time vs priceIn this video, I discuss the different trading perspectives based on different timeframes.
We also take a look at which timeframe will give you the best entry depending on how you define your entry.
Do you define entry by price or time in trade?
Let me know if you agree in the comment section.
Do not forget to give this a thumbs up.

How to Identify & Trade Double Tops and Double Bottoms in 2021Hello Traders,
Here is some of my Favorite and Most simple Educational Chart Patterns that you should know in 2021.
In this Lesson I will Show you how to Identify & Trade These Patterns!
These patterns are seen daily in Stocks, Forex and different markets across the Globe.
I hope you will find this information educational & informative .
Your support is appreciated with a like & Comment
Lets dive Right Into it!!
What Is Double Top and Bottom?
Double top and bottom patterns are chart patterns that occur when the underlying market moves in a similar pattern to the letter "W" (double bottom) or "M" (double top).
Double top and bottom analysis is used in technical analysis to explain movements in the Market, and can be used as part of a trading strategy to exploit recurring patterns.
KEY TAKEAWAYS
A double top has an 'M' shape and indicates a bearish reversal in trend.
A double bottom has a 'W' shape and is a signal for a bullish price movement .
Understanding Double Tops and Bottoms
Double top and bottom patterns typically evolve over a longer period of time, and do not always present an ideal visual of a pattern because the shifts in prices don't necessarily resemble a clear "M" or "W".
When reviewing the chart pattern, it is important for traders to note that the peaks and troughs do not have to reach the same points in order for the "M" or "W" pattern to appear.
Double top and bottom patterns are formed from consecutive rounding tops and bottoms. These patterns are often used in conjunction with other indicators since rounding patterns in general can easily lead to fakeouts or mistaking reversal trends.
Double Top Pattern (M Formation)
A double top pattern is formed from two consecutive rounding tops. Rounding tops can often be an indicator for a bearish reversal as they often occur after an extended bullish rally. Double tops will have similar inferences. If a double top occurs, the second rounded top will usually be slightly below the first rounded tops peak indicating resistance and exhaustion. Double tops can be rare occurrences with their formation often indicating that investors are seeking to obtain final profits from a bullish trend. Double tops often lead to a bearish reversal in which traders can profit from selling at the neckline (with confirmation) to form a downtrend.
Double Bottom Pattern
Double bottom patterns are essentially the opposite of double top patterns. Results from this pattern have the opposite inferences. A double bottom is formed following a single rounding bottom pattern which can also be the first sign of a potential reversal. Rounding bottom patterns will typically occur at the end of an extended bearish trend. The double bottom formation constructed from two consecutive rounding bottoms can also infer that traders are following the Market to capitalize on its last push lower toward a support level. A double bottom will typically indicate a bullish reversal which provides an opportunity for Traders to obtain profits from a bullish rally. After a double bottom, common trading strategies include long positions that will profit from a rising Market price.
Limitations of Double Tops and Bottoms
Double top and bottom formations are highly effective when identified correctly. However, they can be extremely detrimental when they are interpreted incorrectly. Therefore, one must be extremely careful and patient before jumping to conclusions.
For example, there is a significant difference between a double top and one that has failed. A real double top is an extremely bearish technical pattern which can lead to an extremely sharp decline in the market. However, it is essential to be patient and identify the critical support level to confirm a double top's identity. Basing a double top solely on the formation of two consecutive peaks could lead to a false reading and cause an early exit from a position.
How to Trade these Patterns Correctly using the information i have given above
1. Identify The Double Top or Double Bottom
2. Wait for the market to break the previous support or previous resistance to confirm this pattern " M or W" ( as show in my chart above)
3. Be Patient & wait for the market to come back to the "Neckline" (Previous support or Previous Resistance) (as shown in the chart above)
4. When the market will reach the "Neckline area aka support/resistance" monitor the "PRICE ACTION" (in the notes on chart)
5. Monitor the PRICE ACTION for a "Change" in the Market Environment "example" ----- (HL/HH,LH/LL).
6. It is Important to monitor the "Price Action" in the neckline area for some confirmation ( Break of structure or Candlestick confirmation)
7. Always wait for proper confirmation ( at least 2-3 different types of confirmation before Entry)
8. Always Use risk Management & Practise Safe trading.
9. Patience is always the Key to Success!
10. Enjoy The profit when you finally get to ride these Patterns :)
Thanks for Reading this article, I hope that it was informative and educational As always, If you have any questions / Comment or Concern Please feel free to leave them below.
Hope to see you in the next Educational Post!
Global Fx Education

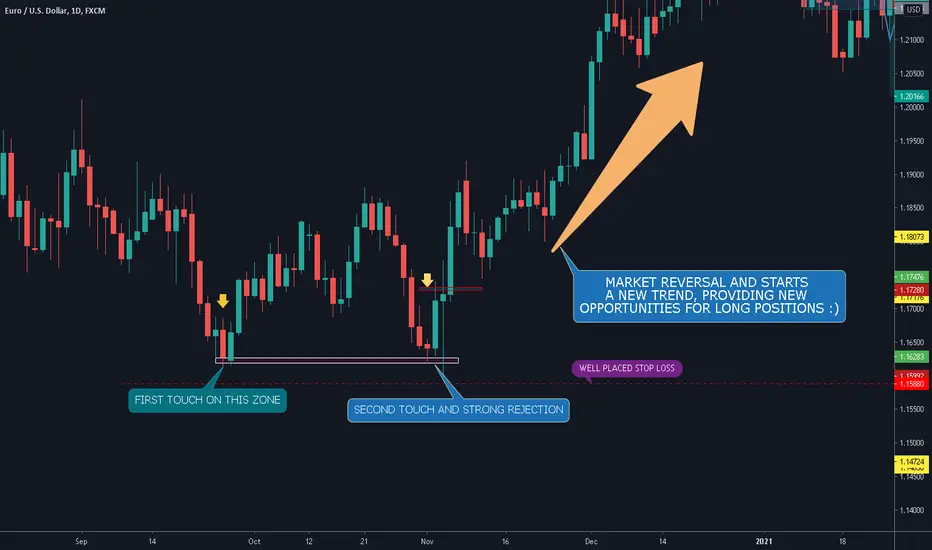
How to Spot the Best DOUBLE BOTTOM!! Click and See how Easy IS!!It is a price pattern characterized by two upper touches in one zone.
The market falls from finding support in a zone followed by a bullish rally
and then again on the market it falls again to find support in the same
zone. After this second touch of the zone, the market starts a strong and constant rise.
----- BUT HOW DO I ENTRY ON THE TRADE?!!?---
1) The BUY STOP is
placed a few pips above the first bullish candlestick after the second touch.
2) The STOP LOSS is placed a few pips below the first touch.
3) The market falls unexpectedly and touches the zone again,
but the stop loss is not triggered and the market back up AND MONEY MONEY.
Trend changing patterns to look out for...Here is some useful trend changing patterns to look out for, for me these are the easiest two to spot in the markets when starting out.
I hope this information has been useful for some people coming across it.
If you liked my educational post please hit the like button and give me a follow, this gives me the motivation to create more educational posts in the future.

Double Top Variations- Flexibility Is ImportantHi Traders. Today's topic is about one of my favourite reversal setups of all time. If you are constantly searching for the perfect double top pattern or you are looking to add a reversal strategy into your trading plan, this post is dedicated for you. Let's get into the story behind a double top pattern. Imagine yourself trying to get through a concrete wall by banging it with a hammer, banged once, you took a bit of break. Banged twice still failed, you are frustrated and eventually give up because it consumes too much energy or you're planning to come back another day, giving yourself enough time to recharge so you could return with more energy and power. Eg. In an uptrend, buyers attempt to breach a key resistance level but there are too much selling pressure against them OR buyers are simply taking their profit off. Price then pulled back and have the second attempt, still do not find enough bullish momentum enough to get through the barrier, buyers eventually give up and sellers then step in with increased selling pressure taking control of the market. There are some of the double top variations that I've traded from time to time.
1. Regular (Equal high) - This is the typical textbook double top, where the market creates an equal high double rejection, followed by a strong reversal.
2. Distribution top - This variation is something occurs very often, where most traders find it misleading and get hooked into the opposite direction. The second top looks like a 'buildup', breakout sort of situation. Usually the distribution (consolidation) phase will take some time, It is the gradual exhaustion of buyers attempting to breach the resistance zone but fail multiple times. Eventually It results in some rollover/ rotation, reversing downwards as buyers are slowly quitting and big sellers are accumulating their sell orders in a discrete manner. In this specific variation I'd often use the 18 ema & 50ema to identify the gradual shift in momentum, ideally ema crosses to help me with finding the sweet spot for entries.
3. Probe variation - One of the biggest mistakes majority of new traders make is the false concept of 'stop hunting'. As an advice, support or resistance are zones where the majority expects the market to respect, It is NOT a level or specific price point. If you are constantly putting your SL overly tight, you will get stopped out very often simply because you do not understand the purpose of a SL. SL is nothing but a trigger that invalidates your initial thesis, never treat it as a tool to maximize your position size, allow the market to breathe. The concept of fake out/ probe is straightforward, price attempt to violate certain key levels, but there's an immediate force (disagreement) pushing the price back into the range, this is what creates a wick rejection. There are times where sellers do not find enough liquidity to reverse the market, so they simply identify a level where the majority place their stops, hitting that zones before it goes into the opposite direction.
4. Lower high - This happen because the market do not have enough 'steam' to get back to the previous high, It then eventually rejects the previous minor support turns resistance, followed by a complete reversal.
Avoid looking for the perfect setup, flexibility is important.
Trade safe.
Do follow my profile for daily fx forecast & educational content

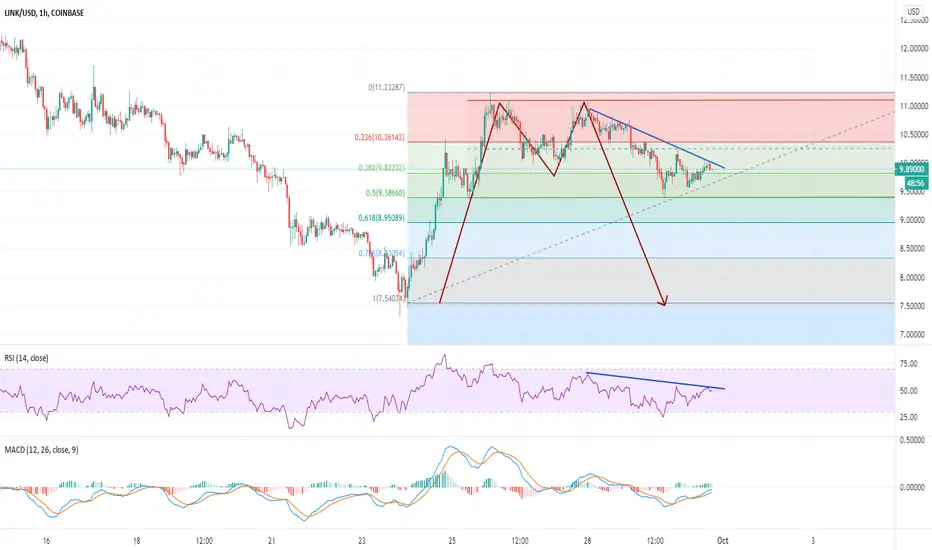
EUR/AUD Buy Trade Education ReviewHere I'd just like to go over a great buy position on EUR/AUD.
We know the pair is in a long term downtrend. This doesn't mean we can't take intraday buys on the pair providing we target sensible levels.
Here we are highlighting how a trendline can be utilised as dynamic resistance. The fibonacci level drawn from our 1hr swing low to high shows that our 0.764 level coincides with our descending trendline and adds confluence to the buy position. Never trade off fibonacci levels alone, but as confluence and to help you manage trades they are absolutely fine.
We can see our sensible target is the previous 1hr swing high.

Understanding Market Structure. Quick tips and tricksIf you learned something from this please give this video a thumbs up and follow me for more content.
Thank you guys. Happy new year

Double Bottom Chart Pattern.The double bottom candlestick pattern is really the exact inverse of the double top pattern. It forms after strong bearish moves and has a ‘W’ type shape to it.
A double bottom signals bearish exhaustion and is formed when the bulls start to take control at a specific support level.
The bears drive prices down into this support level where the bulls step in and drive prices back higher, this bullish rejection of support creates the first ‘V’ shape trough.
The market finds resistance and the bears attempt to drive prices back down. When the market reaches the support level for a second time the bulls step back in again, driving prices higher creating another ‘V’ rejection shape trough.
This final move completes the double bottom candlestick pattern.
The resistance found after the first trough is referenced as the ‘neck line’. When prices push higher through the neckline, the double bottom pattern is completed and triggered.

How to Trade Break of Structure & RetestSo in this video I show you how you could have entered last weeks GBP trades.
Let me know if you have any question and don't forget to like and follow for more content.
Thank you

How to Counter Trend Trade (Divergence)This is a quick tutorial on how to trade against the trend for a possible reversal. I think this might be the best strategy online for counter-trend
Feel free to ask any question and don't forget to like the video and follow me for more set ups and tutorials
Thank you

EDUCATION: Double Bottom PatternHello, dear subscribers!
Today we discuss a very important special case of support line - the Double Bottom chart pattern.
Definition
The double bottom usually occurs when price is in the downtrend and bounced off some level (First bottom). After this bounce it seems that the price is going to fall down, but bounces off this level again (Second bottom). If the price reached the neck line (purple line), the probability of the trend reverse is high.
How to trade with double bottom?
You need to specify that price now is in downtrend. After the double bottom is formed, you can wait the price and neck line crossover and enter a long position with some stoploss to eliminate the possible downtrend continuation. Be careful to sole use this pattern, in case of trend reverse it is also confirmed by technical indicators, which we will examine in next posts.
Summary
1)To wait the full double bottom pattern formed
2)To entry a position on the price and neckline crossover
3)To take a stoploss for the downtrend continuation

Double Top and Double Bottom patterns on BTCUSDT Hello Folks.
In this post, I would like to elaborate more on one of the most integral reversal patterns which occur most frequently: Double Top and Double Bottom.
1- As said before, they are reversal patterns, which means that they change the previous trend! e.g. Uptrend---> downtrend OR Downtrend---> uptrend
Notice that the prerequisite to all reversal patterns is that there must be a trend to be reversed, either up or down, and NOT sideway.
2- Always verify the volume once you have spotted the trend. Without the verification of the volume, it is seemingly a fake pattern: during the pattern, the volume makes a bowl shape.
3- You open the position based on your risk-taking ability:
i- high-risk trade: open the position right after the neckline (the horizontal solid and dashed black lines) are broken on relatively high volumes.
ii- moderate to low-risk trade: after breaking the neckline you wait until the price pulls back to the neckline and then you open your position.

📊 Chart Pattern Basic | Lesson #1Double Top
A double top is a reversal pattern that is formed after there is an extended move up.
The “tops” are peaks which are formed when the price hits a certain level that can’t be broken.
After hitting this level, the price will bounce off it slightly, but then return back to test the level again.
If the price bounces off of that level again, then you have a DOUBLE top!
Double Bottom
The double bottom is also a trend reversal formation, but this time we are looking to go long instead of short.
These formations occur after extended downtrends when two valleys or “bottoms” have been formed.
Triple Top
A Triple Top is a chart pattern that consists of three equal highs followed by a break below support.
The chart pattern is categorized as a bearish reversal pattern.
All three highs should be reasonably equal, well-spaced, and mark clear turning points to establish resistance.
The highs do not all have to exactly the same level but should be “close enough”.
Triple Bottom
A Triple Bottom is a chart pattern that consists of three equal lows followed by a break above resistance.
The chart pattern is categorized as a bullish reversal pattern.
All three highs should be reasonably equal, well-spaced, and mark clear turning points to establish support.
The lows do not all have to exactly the same level but should be “close enough”.
Please like the idea for Support & Subscribe for More ideas like this and share your ideas and charts in Comments Section..!!
Thanks for Your Love & Support..!!