EURUSD BuyPrice took out a low and then immediately came up and broke internal structure which is a sign of a sweep known as Liquidity Grab. Also, This potential inducement happened during Asia session which could be the LIT cycle for the day(major inducement) and continue upward to complete the Daily cycle as well.
Economic Cycles

War is a Racket | DFEN | Long at $28.00The war machine keeps turning. Profits will reign. Direxion Aerospace and Defense 3x AMEX:DFEN never fully recovered from pandemic lows, but world peace is (unfortunately) far from reach. The uptrend in the chart has commenced. Personal entry point at $28.00.
Target #1 = $37.00
Target #2 = $50.00
Target #3 = $64.00

BTC.D (Dominance at Critical Fibonacci Confluence) 2025 Weekly
**Summary:**
Bitcoin Dominance (BTC.D) is testing a major Fibonacci confluence near the 66% level. This zone historically acts as a major pivot and may signal either a continued dominance rally or a potential reversal setting the stage for altseason. We use three layered Fibonacci retracements to outline dominant trend zones, key resistances, and projected targets.
**Chart Context:**
This chart uses **three distinct Fibonacci retracements** to map the historical and projected behavior of BTC dominance:
1. **Primary Fib** (100% to 0%): Captures the macro move from BTC.D \~100% down to its 0% level at \~0%, which aligns with the first altseason (2018–2019).
2. **Secondary Fib** (100% to 38.88%): Maps the first bearish wave to identify potential recovery levels. BTC.D retraced up to the 61.8% (\~73.68%) but failed to break further.
3. **Third or the Current Fib** (73.68% to 38.88%): Maps the latest bearish fall in BTC.D. As of now, BTC.D is hovering at the 78.6% retracement level of this move, indicating heavy resistance.
**Key Technical Observations:**
* **1st TP (Resistance):** 66% — Strong Fibonacci confluence zone:
* Fib2 48.6% ≈ Fib3 78.6%
* Major reversal zone historically
* **2nd TP (Support):** 52.25% — Multi-Fib confluence:
* Fib1 48.6%, Fib2 61.8%, Fib3 38.2%
* **3rd TP (Ultimate Support):** 38.88% — Historical BTC.D bottom, aligned with the first altseason.
* Intermediate Fibonacci confluences between 48%–60% serve as layered support during decline phases.
**Indicators:**
* No external indicators used; pure multi-frame Fibonacci confluence.
* Price action structure and historical patterns highlight potential market rotation zones.
**Fundamental Context:**
The current phase of the market reflects increasing speculative activity in altcoins while Bitcoin consolidates. Historically, high BTC.D correlates with Bitcoin-led rallies, while a sharp drop often triggers altseason.
* Growing inflows into ETH, SOL, and possible now XRP, and mid-cap alts suggest capital rotation.
* If BTC.D faces rejection from 66%, the market could enter a new altseason phase.
* Macro tailwinds (e.g., easing monetary policy, risk-on sentiment) support altcoin performance in the medium term.
**Philosophical or Narrative View:**
BTC.D acts as a barometer of market risk preference. As confidence expands beyond Bitcoin, money flows into altcoins—like tributaries branching off the main river. The rejection from major confluences signals this psychological shift, marking phases of creative decentralization.
**Related Reference Charts:**
* TOTAL3 Fibonacci Setup (Altcoin market excluding BTC & ETH):
* TOTAL2 Correction Probabilities:
**Bias & Strategy Implication:**
* **Primary Bias:** Bearish rejection from 66% followed by correction to 52% and potentially 38.88%.
* **Alternative Scenario:** Brief breach above 66% before reversal.
* Traders may consider rotating into altcoin exposure if BTC.D confirms reversal at the confluence zone.
**Time Horizon:**
* Mid to Long Term (1–6 months outlook)
* Weekly timeframe tracking
**Notes & Disclaimers:**
* This analysis is for educational purposes. Market conditions may evolve rapidly.
* Use proper risk management when acting on dominance signals.

TOTAL3 – Altcoin Market Cap (Excluding BTC & ETH) Weekly TF 2025Summary
TOTAL3 is currently in a macro bullish cycle and undergoing a mid-cycle correction. The chart presents a Fibonacci-based structural roadmap with 3 Take Profit zones, identifying both correction supports and breakout targets. There is a high probability of short-term downside before a significant altcoin rally.
🌈 Chart Context
Fibonacci Retracement (Primary Leg):
100% = 285.3B
0% = 1.16T
Trend-Based Fibonacci Extension
A = 285.3B
B = 775B
C = 464.11B
Price as of analysis: ~845.62B
Key Technical Observations
Support Levels:
61.8% Fib Retracement = 618.5B
Strong Confluence Zone: Fib Retracement 48% + Fib Extension 50–61.8% (highlighted on chart)
38.2% Fib Retracement = 824.38B
Resistance Levels:
951.73B: 23.6% Retracement + 100% Extension – strong resistance zone before $1T psychological level
Take Profit Zones:
1 TP (1.1T) = 127% Fib Extension (Upper leg of parallel extension)
2 TP (1.28T) = 161.8% Fib Extension
3 TP (1.7T) = -61.8% Fib Retracement and 261.8% Extension confluence zone
Pattern & Projection:
The structure suggests a possible correction phase to lower support before continuation.
Bullish continuation expected after corrective phase, shown by the projected dotted path.
Structure: Bullish structure with healthy correction in mid-phase of the macro uptrend.
Fundamental Context
Altcoin Lag: TOTAL3 remains ~40% below its ATH, while BTC and ETH have already hit new highs.
Liquidity Shift Expected: Altcoin capital rotation tends to follow after BTC dominance stabilizes or drops.
Macro Backdrop:
Fed expected to cut rates later in 2025
Stablecoin legislation and ETF narratives building altcoin trust
Institutional inflows are slowly diversifying from BTC to ETH and large-cap alts
These suggest a possible shakeout or deeper correction before altseason breakout gains strength.
Bias & Strategy Implication:
Bias: Bullish Mid-Term – Correction Before Continuation
Expected Scenario: Pullback to strong support zones (824B–733B–618B), followed by a sustained breakout toward 1.1T–1.7T.
Invalidation: Weekly close below 618B may delay bullish structure and extend correction.
Strategy:
Long entries at support zones with tight invalidation
Scaling out near TP1, TP2, TP3 based on market momentum
Philosophical View
Patience is the virtue of the second leg in a macro trend. The correction serves to eject the impatient, reprice risk, and strengthen conviction. When TOTAL3 rises from deep support, it will be not just price but confidence that rallies.
Related Reference Charts
TOTAL Market Cap Structural Breakout:
TOTAL2 Altcoin Chart with Fibonacci Path:
✅ Tags
#TOTAL3 #AltcoinMarket #Fibonacci #Altseason #CryptoCorrection #CryptoMacro #TechnicalAnalysis #BullishOutlook #MidCycleCorrection #Crypto2025
⚠️ Notes & Disclaimers
This analysis is educational and not financial advice. Markets are inherently risky. Do your own research and manage risk accordingly.

US10Y (10-Year Treasury Yield) Weekly TF 2025
📊 Chart Context
Current Yield: \~4.50%
Current Structure: Consolidation below major Fibonacci resistance, with multiple breakout and breakdown paths marked by confluence zones.
📉 Key Technical Observations
Bullish Scenario – Yield Rally (Rate Hike Cycle / Inflation Surprise)
TP1 (5.0%): 0.00% Fib level, psychological resistance.
TP2 (6.10%): 38.2% Fib + -27% extension zone.
TP3 (7.70%–7.91%): Major Fib confluence (-61.8% & 48.60% projection)
Bearish Scenario – Yield Drop (Rate Cuts / Recession)
Support 1 (3.91%): 23.6% Fib retracement, key structural demand.
Support 2 (3.22%): 38.2% retracement
Support 3 (2.74%): 48.6%
Support 4 (2.12%): 61.8%
Support 5 (1.33%): 78.6%
Forecast Scenarios (Based on Arrow Colors & Pathways):
Red Boxes & Zones: Critical Resistance / Reaction Zones
These are strong confluence levels that may trigger pullbacks before continuation.
Green Arrows – Bullish Projection with Pullbacks
Scenario A: Price may rally toward the 5.0% TP1 zone but experience a temporary pullback before continuing toward the 6.10% TP2 zone.
Scenario B: After a short-term correction near 6.10%, if bullish momentum sustains, yield may spike toward the 7.70–7.91% TP3 zone.
These movements reflect a stair-step advance with corrective legs between key levels — bullish macro outlook with intermittent risk events.
Pink Arrows – Bearish Pullbacks & Correction Phases:
Scenario A: Initial rejection from current zone (~4.5%) may send yields down to the 3.91% support confluence.
Scenario B: If support at 3.91% fails, yields may further retrace to 3.22% or 2.74%, activating the lower fib retracement zones.
After stabilizing in these zones, a rebound may begin and realign with the broader bullish structure.
These pink arrows suggest that even in bullish macro cycles, the market may correct deeply before resuming its ascent.
Macro & Fundamental Context:
1.Fed Pivot Dynamics: With inflation cooling and unemployment ticking higher, markets price in possible Fed rate cuts by late 2025.
2.Bond Demand Outlook: Recession fears and de-risking scenarios trigger massive flows into long-term Treasuries, pulling yields lower.
3.Global Liquidity Conditions: Lower yields = increased liquidity = favorable conditions for crypto, gold, and risk assets.
4.Hawkish Risk: Any oil shock or CPI surprise can pause or reverse easing expectations, pushing yields up.
Effects on Gold & Crypto (as scenarios play out):
↗ If US10Y Yields RISE to 6% or 7.7% (TP2/TP3)
* Gold: Likely to suffer due to rising real yields; institutional demand weakens.
* Crypto: Bearish; risk assets sell off amid higher opportunity cost and tighter liquidity.
* Dollar (DXY): May strengthen, applying more pressure on gold & crypto.
* Strategy: Favor defensive positioning. Look for shorting rallies or hedge exposures in BTC, ETH, and high-beta alts.
↘ If US10Y Yields FALL toward 3.2% to 2.1% (Support 2–4):
* Gold: Bullish. Lower yields reduce holding costs and boost safe-haven appeal.
* Crypto: Bullish. Liquidity rotation into high-risk assets often follows easing cycles.
* DXY: Likely to weaken, further supporting BTC and altcoins.
* Strategy: Look to accumulate crypto during dips. Gold may offer breakout opportunities.
Rangebound Near 4.5% (Current Zone):
* Gold: Mixed; capped upside until clear direction emerges.
* Crypto: Ranges or whipsaws. Watch for breakout signals from BTC.D and TOTAL3.
* Strategy: Stay cautious. Monitor DXY and macro events for confirmation.
Related Reference Charts
TOTAL3 – Altcoin Market Cap Weekly
BTC.D – Bitcoin Dominance Weekly

Altseason Index Proxy (TOTAL3 / BTC.D) Weekly TF
Symbol & Timeframe:
* **Symbol**: CRYPTOCAP\:TOTAL3 / CRYPTOCAP\:BTC.D
* **Timeframe**: Weekly (1W),
* **Purpose**: A clean, data-driven proxy for detecting altseason momentum
Technical Structure:
✅ Key Support Zones
* **13.47B (61.8% Fib)**: Critical golden zone; current price consolidation area
* **12.45B (50.0% Fib)**: Lower bound of golden zone
* **11.00B**: Historical support zone
* **8.15B (0.0%)**: Absolute bottom of retracement range
🔹 Hidden Bullish Divergence
* **MACD Histogram & Signal Lines** show hidden bullish divergence
* Price action forming **higher lows** while MACD makes **lower lows**
* Indicates trend continuation potential
🔢 Fibonacci Targets
TP1: 16.8B (100.0%)
TP2: 22.2B (161.8%)
TP3: 30.7B (261.8%)
🔄 Expected Path
* Potential short-term correction toward 12.4B followed by a breakout
* Bullish continuation path sketched with progressive Fib targets
📈 Macro & Fundamental Confluence
📉 Liquidity and Monetary Easing
* Global monetary policy is easing (e.g., Fed pivot expected mid-2025)
* Increased liquidity historically precedes strong altcoin rallies
BTC Dominance Decline
* BTC.D rolling down from long-term highs
* Signals beginning of capital rotation into altcoins
🚀 Emerging Narratives
* Rise of L2s (e.g., Base, zkSync), AI tokens, real-world asset protocols
* Fresh narratives tend to amplify altseason rotations
💼 Institutional Tailwinds
* Spot ETH ETF approvals pave way for alt ETF flows
* Regulatory clarity expected to reduce uncertainty in late 2025
Related Reference Charts:
🌐 TOTAL3 (Altcoin Market Cap Excluding BTC & ETH)
📊 BTC Dominance (BTC.D)
These charts offer standalone confirmation of:
Altcoin strength forming on TOTAL3
BTC dominance facing structural resistance
Composite Altseason Thesis:
1. Liquidity injections + halving = BTC rally
2. BTC.D breakdown + TOTAL3 support = altcoin strength
3. Technical confirmations: hidden divergence, fib confluence
4. Narrative and regulatory catalysts = widespread rotation
**Conclusion**:
We are entering a prime zone for altseason acceleration. Price reclaim above 13.47B and continued BTC.D drop will validate bullish thesis. Monitor closely for breakouts past TP1 and momentum into TP2/TP3.
📌 Current status:
- Price rebounding in the 12.45–13.47B Fibonacci zone (50–61.8%)
- Hidden bullish divergence on MACD + ascending price structure
- BTC.D has rolled off 65% resistance — suggesting capital rotation
📊 Altseason Thesis:
1. Post-halving BTC rally → profit dispersion into altcoins
2. Macro conditions (Fed pivot, record liquidity) enabling risk-on environment
3. Technical confirmation via index momentum and fib structure
4. Narrative tailwinds: Layer-2 adoption, AI-crypto, altcoin ETF catalysts
📈 Targets:
- TP1 @ 16.8B (100% Fib)
- TP2 @ 22.2B (161.8% Fib)
- TP3 @ 30.7B (261.8% Fib)
🟢 Key support: 12.45–13.47B zone; breakout + BTC.D collapse = altseason trigger.

BVOL (Bitcoin Historical Volatility Index) Weekly TF 2025 Summary:
BVOL (Bitcoin Historical Volatility Index) remains compressed near historic lows. This analysis explores the potential for a volatility expansion cycle, key Fibonacci retracement levels, and how shifts in volatility may precede directional moves in BTC and the broader crypto market.
Chart Context:
Timeframe: Weekly (1W)
Current BVOL: ~13.23
Historical Support Zone: ~11.76–15 (consolidation base since 2022)
Resistance Area: ~25–35 (marked breakout threshold)
Fibonacci Retracement (from peak ~192.79):
23.6% = 56.17 → 2nd TP
38.2% = 89.01 → 3rd TP
48.6% = 99.74 → Intermediate fib zone
61.8% = 123.63 → Cycle expansion cap (potential BTC top region)
100% = 192.79 → All-time spike (rare volatility events)
Key Technical Observations:
Consolidation Floor: Since mid-2022, BVOL has hovered near extreme lows often a prelude to sharp directional moves.
Support-turned-Resistance: Past volatility surges often topped near fib clusters (23.6%, 38.2%, 61.8%). These will likely act as TP zones during volatility spikes.
Expected Path:
Base breakout above 25 → TP1 = 35
Acceleration phase → TP2 = 56–60
High volatility climax → TP3 = 85–89
Volatility Trend Commentary:
Current Phase: Low volatility compression, common in accumulation phases.
Volatility Expansion Signal: A break above the 25–35 band may signal the start of a high-volatility impulse (typically aligned with large BTC directional moves).
Dotted Paths on the chart reflect the two key expansion possibilities:
Straight rally up to TP3 (85)
Mid-stage pullback post-TP2 (bear trap scenario)
Macro Correlation:
BVOL vs BTCUSD: Historically, BVOL lows precede strong BTC trends — both bull and bear cycles.
BVOL vs BTC.D: BVOL surges often shift dominance; either BTC leads during volatility or altcoins rotate post-BTC move.
BVOL vs TOTAL / TOTAL2 / TOTAL3:
Volatility compression in BVOL is directly tied to range-bound TOTAL3.
Total:
Total2:
Total3:
BVOL expansion is often mirrored by strong TOTAL2 & TOTAL rallies.
Confluence seen between BVOL TP zones and critical fib levels in TOTAL charts.
Bias & Strategy Implication:
Volatility Expansion Expected: Current structure is unsustainable; expansion is highly probable in coming weeks/months.
Watch BTC Price Action: If BTC breaks key levels while BVOL rises → Confirmed trend.
Portfolio Strategy: Prepare for volatility-driven liquidation zones. Use BVOL to gauge position sizing and risk.
Notes & Disclaimers:
This analysis is part of the BitonGroup Macro Series.
BVOL is not a directional indicator but a volatility proxy. use in combination with price and dominance metrics.
Always combine volatility forecasts with proper stop-loss and leverage management.

Price correction to 103,000Right now, they are manipulating the market a lot, since it became clear that Trump is the winner of the election, they started manipulating the market in both gold and Bitcoin.
The ceiling of 123,200 should not be hit. Before that, the price should have been 108,000.
Now we have a correction, at least until 103,000 is not hit, the previous ceiling will not be hit.

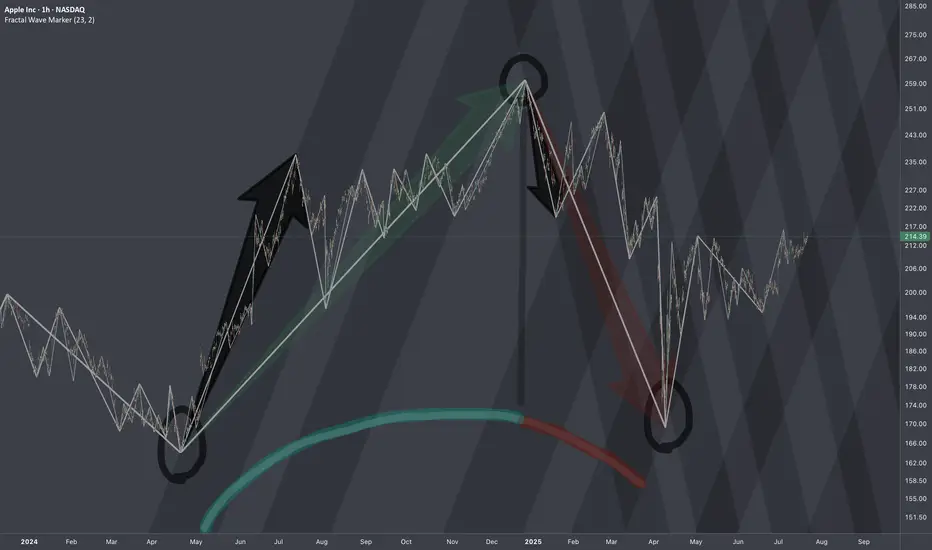
$AAPL: Structure SurgeryResearch Notes
Original Structure:
Altering structure for experimental purposes
Angle of fib channels that rises from cycle low, has been pushed into the past to the top of first major reaction. blue area resembles the change
Reason
The the angle of Fibonacci channels which cover the general decline (from perspective of ATH to end of cycle), are adjusted to the angle of the first bear wave of smaller scale.
Therefore, when it comes to measurements of opposing forces for working out interference pattern, having this symmetric approach of mapping interconnections is fair.
Liquidity Sell ModelTrade example from last week.
I wanted to show how the market cycles when it comes to liquidity. Usually price will create a decent high and low during the Asia session (Tokyo and Sydney). Once NY session opens, a sweep either above or below Asia session will occur before the true move occurs.
In this case, price swept above Asia session highs before dropping into SSL.

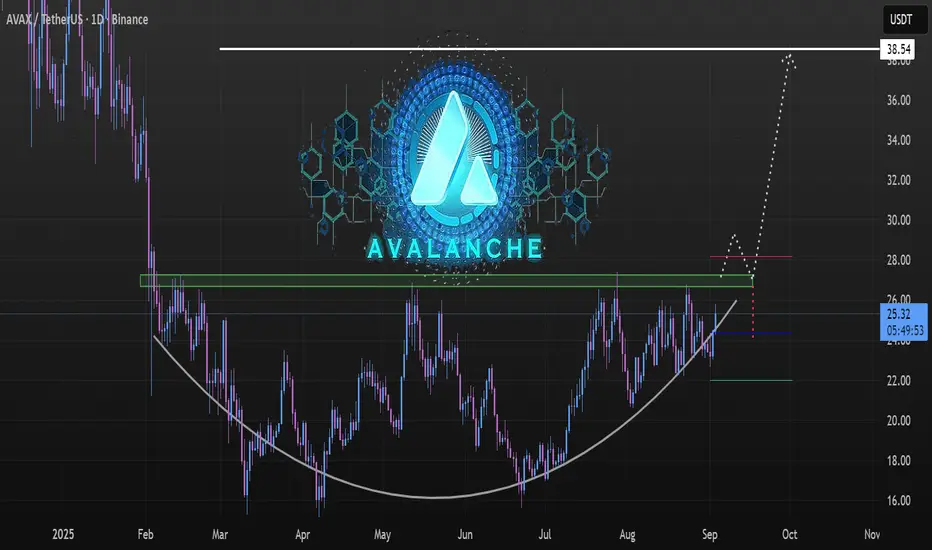
AVAX (Avalanche) 1D TF, Rounded Accumulation Phase BINANCE:AVAXUSDT Avalanche activity driven by DEXs, trading bots, whale memecoin speculation 📰
AVAX is Back in the Game, with the Alt season heating up 🌡️
At the time of charting Avax was trading above trendline support at $25.34, spotting a Positive Momentum Shift –Volume Likely to Expand, Psychological Recovery, reclaiming $25+ puts AVAX back in bullish radar after prolonged weakness.
Major Target: Sustained breakout projects to the measured move of the rounded base, aligning with 🎯$38.54, which is the chart’s major resistance and target➶ zone.
Chart Structure & Trend
Rounded Base Formation: From Aug 2025 to Sept 2025, AVAX formed a rounded bottom / cup ⊔ like structure, which often signals accumulation and a potential reversal from a bearish to a bullish phase.
Higher Lows 📈 Trendline a consistent series of higher lows, confirming strength in the uptrend.
Key Resistance Zone (Green 🟩 Band: ~$25.5–27.5): Price is consolidating at this supply zone where multiple rejections occurred earlier. This makes it the make-or-break level at the 5th time.
📈 Breakout Scenario
Trigger: A daily close above the green resistance band would confirm breakout strength.
Immediate Target: First move could extend towards the $28.50–29.00 minor resistance (red⭕ line area).
🪟Projection
Break above $27.5 → fast move to $29.
Sustained momentum → target $38.54 (≈ 52% upside from breakout).
⚠️Pullback / Risk Scenario
If rejection occurs at the green band, A deeper correction might revisit the price could retest $24.30 area (blue🔷 pivot line). but the rounded base structure remains intact unless that level fails.
“Markets don’t just price assets; they price belief, adoption, and time. For AVAX, the real question isn’t whether it can break resistance — it’s whether the ecosystem can keep compounding utility fast enough to justify the breakout. Are you watching the chart, or the chain?”
Always DYOR
Trade Safe,
See you on the other side
Review of Gold's expected rally and why we entered long todayLook at this chart and understand why it was the only move that was likely to happen today:
Firstly we already corrected all of the range down (balanced), that was the first key that we're potentially going to correct the drop next.
This is how markets work; correction of imbalances and continuations of the master trend direction.
The master/macro trend target is always the easiest no brain target for those of us who actually make money trading. Anytime we correct imbalances, we are looking to buy, only degenerates are looking for the short target and never realize where it is or when it's been hit--hello? It's the imbalanced ranges below, write this down:
When we are bullish, price will only go down to correct the major imbalanced ranges and then continue bullish.
There is no supply zone until the large wick range.
I will help you understand this stuff tirelessly even for free although I charge a $100/mo mentorship I don't care if people pay me, I just want you to see the easy truths about the chart most don't see 🫡

Altcoins are pressing against their 2021 bull market highs📊 The Total3 chart (altcoin market cap excluding BTC & ETH) is right at the $1.13T level - the same highs from the 2021 bull market highs.
Multiple rejections here in the past, but now we’re seeing tight consolidation just below resistance.
If this breaks, it could mark the beginning of a true altcoin breakout season.

FTT BUY!!!Hello friends
According to the market cycle that has been drawn for you, from here according to the cycle we expect a return to the ceiling.
*Trade safely with us*

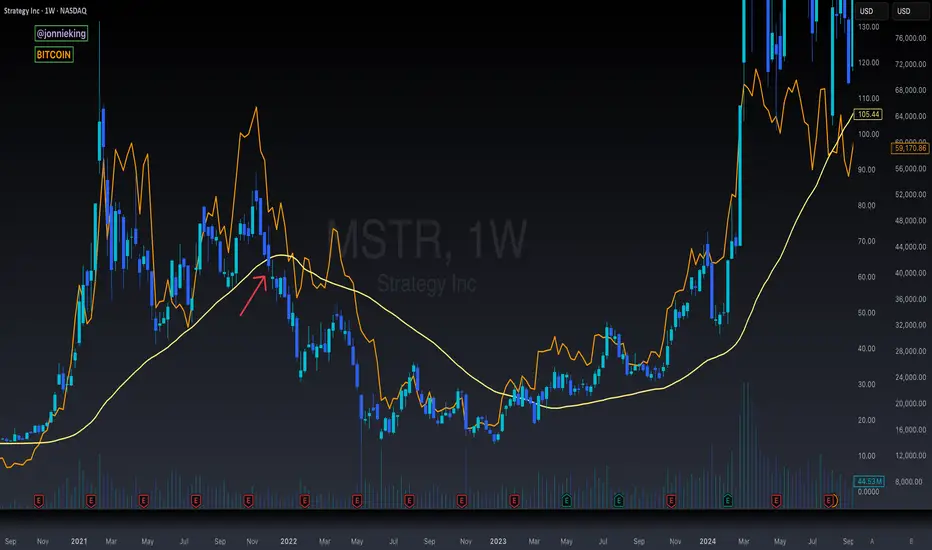
$MSTR Falling Below the 50WMA in 2021 Bull Market Here's a look at last cycle where NASDAQ:MSTR trading under the 50WMA for several weeks led to the CRYPTOCAP:BTC bear market.
The reason why this was so significant last cycle is because they were responsible for such a large share of BTC buy pressure.
This cycle we have lots of other treasury companies, with many more to come, as well as ETFs of course, so I'm not as concerned with this PA.
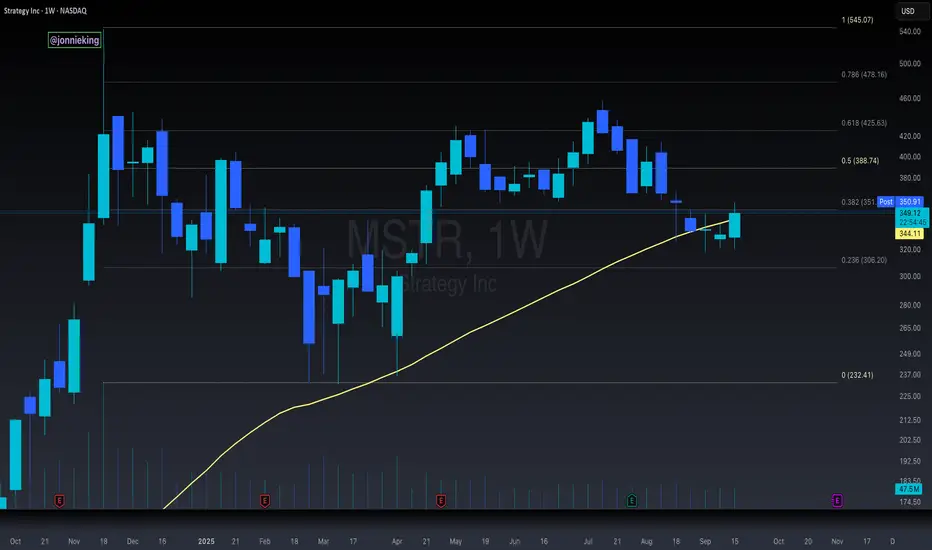
$MSTR Must Close This Week Above the 50WMA Or Else...The MicroStrategy chart is the only top signal that is somewhat cause for concern at the current moment.
You can see NASDAQ:MSTR has closed the past several weeks below the 50WMA, which signaled the start of the bear market last cycle.
Having said that, it has had a bullish rally this week and is trading above the 50WMA once again.
MSTR must close the week above this level, otherwise the stock could be in for a much deeper correction, which could negatively affect CRYPTOCAP:BTC in October.
Where have you heard that October prediction before?
Coincidence? 🥸
ETH UPDATEHello friends
Well, you can see that due to the bearish market cycle, the downward steps have gradually become smaller and we have hit a higher ceiling at the specified support, which is a sign of a weak trend or price flooring. If this specified price floor is maintained, the price can move to the specified targets.
*Trade safely with us*

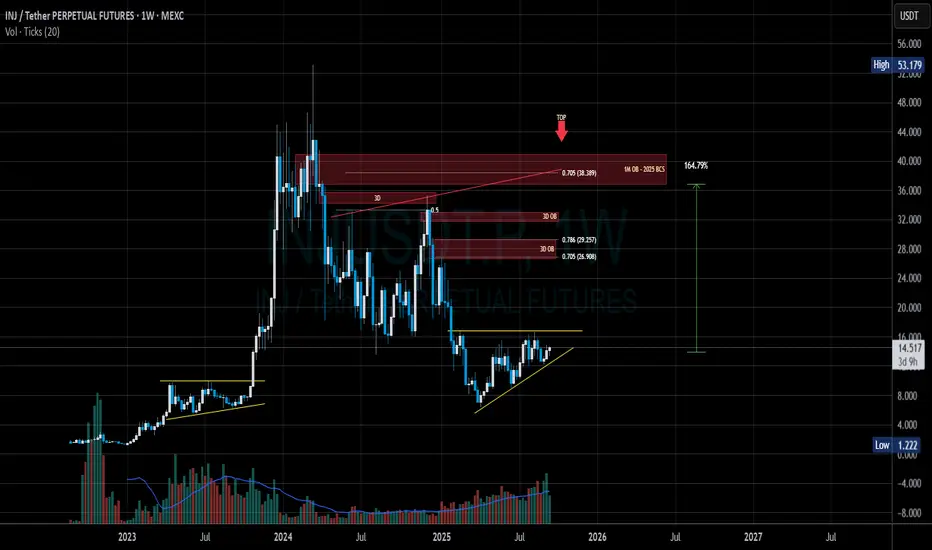
INJECTIVE - 2025 Targets & Areas to Consider TP / SHORTSubject to a BTC rally to new highs, and a 3-4 week "Alt Season" (IF GIVEN!), these are the levels that should be possible for INJ, confluent with OTHERS reaching 850B, USDT.D 3.3~3.5%. Best Case Scenario at $38 is technically confluent with .705 Fib, M1 supply block and trend resistance from May '24. The timing rhymes with a crypto cycle top around October 17th.
$GLQ Falling Wedge 2.0After peaking in 𝐅𝐞𝐛 ‘𝟐𝟑, AMEX:GLQ dropped 𝟗𝟎% and formed a 𝐟𝐚𝐥𝐥𝐢𝐧𝐠 𝐰𝐞𝐝𝐠𝐞 (May–Oct ‘23).
Inside the wedge, GLQ made 𝟒 𝐥𝐨𝐰𝐬 - 𝟐 𝐰𝐞𝐫𝐞 𝐥𝐨𝐰𝐞𝐫 𝐥𝐨𝐰𝐬.
The 𝐟𝐢𝐧𝐚𝐥 𝐥𝐨𝐰𝐞𝐫 𝐥𝐨𝐰 came just days before a 𝟓𝟎𝐱 𝐛𝐫𝐞𝐚𝐤𝐨𝐮𝐭.
After peaking in 𝐌𝐚𝐫 ‘𝟐𝟒, AMEX:GLQ again dropped 𝟗𝟎%… and is now forming the 𝐬𝐚𝐦𝐞 𝐟𝐚𝐥𝐥𝐢𝐧𝐠 𝐰𝐞𝐝𝐠𝐞 (Apr ‘25–Now).
So far: 𝟑 𝐥𝐨𝐰𝐬, 𝟏 𝐥𝐨𝐰𝐞𝐫 𝐥𝐨𝐰. Another touch down could complete the wedge before a 𝐛𝐫𝐞𝐚𝐤𝐨𝐮𝐭 (𝐎𝐜𝐭–𝐍𝐨𝐯?).

$GLQ: Two Roads, One Destination - HIGHER𝐅𝐢𝐛 𝐄𝐱𝐭𝐞𝐧𝐬𝐢𝐨𝐧
• 𝗠𝗼𝘃𝗲 𝟏: Price didn’t stop at the 𝟐.𝟔𝟏𝟖, 𝟑.𝟔𝟏𝟖, or even the 𝟒.𝟔𝟏𝟖.
It blew past them - then ripped another ~𝟗𝟑% 𝗵𝗶𝗴𝗵𝗲𝗿.
• 𝗠𝗼𝘃𝗲 𝟐: If the same behavior plays out, the 𝟐.𝟔𝟏𝟖 ($𝟎.𝟓𝟑) and 𝟑.𝟔𝟏𝟖 ($𝟎.𝟕𝟐) become pit stops.
The 𝟒.𝟔𝟏𝟖 ($𝟎.𝟗𝟐) acts as the launch pad.
A similar 𝟗𝟑% extension above that puts 𝗠𝗼𝘃𝗲 𝟑 𝗮𝘁 ~$𝟏.𝟕𝟕.
𝐓𝐡𝐞 𝐅𝐫𝐚𝐜𝐭𝐚𝐥
Move 1: 14x from low to high
Move 2: 54x from low of move 1 to high of move 2.
Move 2 is the same structure as move one, just on an expanded timeline.
That’s nearly 4x the multiple from Move 1 to Move 2.
If that progression continues...
Move 3 = ~200x from the base (~$3.77 AMEX:GLQ )
The targets don’t perfectly align…
…but they tell the same story: 𝐭𝐡𝐞 𝐧𝐞𝐱𝐭 𝐦𝐨𝐯𝐞 𝐢𝐬 𝐯𝐢𝐨𝐥𝐞𝐧𝐭, 𝐚𝐧𝐝 𝐭𝐡𝐞 𝐮𝐩𝐬𝐢𝐝𝐞 𝐢𝐬 𝐦𝐚𝐬𝐬𝐢𝐯𝐞.

FOMC has cleared liquidity levels around this technical rangeNews Drivers do not overpower technicals, the fundamentally driven movements are just banging around into huge money pending orders. No way around these mechanics.
That what we saw today, and what will continue to happen forever and ever 💎 Not saying it will always be a ricochet like today, but the orders are always there.

Fed Catalyst: The Bear AwakensGold rebounded after touching 3660 and is currently fluctuating in a narrow range around 3685. Gold is currently trading relatively cautiously, apparently waiting for the Federal Reserve's interest rate decision to indicate its short-term direction.
How to formulate a trading plan for the Federal Reserve interest rate decision market? In fact, in the short term, I think there will not be much room for gold to continue to rise, and the short-term peak may be in the 3705-3715 area; in addition, regarding the expectation of interest rate cuts, I think the Federal Reserve will adopt a step-by-step approach to announce a 25 basis point interest rate cut, and as for Powell’s attitude, I think it may rely more on the feedback from US employment data and inflation data to decide whether to continue to cut interest rates within the year. The attitude may not be obviously dovish, so I think there is limited room for short-term increases.
Since I think the short-term peak of gold is in the 3705-3715 area, and the short-term resistance area is around 3690. Therefore, I will definitely ambush and short gold before the news is announced. Of course, the transaction needs to be set up in combination with the risk resistance ability of my account.
At present, I tend to divide the upper space into two areas, namely 3685-3695 and 3705-3715. I will mainly short gold in batches around these two areas. Once gold falls as expected, I think it will first test the intraday low around 3660. Once it falls below this area, I think gold is likely to continue to test the area around 3635-3625.
As for whether gold can take advantage of this opportunity to test the area around 3600. I believe I will overcome my greed and will not take risks to gamble for gains beyond my cognition. I will need to make a secondary judgment based on market fluctuations at that time.In any case, I would favor a short gold setup, so let’s hope for a bearish recovery!

BITCOIN UPDATEHello friends
According to the open cycle, we can say that our trend is bullish and is in a channel, but a resistance has stopped it, which it has hit twice. Now we have to see if this resistance will finally be broken or if the price will continue to suffer below this resistance.
If the price breaks the resistance, it will move to the specified targets.
Trade safely with us.
