Retro Editors' picks 2023Moving onward, for the penultimate time, in our retro EP selection , we present to you the fourth collection of additional scripts that have earned a spot in our Editors' picks, this time from 2023.
These retrospective selections reflect our continued commitment to honoring outstanding contributions in our community, regardless of when they were published. To the authors of these highlighted scripts: our sincere thanks, on behalf of all TradingViewers. Congrats!
▋ KioseffTrading
10x Bull Vs. Bear VP Intraday Sessions
Delta Ladder
▋ LonesomeTheBlue
RSI Radar Multi Time Frame
▋ MUQWISHI Time & Sales (Tape)
Treasury Yields Heatmap
▋ RicardoSantos
MathEasingFunctions (library)
▋ Trendoscope
Angled Volume Profile
Zigzag (library)
ZigzagLite (library)
Next month, in the last week of September, we will share our final Retro Editors' Picks, for 2024.
These will also be visible in the Editors' picks feed .
Previously published retro Editors' picks:
May: retro EPs for 2020
June: retro EPs for 2021
July: retro EPs for 2022
█ What are Editors' picks ?
The Editors' picks showcase the best open-source script publications selected by our PineCoders team. Many of these scripts are original and only available on TradingView. These picks are not recommendations to buy or sell anything or use a specific indicator. We aim to highlight the most interesting publications to encourage learning and sharing in our community.
Any open-source script publication in the Community Scripts can be picked if it is original, provides good potential value to traders, includes a helpful description, and complies with the House Rules.
— The PineCoders team
Community ideas

Don’t Be the Exit Liquidity: The Truth About IPOsPicture this: a company wants to go public. They don’t just toss shares on the market like a garage sale. No. The sequence is distinct.
First, the company sits down with the sharpest pencils on Wall Street—the underwriters. These aren’t TikTok stock gurus; they’re analysts whose job is to tear apart every balance sheet and market forecast. They value the business, set a price, and—here’s the kicker—they buy the shares themselves. Real money on the line. Then they resell to big funds. Only after that circus is done does the stock finally hit the exchange, where the rest of us can click “buy.”
Now, what happens at the open? Retail traders pile in like it’s Black Friday, paying two or three times the IPO price because “it’s going to the moon.” But who’s on the other side of that trade? The pros. The funds. The people who literally just bought the same shares for half the price. They’re not dumb. They’re happy to sell you their cheap stock at your expensive price.
Look at 2025’s hottest IPOs:
Figma (FIG): Priced at $33. Opened at $85. Shot to $142. Now back near $74.
Circle (CRCL): IPO $31. Opened $69. Spiked to $299. Collapsed to $135.
Chime (CHYM): IPO $27. Opened $43. Two weeks later? $29.
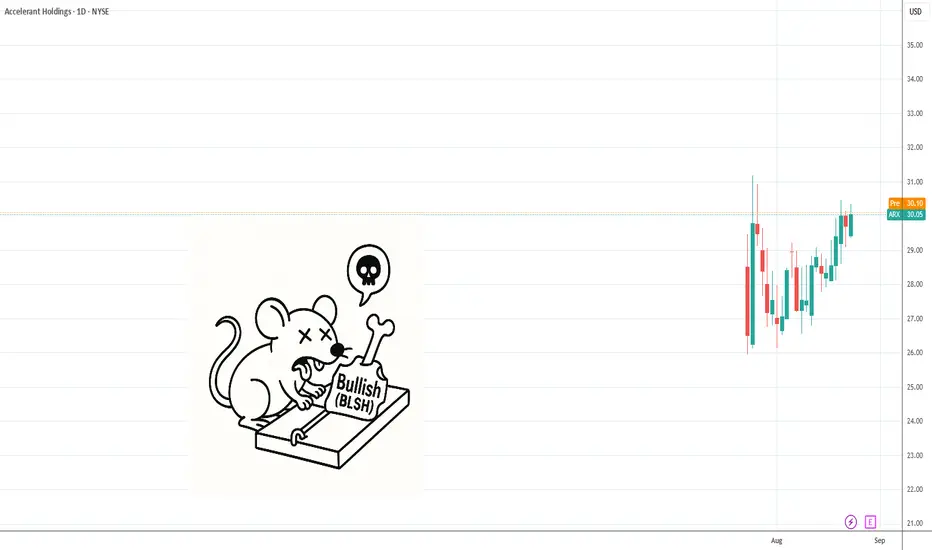
Bullish (BLSH): IPO $37. Opened $95. Peaked $118. Then sagged to $68.
See the theme? If you chased the open, you weren’t investing. You were buying somebody else’s victory dinner.
Here’s the advice your future self will thank you for: trust the underwriters’ homework. These people aren’t perfect, but they’re the best paid risk managers on the planet, and they literally put their own money into the deal. If the IPO is priced at $30, there’s usually a reason. Paying a little premium—maybe 20–30%—is fine. But doubling or tripling that on hype? That’s how you end up holding the bag.
If you want an IPO that’s actually worth leaning into a bit above the ask, keep an eye on Accelerant Holdings. Insurance may sound boring, but boring makes money. They’re disrupting an industry with a clear, scalable model. Unlike some flashy names, Accelerant has a simple story and a real path to growth. Paying 30% above ask for that? Much smarter bet than chasing a crypto stock that just opened at triple.
Final thought: IPO day isn’t a lottery. It’s poker. The pros already know the cards. Don’t sit down at their table without understanding the rules.
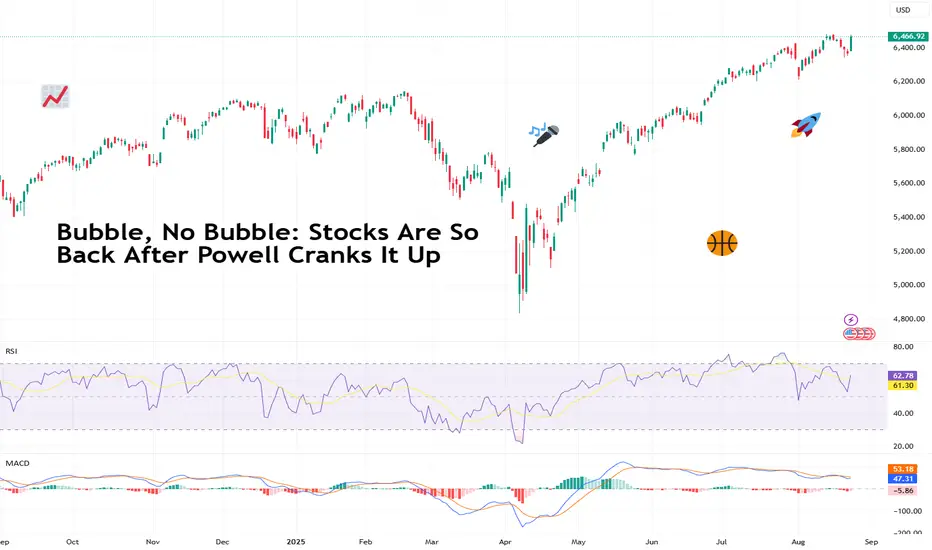
Bubble, No Bubble: Stocks Are So Back After Powell Cranks It UpStretched valuations, talks of froth, and overall market fatigue. That’s what investors were saying for stocks (especially those AI plays) up until Powell brought up the vibe that rekindled the animal spirits. Let’s talk about that.
📈 Powell Drops the Mic
Markets started last week exhausted. The S&P 500 SP:SPX was wobbling, the Nasdaq NASDAQ:IXIC was shedding like your beautiful ragdoll cat, and traders were probably looking up vacation getaways instead of technical patterns.
But then on Friday we all came together to hear one man speak . It was the same neutral, laid back tone, but this one time something was different. As if… a bolder man was on the stage, unafraid to crank it up. Or was it more of an elderly man finally giving the kids what they wanted?
In his speech at Jackson Hole, Fed boss Jay Powell acknowledged what markets had been hoping to hear: “The risk of rising prices has diminished.” Translation? The Fed finally sees inflation cooling down. And the labor market might need some help, too.
That was all it took. Risk appetite flipped, sending equities way higher into Friday’s close (even though Monday's futures dipped a bit ).
The S&P 500 SP:SPX booked a solid 1.5% pop, the Dow Jones TVC:DJI surged 1.9% to a fresh all-time high, and the Nasdaq NASDAQ:IXIC managed to erase much of its weekly losses after a strong 2% increase. Powell didn’t cut rates yet — he just gave markets a few reasons to believe cuts are coming.
🚧 The Job Market Pivot
Before Powell spoke, traders were bracing for maybe one rate cut this year, if any. Sticky inflation had the Fed cornered. But Powell flipped the narrative, shifting attention to the labor market instead.
The US unemployment rate has climbed nearly a full percentage point over the past year, and job growth is slowing fast, averaging just 35,000 new positions per month over the past three months. Even worse, revisions stripped 258,000 jobs from May and June’s data.
For traders, this was the lightbulb moment: a weakening labor market gives Powell the green light to pivot.
🔥 Inflation Still Isn’t Dead
Here’s the awkward part: while Powell’s tone eased market fears, the inflation problem hasn’t magically vanished. Core CPI is still running 3% year-over-year, well above the Fed’s 2% target, even as the headline CPI ECONOMICS:USCPI stood at 2.7% for July .
Meanwhile, wholesale prices ECONOMICS:USPPI — often a precursor to consumer price trends — surged 0.9% last month , marking their fastest monthly jump in three years.
Powell is walking a tightrope: move too quickly on cuts, and inflation could flare up again; wait too long, and the job market weakens further. The stakes are high, and the balance fragile.
🎈 Bubble Talk, Again
Every time stocks rip higher, the “bubble” debate resurfaces. And honestly? It’s hard to ignore it this time. AI stocks are priced like they’ve already rewired how the world works, and the Nasdaq’s relentless rally looks almost too clean.
But here’s a reality check. We’ve never had a big market crisis for the past 16 years. March 2020? Recovered in a few months. April’s mini-crash? Erased in weeks.
Markets seem determined to brush off every scare and buy the dip. Powell’s pivot only reinforced that attitude: traders don’t care about stretched valuations if the Fed is hinting at cheaper money ahead.
🤖 Nvidia’s Market, Nvidia’s Rules
That’s how we move forward to what’s next. Nvidia NASDAQ:NVDA drops earnings on August 27 ( Earnings Calendar for reference). And because this is Nvidia’s market and we all live in it, expectations are sky-high.
Analysts are projecting just under $46 billion in revenue and $1 per share in earnings . But the real focus? Forward guidance.
If Nvidia signals a blockbuster Q3 — something in the ballpark of $54 billion in sales — it could keep fueling the AI mania and push the Nasdaq and the S&P 500 to fresh highs. But if the numbers disappoint, this entire rally could wobble.
Considering Nvidia has added more than $3 trillion in market cap since 2023, it’s no exaggeration to say the stock’s earnings could set the tone for everything else.
🦁 Animal Spirits Are Back
Powell’s softer tone and the Nvidia hype machine have combined to reawaken animal spirits across Wall Street. That makes for a good example on how you can shift from doom-posting about stagflation to refreshing the ATH charts in less than 48 hours.
The S&P and the Dow are at or near record highs, the Nasdaq is eyeing another breakout. What’s not to like? The rally isn’t bulletproof.
It’s being driven as much by vibes as fundamentals right now. Rate cuts haven’t happened yet, the labor market is fragile, and inflation hasn’t fully cooled. The market appears to be trading on optimism — and optimism can turn fast.
🏁 The Bottom Line
Jerome Powell didn’t announce a rate cut, but he did something almost better: he opened the door a bit wider. By acknowledging softer labor data and reduced inflation risks, he revived traders’ appetite and gave permission to believe the rally has legs.
But this story has two big hinges: Nvidia has to deliver, and inflation has to behave. One earnings miss or a hot CPI print, and this animal spirit revival could fade as quickly as it started.
Off to you : Are you long and excited about the outlook? Or you’re in the bear camp and looking for your chance to short this market? Share your views in the comments!
Amazon Chart CheckOn the weekly chart, Amazon looks like it’s starting to tire a bit. Price is struggling just under that January high near 24,252.
Looking at the Ichimoku Cloud:
• In mid-2023, price broke strongly above the cloud and bounced cleanly higher after retests.
• More recently (spring 2025), we had a decent correction but bounced again.
• Now, instead of bouncing hard, price is just sitting on top of the cloud — feels weaker than before.
On the daily chart:
• The 200-day moving average has been a line in the sand since May. Several successful tests and bounces.
• Currently, price is hugging the daily cloud.
• If we see erosion near 219–220(top of the cloud), a quick dip back to the 200-day MA (~21,280) is very possible.
• A close below that could signal a potential top forming.
⚠️ For me, this uptrend feels a little tired — worth keeping an eye on and possibly tightening stops if you’re in the trade.
Disclaimer:
The information posted on Trading View is for informative purposes and is not intended to constitute advice in any form, including but not limited to investment, accounting, tax, legal or regulatory advice. The information therefore has no regard to the specific investment objectives, financial situation or particular needs of any specific recipient. Opinions expressed are our current opinions as of the date appearing on Trading View only. All illustrations, forecasts or hypothetical data are for illustrative purposes only. The Society of Technical Analysts Ltd does not make representation that the information provided is appropriate for use in all jurisdictions or by all Investors or other potential Investors. Parties are therefore responsible for compliance with applicable local laws and regulations. The Society of Technical Analysts will not be held liable for any loss or damage resulting directly or indirectly from the use of any information on this site.

Nvidia Shares Maintain Bearish Bias Near $170Over the past three trading sessions, Nvidia’s shares have posted a sharp decline, accumulating losses of more than 3% in the short term. For now, the emerging selling bias around the stock remains in place, as the market fears a potential overheating of the artificial intelligence industry. Added to this is the anticipation of the company’s results on August 27, which may show difficulties in revenue, mainly due to concerns that sales in China have weakened in recent months amid the intensifying trade war. Earnings per share are expected to come in around $0.94, but uncertainty remains as to whether this figure can hold given possible performance challenges. As long as this uncertainty persists, selling pressure on the stock could remain in the short term.
Uptrend Channel at Risk
Recent sessions have shown a clear shift in the bullish outlook that Nvidia had been sustaining in prior weeks. A significant bearish correction has emerged, halting the advance of the short-term uptrend channel and leading to a breakdown of its lower boundary. As long as selling pressure continues, this previous channel may lose relevance and give way to a broader bearish scenario, provided the bearish bias remains dominant.
Technical Indicators
RSI: the RSI line has begun to show a downward slope, now approaching the neutral 50 level. If it breaks below this threshold, selling momentum could become dominant in the short term, paving the way for stronger bearish pressure on the chart in the upcoming sessions.
MACD: the MACD histogram is currently moving below the 0 line, reflecting that short-term moving averages have entered a sustained bearish territory. If the histogram continues to decline, selling pressure is likely to strengthen further in the short term.
Key Levels to Watch:
$184 – Main Resistance: corresponds to the area of recent highs. A sustained recovery above this level could reactivate a bullish bias and bring back strength to the uptrend channel.
$173 – Near-Term Support: current congestion zone of recent weeks and the most immediate barrier. A sustained move below this level could trigger a stronger bearish bias in the short term.
$162 – Crucial Support: aligned with the 23.6% Fibonacci retracement. A decisive break below this level would confirm a bearish structural shift, opening the door to a new selling trend in the short term.
Written by Julian Pineda, CFA – Market Analyst

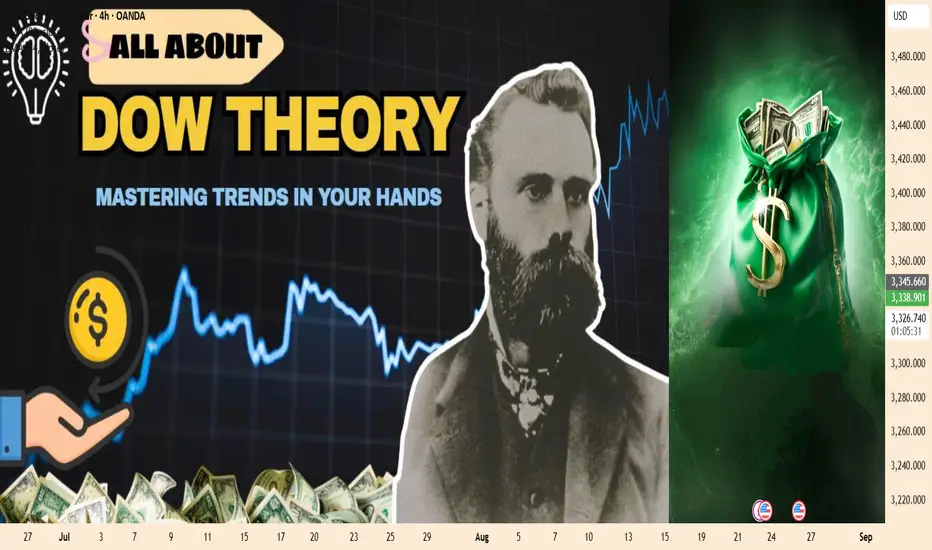
Dow Theory: Unlocking Market Trends for Consistent ProfitsDow Theory is the foundation of modern technical analysis. Developed by Charles H. Dow in the late 19th century, this theory asserts that the market reflects all information and price movements always follow identifiable trends. To this day, Dow Theory remains a "compass" for traders in understanding price behavior.
6 Core Principles of Dow Theory:
The Market Reflects All
Price includes all information: news, expectations, psychology, and economic data. Therefore, the chart is the most reliable source of information.
The Market Has 3 Trends
Primary Trend: Lasts for several months to years.
Secondary Trend: Adjustments within the primary trend, usually lasting a few weeks.
Minor Trend: Fluctuates over a few days, less significant.
The Primary Trend Has 3 Phases
Accumulation: Smart investors quietly buy.
Public Participation: Large capital flows in, and the trend becomes clear.
Distribution: Large institutions begin to offload, preparing for reversal.
Indices Must Confirm Each Other
Dow used the industrial and railroad indices; today, this means trends are only valid when multiple markets/inter-markets confirm the same direction.
Volume Confirms the Trend
In an uptrend, volume should increase when the price rises and decrease during corrections. The opposite is true for downtrends.
Trends Continue Until Clear Reversal Signals Appear
Traders shouldn’t try to pick bottoms or tops, but rather follow the trend until there's confirmation of a change.
Practical Significance for Traders:
Helps identify the main trend to follow the big money.
Aids in risk management by avoiding trading against the trend.
Provides a comprehensive view: price, volume, and market phases.
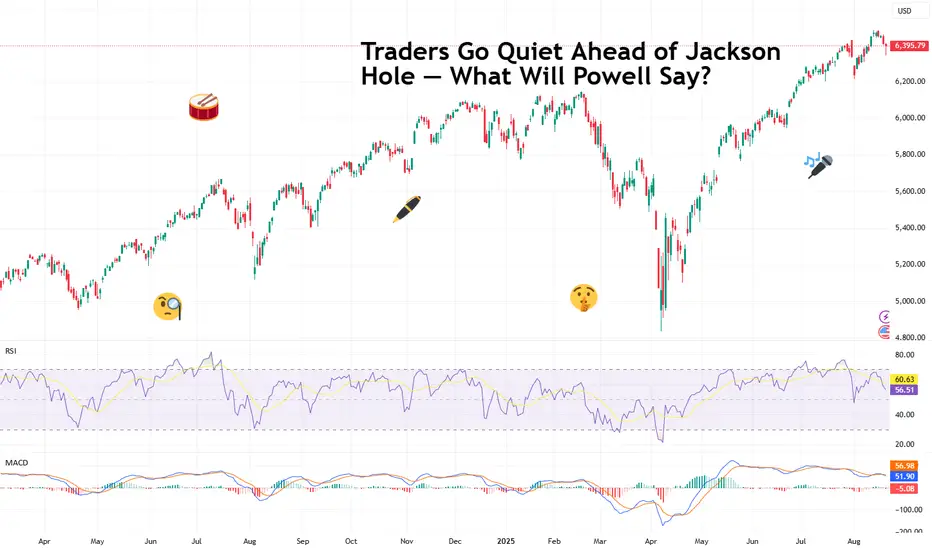
Traders Go Quiet Ahead of Jackson Hole — What Will Powell Say?Markets have been eerily quiet this week. Not because traders suddenly discovered meditation, but because everyone is waiting for one man in Wyoming to make things move.
Federal Reserve Chair Jerome Powell, the man who moves markets with a simple “Good afternoon,” is about to step onto the stage at the annual Jackson Hole Economic Symposium. And when he does, markets will hang on every word — because it’s his final speech as Fed boss at the premium event.
⛰️ Jackson Hole: Where Hiking Boots Meet Basis Points
The Jackson Hole conference isn’t your average PowerPoint snoozefest. Each year, central bankers from around the world swap suits for Patagonia fleeces and gather in Wyoming’s Grand Teton National Park. Think Davos, but with more elk.
This year’s theme? “Labor Markets in Transition.” Translation: the Fed wants to talk demographics, productivity, and immigration — the forces shaping how Americans work and how the economy grows. But make no mistake: nobody’s tuning in for a TED Talk on labor force participation rates. They want Powell’s take on interest rates.
🎯 Powell’s Big Moment
Powell’s speech may only run about 15 minutes (he’s not known for monologues), but the stakes couldn’t be higher. His term as Fed chair ends in May, and President Donald Trump has spent most of this year taking swings at him — calling him a “major LOSER” and grumbling that the Fed is moving “Too Late” on rate cuts.
Trump has even floated the idea of firing Powell early, which, technically speaking, isn’t supposed to happen. But this is 2025, and “not supposed to happen” has lost most of its meaning.
So, Jackson Hole could be Powell’s last best chance to lock in a legacy: defending the Fed’s independence while signaling where rates are headed next.
⛅️ Markets Already Have a Guess
Wall Street isn’t exactly sitting in suspense. Interest-rate swaps are pricing in an 80% chance of a 25-basis-point cut in September, with two full cuts baked in before the year is out.
Why? Because the data leaves Powell little wiggle room:
Jobs market: Recent revisions show weaker-than-thought employment growth . Maximum employment? Not quite.
Inflation: July’s consumer price index came in at 2.7% year-on-year — stable, but not scary enough to justify keeping rates where they are forever.
Tariffs: Trump’s sweeping duties could pressure inflation further, but they’re also weighing on growth. Powell’s challenge is threading the needle between those forces.
Translation: the Fed looks ready to flip from “higher for longer” to “cutting season.”
🧘♂️ Traders on Mute
If you think markets look a little sleepy, you’re not wrong. On Monday, the S&P 500 basically took a nap , slipping 0.01% as traders sat on their hands. Tuesday was even worse with big tech nosediving all day long.
It’s not just Powell they’re waiting for. Roughly 95% of S&P 500 companies have now reported earnings, (mandatory note: catch all earnings dates in the Earnings Calendar ) with more than 80% beating expectations.
Companies have been surprisingly nimble, offsetting tariffs and riding the weaker dollar . Yet despite the blowout earnings season, nobody wants to make big moves until Powell clears the air.
Call it the pre-Jackson Hole silence — the calm before the potential volatility storm.
🥊 Powell vs. Trump
There’s also political theater baked into this. Trump has made no secret of his desire for lower rates to juice growth and pump markets. Powell, however, has tried to keep the Fed above the political fray.
But that balancing act has been messy. Lower too quickly, and Powell risks stoking more inflation. Hold too high, and he risks slowing the labor market just as it’s showing cracks. Either way, he’ll be accused of playing politics.
This isn’t just about economics. It’s about central bank independence — a fancy way of asking: Can Powell make decisions without getting steamrolled by the White House?
🔮 What to Watch For
Here’s what traders will parse in his speech:
Tone: Does Powell sound more dovish (hinting at cuts) or still hawkish (concerned about tariffs fueling inflation)?
Framework: Will he unveil a new policy strategy for inflation and jobs?
Forward guidance: Any nods to September’s meeting or beyond will be amplified a thousand times on trading desks worldwide.
In other words, the market doesn’t just want Powell’s words. It wants the subtext and the context.
🚀 Why It Matters for Traders
For traders (yes, you), Powell’s Jackson Hole moment has real portfolio consequences:
Equities: A dovish Powell could extend the market’s record run — the S&P 500 and Nasdaq already logged new all-time highs this summer.
Bonds: Rate cuts could mean yields falling, bond prices rising. Treasuries might not be the snooze trade they’ve been.
Dollar: Lower rates could push the greenback down, offering a boost to commodities and emerging markets. Lower rates = lower deposit yields = less appeal to hold greenback.
Crypto: Yes, even Bitcoin BITSTAMP:BTCUSD cares. A dovish Fed means more liquidity sloshing around — which historically finds its way into risk assets.
🏁 The Takeaway
Markets are quiet now, but don’t expect them to stay that way. Powell’s Jackson Hole speech is shaping up as one of the most important of his career — maybe his swan song as Fed chair.
Off to you : Here’s a question (or two). Will he go dovish, handing traders the rate cuts they crave? Or will he stand firm, reminding everyone that the Fed won’t be bullied by politics? Share your thoughts in the comments!
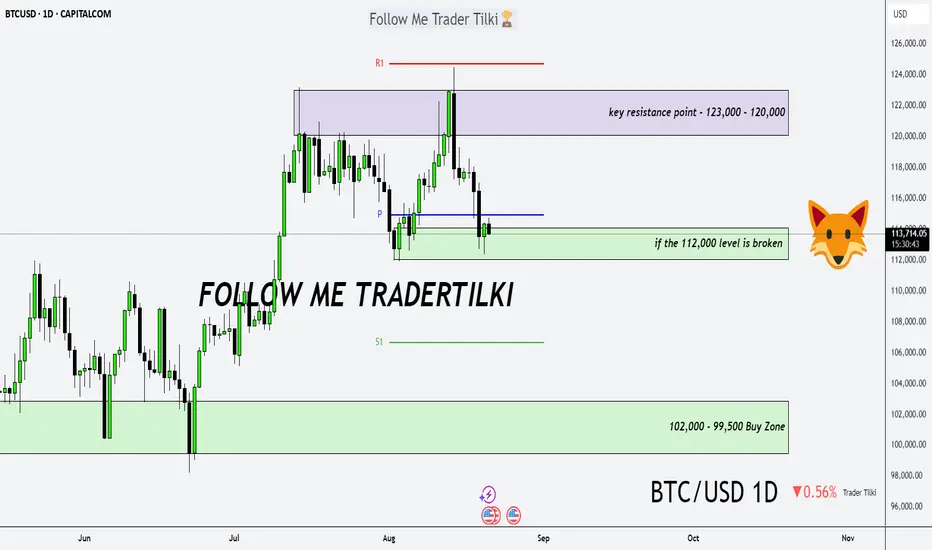
Bitcoin Daily Analysis – The Trend Is Our FriendGood morning, Guys,
I’ve prepared a fresh Bitcoin analysis for you.
🔹 First off, I stand firmly behind my long-term targets of **127,000 – 137,000 – 146,000**. I previously shared these levels with you in a weekly analysis.
🔍 Now let’s shift to the 1-day chart:
What is Bitcoin telling us right now?
📉 If the **112,000 level breaks downward**, we could enter a correction phase toward **102,000** or even **99,500**. I expect strong buying interest to return from those zones.
📈 After that, we’re facing a key resistance structure between **123,000 – 120,000**.
But I believe this zone will also be broken—because we’re in an **uptrend**, and…
💬 **The trend is our friend. Never forget that.**
Is the AI Trade Done for Now?AI has been a dominant theme for months, but some traders may think the robots are getting tired.
Today’s idea highlights a few key stocks in the technology sector associated with the trend.
First is Microsoft, which jumped on July 31 after strong results but failed to hold. It subsequently made a series of lower highs, and is now breaking the bottom of that triangle.
MSFT also closed under its 21-day exponential moving average for the first time since mid-April. MACD has been falling as well. Those signals may suggest its short-term trend has morphed from positive to negative.
Palantir has performed similarly. The software company gapped to new highs but then failed to hold and is now lower than it was the day of the news:
Third, Advanced Micro Devices more than doubled between late March and mid-August. But this weekly chart shows it stalling at $187.28, a peak from April 2024:
Finally, MSFT, PLTR and AMD are some of the most active underliers in the options market. That could help some traders take positions with calls and puts.
TradeStation has, for decades, advanced the trading industry, providing access to stocks, options and futures. If you're born to trade, we could be for you. See our Overview for more.
Past performance, whether actual or indicated by historical tests of strategies, is no guarantee of future performance or success. There is a possibility that you may sustain a loss equal to or greater than your entire investment regardless of which asset class you trade (equities, options or futures); therefore, you should not invest or risk money that you cannot afford to lose. Online trading is not suitable for all investors. View the document titled Characteristics and Risks of Standardized Options at www.TradeStation.com . Before trading any asset class, customers must read the relevant risk disclosure statements on www.TradeStation.com . System access and trade placement and execution may be delayed or fail due to market volatility and volume, quote delays, system and software errors, Internet traffic, outages and other factors.
Securities and futures trading is offered to self-directed customers by TradeStation Securities, Inc., a broker-dealer registered with the Securities and Exchange Commission and a futures commission merchant licensed with the Commodity Futures Trading Commission). TradeStation Securities is a member of the Financial Industry Regulatory Authority, the National Futures Association, and a number of exchanges.
Options trading is not suitable for all investors. Your TradeStation Securities’ account application to trade options will be considered and approved or disapproved based on all relevant factors, including your trading experience. See www.TradeStation.com . Visit www.TradeStation.com for full details on the costs and fees associated with options.
Margin trading involves risks, and it is important that you fully understand those risks before trading on margin. The Margin Disclosure Statement outlines many of those risks, including that you can lose more funds than you deposit in your margin account; your brokerage firm can force the sale of securities in your account; your brokerage firm can sell your securities without contacting you; and you are not entitled to an extension of time on a margin call. Review the Margin Disclosure Statement at www.TradeStation.com .
TradeStation Securities, Inc. and TradeStation Technologies, Inc. are each wholly owned subsidiaries of TradeStation Group, Inc., both operating, and providing products and services, under the TradeStation brand and trademark. When applying for, or purchasing, accounts, subscriptions, products and services, it is important that you know which company you will be dealing with. Visit www.TradeStation.com for further important information explaining what this means.

CM - The Best Method I’ve Found For Finding - Stocks That MOVE!!Today I want to show you The Best Method I’ve Found to Create a list of Stocks to find the most profitable stocks to TRADE consistently.
Please leave a comment below if:
You find this video useful.
You have any questions.
You want me to do a video on how I built the screeners shown in the video.
You want me to continue providing the up to date watchlists.
The link to import the watchlist from the video:
www.tradingview.com
Thanks...

AUDUSD Reversal Risk as Buying Power WeakensAUDUSD Reversal Risk as Buying Power Weakens
In recent days, AUDUSD has shown upward momentum, but buying pressure appears to be waning.
The pair has slipped from 0.6570 to 0.6480 without any clear fundamental catalyst, suggesting a potential loss of bullish steam.
Currently, price action seems to be in a corrective phase, and AUDUSD has approached a minor resistance zone near 0.6523.
This area may act as a ceiling, potentially driving the pair back toward the 0.6485 and 0.6455 level.
You may find more details in the chart!
Thank you and Good Luck!
PS: Please support with a like or comment if you find this analysis useful for your trading day
Disclosure: I am part of Trade Nation's Influencer program and receive a monthly fee for using their TradingView charts in my analysis.

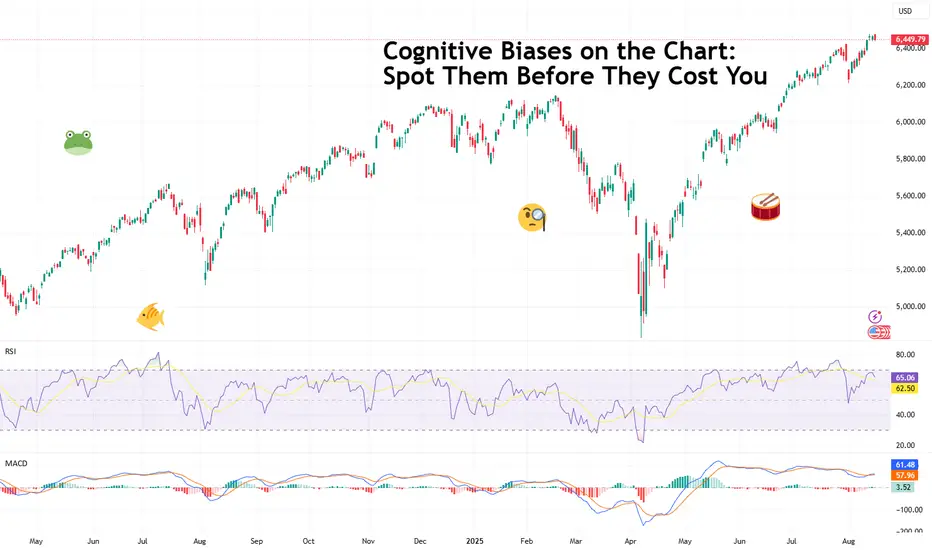
Cognitive Biases on the Chart: Spot Them Before They Cost YouMarkets have enough enemies: central banks, unexpected earnings misses, rogue tweets from billionaires. The last thing you need is your own brain quietly kneecapping your trades.
Yet, that’s exactly what happens every day — traders falling prey to cognitive biases, those sneaky mental shortcuts that can distort judgment, inflate confidence, and drain your account.
Let’s pull back the curtain on the biggest culprits.
💍 Anchoring Bias: Marrying a Trade
Ever fall in love with a number? Traders do this all the time. Anchoring bias happens when you fixate on a past price and let it lead your present decisions.
Example: You bought C3 AI NYSE:AI at $45 a pop. Now it’s under $20, and you refuse to sell because “it’ll get back to $50 and beyond.” Newsflash: the market doesn’t care about your entry. Anchoring keeps you tethered to arbitrary price points while the trend moves on without you.
👉 How to counter it : Use hard data, not nostalgia. If the chart screams breakdown, like the recent drop in NYSE:AI thanks to a sales disaster , stop waiting for a magical return to your anchor. Trade the price action, not the ghost of your buy button.
😌 Loss Aversion: Pain > Pleasure
Behavioral economists tell us that losing $100 feels about twice as bad as winning $100 feels good. Traders know this instinctively — which is why they often let losers run and cut winners short.
Think of it: you close a trade that’s up 5% because you “don’t want to lose the gains.” Meanwhile, you let the -20% red candle sit there because “it’s only a loss if I sell.”
👉 How to counter it : Flip the script. Place stop-losses and honor them religiously, especially in peak earnings season . Train your brain to view losses as part of the game — like paying rent to the market for playing on its field. Or tuition fee for your hands-on education.
🔊 Confirmation Bias: The Echo Chamber Trade
You think Ethereum BITSTAMP:ETHUSD is going to $5,000. So, naturally, you seek out influencers, news, and even memes that validate your thesis, while conveniently ignoring that pesky Fed statement hinting at liquidity tightening.
This is confirmation bias: curating your information diet to make yourself feel smart, secure, and validated.
👉 How to counter it : Actively hunt for disconfirming evidence. If you’re long, force yourself to read the bear case. If it rattles you, that’s a sign your conviction might be built on shaky ground. Also, Ethereum has indeed been on a pump so strong , you’d believe it’s almost unstoppable.
💫 Recency Bias: Yesterday = Forever
Markets swing, sometimes violently. Recency bias tricks you into believing that whatever just happened will keep happening. The FX:GBPUSD advanced last Thursday ? Must keep climbing further.
Traders caught in this loop over-leverage into recent patterns, forgetting that markets are professional curveball pitchers.
👉 How to counter it : Zoom out. Intraday candles may trick you into seeing things that aren’t there in the long run. Daily, weekly and monthly charts often tell a different story.
💪 Gambler’s Fallacy: “I’m Due” Syndrome
Every roulette player knows this one: if red’s hit five times in a row, black must be next. Traders fall for the same illusion. If FX:EURUSD has surged for eight straight sessions , surely it must drop… right?
Wrong. The market doesn’t know it “owes anything.” Trends can persist longer than your margin account can survive. Reminder time: John Maynard Keynes' famously said, "Markets can remain irrational longer than you can remain solvent."
👉 How to counter it : Respect momentum. Use indicators like RSI or moving averages to spot genuine exhaustion, not just wishful thinking.
😎 Overconfidence Bias: I’m Smarter Than Them
This one’s pretty widespread. After a few wins, traders start believing they’ve cracked the code. Suddenly, leverage dials up, position sizes balloon, and risk management gets left on read.
Markets love humbling overconfident traders. That “can’t miss” setup? It misses. That oversized bet? Blown up. Overconfidence is why many promising traders don’t survive past year one.
👉 How to counter it : Journal your trades . Cold, hard data has a way of deflating ego bubbles. And size positions consistently — the market doesn’t care if you “feel” more confident this time.
🐑 Herd Mentality: Everyone Can’t Be Wrong… Right?
If all of Reddit says “buy the dip,” surely they can’t be wrong. But if you’re hearing it from everyone, odds are the move already happened. Herd mentality gives comfort but rarely alpha.
It explains bubbles, FOMO runs, and why traders pile into a hot stock minutes before it tanks.
👉 How to counter it : If you’re chasing a move because everyone else is, pause. Ask: what’s my actual edge here? If the answer is “none,” step away.
💯 The Meta-Bias: Thinking You Have None
The cruel twist? Once you know about these biases, you might think you’ve conquered them. But that may not be the case. Awareness helps, but biases are hardwired into human behavior.
That’s why risk management exists. Stop-losses, adequate leverage, proper diversification — they’re not just tools, they’re counter-bias survival kits.
🙌 Final Word: Outsmarting Yourself
The market isn’t your enemy (unless you view BlackRock, Ken Griffin, the hedge fund bros, and other retail traders as enemies). Anchors, overconfidence, herds, recency — these are real chart criminals draining accounts in broad daylight.
Smart traders don’t try to eliminate biases. They build guardrails to minimize the damage. Because at the end of the day, you can’t reprogram human psychology. But you can protect your portfolio from it.
👉 Off to you : Are you tempted to “average down because it’s due” or “let it ride because I’m on fire?” Share your thoughts in the comment section!
My favorite set up Looks like this company got beat up after earning. I dont pay much attention to news but from what I can see is a bunch of people complaining about this stock being undervalued and beaten up.
Well this is where I just come in and look for an entry model.
Now this is a dangerous trade… because of course; it’s in a down trend.
But this entry model is a reversal model. (I have entered on this last 4 hour close and mainly trading the 4 hour on this)
I love reversals because it gives me a clear stop loss and a clear take profit. They almost always treated as a risk 1:2 trade for profit minimum for me
I will not be greedy with taking profits since this is in a down trend (I will defiantly leave shares on the table as runners and update a new idea as we get close to TP1 range.
This is not an investment for me, just a swing trade that hopefully will play out quickly.
Reason for entering
1. Inversion on the 4 hour FVG on the last green candle
2. Smart money took out all stop losses after earnings which is what you will see I have marked as SSL (Sell Side Liquidity)
3. We have clear targets now that we see the Bulls have stepped in with big time buying pressure after we made the new lower low. -Clear targets meaning we must now rebalance atleast 50% of the leg down that we related from the last swing high. This is what price tends to do.
Since it is showing me strength and now starting what’s called an OB FVG (Orderblock Fair Value Gap) on the 4 hour time frame than this indicated to me we could take way more than 50% of the drop and potentially do some damage to short sellers.
Now this idea can get totally obliterated and thats why stop losses will be tight under neath the swing low we just made. But if the 4 hour shows us a v-shape recovery this week then this trade could move pretty damn quick for us.
NOTE: MY STOP LOSS WILL BE MOVED TO BREAK EVEN AS PRICE GETS NEAR $3.50!
I will be trimming probably 60% of profit between $3.50 and $3.70
Stops at break even
The rest of my shares I will target the sub $5 range for, and keep a few hundred shares for the lotto ticket long term play (:
Ask me questions if your confused about my analysis.

Deep Dive Into Keltner Channel 🗓The Keltner Channel is a volatility-based technical indicator that helps traders identify market trends, breakout opportunities, and potential reversal zones. Built using an Exponential Moving Average (EMA) and the Average True Range (ATR), it adapts dynamically to price movement and provides a smoother alternative to Bollinger Bands.
📚 Introduction
The Keltner Channel is a versatile volatility-based trading indicator that helps traders identify trend direction, spot potential breakout opportunities, and determine overbought or oversold conditions.
Unlike Bollinger Bands, which use standard deviation, the Keltner Channel is built around the Average True Range (ATR), making it less reactive to sudden price spikes and better at adapting to steady market trends.
At its core, the channel consists of three lines:
Middle Line – an Exponential Moving Average (EMA) of the price
Upper Band – EMA plus a multiple of ATR
Lower Band – EMA minus the same multiple of ATR
When price stays close to the upper band, it indicates strong bullish momentum.
When price hugs the lower band, bearish pressure dominates.
Periods of narrow channel width often precede breakouts, while wide channels may signal trend exhaustion.
📚 Calculation
The Keltner Channel is typically calculated as follows:
Middle Line = EMA(n) , where n is the chosen period length (commonly 20)
Upper Band = EMA(n) + ATR(m) * Multiplier , where m is chosen period length for ATR
Lower Band = EMA(n) - ATR(m) * Multiplier , where m is chosen period length for ATR
EMA smooths price data while giving more weight to recent values. ATR measures volatility by accounting for true price ranges, including gaps. Multiplier (often 2) determines how far the bands are from the EMA.
📚 How to Use Keltner Channel in Trading Strategies
⚡️Keltner Channel Breakout Strategy
The Keltner Channel breakout strategy is built on the idea that the channel defines a normal range of price movement. The middle line reflects the average trend, while the upper and lower bands expand with volatility. Most of the time, price stays inside this range, so a close outside the channel signals unusual strength. A breakout above the upper band shows that buyers are strong enough to push price beyond what is typical, while a breakout below the lower band shows the same for sellers. This behavior suggests momentum is likely to continue, making it a potential point to join the trend.
Long Setup:
Price candle shall be closed above 200-period EMA
Candle closes above the Kelner's Upper Band, indicating strong bullish breakout
Put your trailing stop-loss at the Middle Band, close trade only when candle closes below it
Short Setup:
Price candle shall be closed below 200-period EMA
Candle closes below the Kelner's Lower Band, indicating strong bearish breakdown
Put your trailing stop-loss at the Middle Band, close trade only when candle closes above it
📈Long Trading Strategy Example
1. Price candle shall be closed above 200-period EMA. In our example we have BITMART:BTCUSDT.P 4h time frame.
2. Open long trade when price candle closed above the Keltner's Upper Band.
3. Close trade when price candle closes below the Middle Band
In our case we have 2:1 risk to reward trade if we compare initial stop loss and exit price.
📉Short trading strategy example
1. Price candle shall be closed below 200-period EMA. In our example we have BITMART:ETHUSDT.P 4h time frame.
2. Open short trade when price candle closed below the Ketlner's Lower Band.
3. Close trade when price candle closes above the Middle Band
In this case we have not a good trade. After closing short price continues dropping but then suddenly pumped and destroyed all gained profit. We think it's also important to show such trades it will make you more prepared for real market when you start trade using this strategy.
🧪 Important: as you could see stop-loss on the candle close above/below Middle Band can't be the best decision in every case. It will help you to avoid the false trade close, but usually significantly cut your profit. As always we highly recommend to make your out backtest using different trade exit approaches. You can try 3:1 RR or close exactly at the Middle Band and compare the results with provided close only approach.
⚡️Pullback to the Middle Line
The pullback-to-the-middle-line strategy focuses on the EMA at the center of the Keltner Channel, which acts as dynamic support in uptrends and resistance in downtrends. In trending markets, price often retraces to this middle line before continuing in the direction of the prevailing move.
When the EMA is sloping upward, traders look for buying opportunities when price returns to the middle line, expecting the trend to resume. In a downtrend, the EMA slopes downward, and touches of the middle line can be used as selling points.
Exits are usually made at the opposite channel band, since price tends to extend from the EMA toward one of the outer boundaries. This gives the setup a favorable risk-to-reward profile: stops are placed near the middle line or the most recent swing, while profit targets are naturally defined by the channel structure. The key is to apply the strategy only in clear, directional markets, as pullbacks lose reliability in sideways or choppy conditions.
Long Setup:
Middle Band's slope shall be upward indicating the short-term uptrend.
Open long trade when price pulled back to the Middle Band.
Put stop-loss below the Lower Band.
Take profit at the Upper Band.
Short Setup:
Middle Band's slope shall be downward indicating the short-term downtrend.
Open short trade when price pulled back to the Middle Band.
Put stop-loss above the Upper Band.
Take profit at the Lower Band.
📈Long Trading Strategy Example
1. Middle Band's slope shall be positive. We use BITMART:BTCUSDT.P 4h time frame.
2. Open long trade when the price pulled back to Middle Band.
3. Put initial stop loss at the Lower Band.
4. Take profit at the Upper Band.
📉Short trading strategy example
1. Middle Band's slope shall be negative. We use BITMART:BTCUSDT.P 4h time frame.
2. Open short trade when the price pulled back to Middle Band.
3. Put initial stop loss at the Upper Band.
4. Take profit at the Lower Band.
🧪 Important: this strategy provides high frequent fast trades with poor risk to reward. Typically it equals approximately 1:1, but this setup has the high probability to play out well. Moreover, this strategy can be used in conjunction with the strategy from point 1 described above. Conditions don't contradict to each other and can allow you to earn money on two different market conditions.
⚡️Mean Reversion Strategy
The mean reversion strategy with the Keltner Channel is based on the assumption that price tends to return toward its average after moving too far away. The outer bands of the channel serve as dynamic thresholds that help identify when the market is stretched.
When price closes near or beyond the upper band, it suggests temporary overextension to the upside, creating an opportunity to anticipate a move back toward the EMA. Conversely, when price touches or moves below the lower band, traders look for a rebound toward the middle line.
The trade idea is to enter counter to the extreme move, with exits placed around the central EMA. Stop losses are typically set just outside the channel to protect against strong breakouts. This approach works best in sideways or range-bound markets, where prices oscillate around a fair value, but it tends to underperform in strong trends.
Long Setup:
Price candle shall be closed above 200-period EMA.
Open long when price touches the Lower Band.
Put initial stop-loss according to your money management system.
Close trade the Upper Band.
Short Setup:
Price candle shall be closed below 200-period EMA.
Open short when price touches the Upper Band.
Put initial stop-loss according to your money management system.
Close trade the Lower Band.
📈Long Trading Strategy Example
1. Price candle shall be closed above 200-period EMA. In our example we have BITMART:BTCUSDT.P 4h time frame.
2. Open long at the Lower Band
3. Put stop-loss. In our case we use 2%, you can use stop-loss based on your asset/time frame volatility and money-management.
4. Take profit at the Upper Band.
📉Short trading strategy example
1. Price candle shall be closed below 200-period EMA. In our example we have BITMART:ETHUSDT.P 4h time frame.
2. Open short at the Upper Band
3. Put stop-loss. In our case we use 3%, you can use stop-loss based on your asset/time frame volatility and money-management.
4. Take profit at the Lower Band.
📚 Conclusion
The Keltner Channel is a versatile tool that adapts to different market conditions and trading styles. Whether applied as a breakout system to capture momentum, as a pullback framework to ride established trends, or as a mean reversion setup in ranging markets, it provides traders with a structured way to interpret price action. Like any strategy, its effectiveness depends on matching the approach to the prevailing market environment and applying consistent risk management. By understanding the underlying logic of each method and practicing disciplined execution, traders can make the Keltner Channel a valuable part of their technical toolkit.

The Golden Pocket: Fibonacci’s Sweet Spot in TradingHello, traders! 😎
If the crypto market had a VIP lounge, the golden pocket would have a permanent reservation. It’s that elusive, almost mystical zone in the Fibonacci retracement where price often decides its fate. Will it make a heroic comeback… or lose steam entirely? Before we dive in, one thing needs to be crystal clear: the golden pocket in trading is not a magic wand. On its own, it’s just a mathematical range. Used without confirmation from other indicators, volume analysis, or broader market context, it can lead you straight into a trap. Professional traders and algorithms treat it as one tool in a much BIGGER TOOLBOX .
What Is the Golden Pocket in Trading?
In technical terms, the golden pocket refers to a specific slice of the Fibonacci retracement scale, typically between 61.8% and 65%. These numbers aren’t random. The 61.8% figure comes from the Fibonacci sequence, a ratio found in nature’s architecture — spirals of seashells, galaxies, flower petals — and eerily echoed in financial markets. The small range between 61.8% and 65% is what traders call the Fibonacci golden pocket or golden pocket fib levels.
Here’s the logic: when an asset trends up but starts to pull back, it often retraces a portion of that move before continuing. The fib retracement golden pocket tends to be the last meaningful zone where buyers step in before momentum breaks completely. In a downtrend, it works the same way but inverted — the price rallying into the golden pocket often finds sellers ready to push it back down.
Why does it matter? Market behavior is, in part, a reflection of human psychology. Many traders — from retail to institutions — watch these levels, which makes reactions here more probable. Add in algorithms coded to act at certain Fibonacci ratios, and you have a cluster of activity that can turn the golden pocket into a genuine battleground.
But, and here’s that warning again, a retracement into the golden pocket alone doesn’t guarantee a reversal. Without confluence from other tools (trendlines, moving averages, volume spikes, momentum oscillators), it’s simply a potential reaction zone.
Why the Golden Pocket Works (Sometimes)
The golden pocket trading concept thrives on repetition. Over years of chart history across markets — stocks, forex, crypto — this small Fibonacci zone has been tested again and again. It often coincides with areas of previous support/resistance or with liquidity zones where large orders are waiting.
Think of it like this: if price is a runner and the market is a racetrack, the golden pocket is the point where the runner slows down to decide whether to push for another lap or leave the track. Sometimes they sprint ahead, sometimes they collapse, but the decision often happens there.
In crypto, this zone is particularly watched because of the market’s volatility. Bitcoin, Ethereum, and other majors have shown countless reactions here, which keeps the cycle going. Traders believe in it because it’s worked before, and because traders believe in it, it works again… until it doesn’t. That’s the critical point. IT DOESN’T ALWAYS WORK . Treating it as gospel is one of the fastest ways to get stopped out. Smart traders always ask: What else confirms this zone?
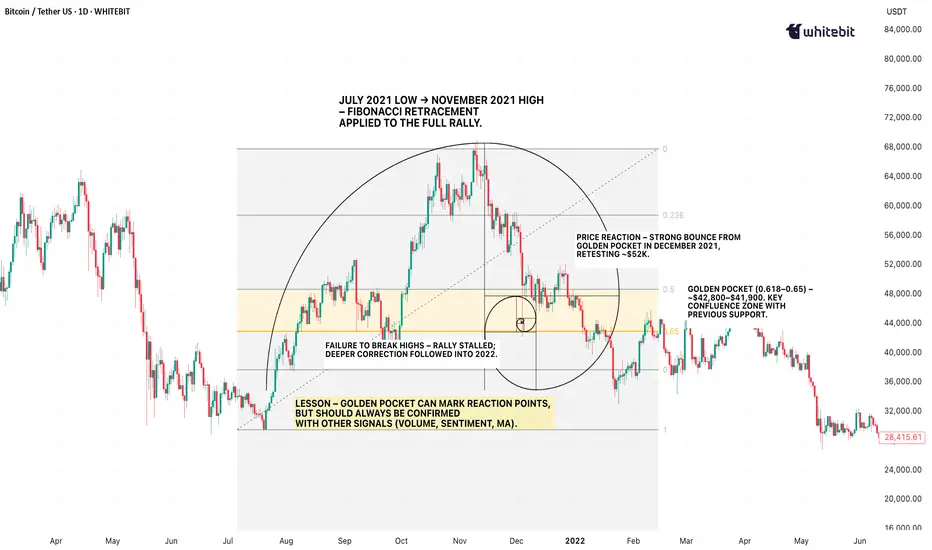
A Real Bitcoin Example
Let’s jump back to September 2021. Bitcoin had rallied from its July swing low around $29,000 to the early September high near $52,900. Then, a correction began.
If you plotted a Fibonacci retracement from that July low to the September high, the pullback landed almost perfectly in the golden pocket range between $42,800 and $41,900. On the chart, this wasn’t just a random number zone — it aligned with a previous area of consolidation and a visible liquidity shelf.
The market reaction? Price respected the zone, paused for a few sessions, then bounced to retest the $52K area. However, here’s the twist — it didn’t break new highs. By November, the rally failed, and BTC entered a deeper correction.
That single example tells you everything you need to know: the golden pocket can be a reaction point, but not a guaranteed trend reversal. Those who combined it with volume divergence, macro sentiment, and moving averages saw the warning signs early. Those who didn’t… learned a painful lesson.
The Takeaway
The golden pocket fibonacci is one of those charting concepts that sticks in traders’ minds because it’s both elegant and, at times, eerily accurate. It’s a reflection of how price action can mirror natural ratios found in the world around us.
But markets are not bound by mathematics alone — they’re driven by liquidity, sentiment, and macroeconomic forces. The golden pocket in trading works best when it’s part of a confluence: combine it with other technical indicators, volume profile analysis, or key horizontal levels.
On its own? It’s just a pretty number. In the right hands, with the right supporting evidence, it’s a zone where history has shown the market likes to make decisions.
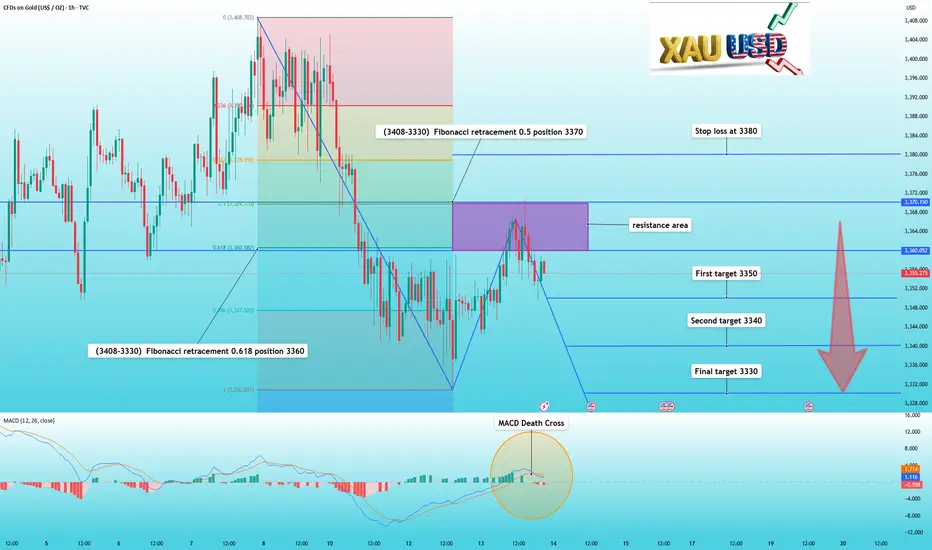
Gold pulls back as expected, you can continue to sellIn my previous trading strategy, I reiterated my view that gold prices would continue to fall if they couldn't break through 3370 in the short term.
And indeed, gold's performance behaved as expected. After hitting 3370, it fell again, reaching a low of 3350.
Technically, the current correction in gold prices hasn't concluded. The Fibonacci retracement indicator for the 3408-3330 trend shows that 3370 is at 0.5, and 3360 is at 0.618, representing resistance. Meanwhile, the MACD indicator has formed a death cross.
Therefore, we do not need to make any changes to our trading strategy. As long as 3370 is not effectively broken, we can continue to short based on the resistance range.
Trade setup is as follows:
Sell near the 3360-3370 area
First target 3350
Second target 3340
Final target 3330
Stop loss at 3380
📣If you have different opinions, please leave a message below to discuss
Ether Soars in Massive Rally — Is Altcoin Season Finally Here?Bitcoin who? Move over, orange coin. It's the alt season and Ethereum and its crew of alternatives are here to party.
🚀 Ether Edges Toward All-Time High
Ethereum BITSTAMP:ETHUSD is all the game in crypto town right now. Prices climbed another 3% early Thursday, cruising past $4,750 and now just some $100 away from the 2021 record high. The last time Ether was here, NFTs were still making headlines for selling pixelated rocks.
But this one is different (yes, it really is different this time) — it’s institutional validation driving the breakneck rally.
The spark? A mix of deep-pocketed corporate treasury moves, a flood of ETF inflows, and a billionaire with a knack for backing winning tech plays. Everyone, give it up for Ether Peter — PayPal NASDAQ:PYPL and Palantir NASDAQ:PLTR co-founder Peter Thiel, out there betting on Ethereum treasury firms.
🦖 ETHZilla: From Biotech to Blockchain
The biggest headline driver this week is ETHZilla — also known as 180 Life Sciences NASDAQ:ATNF . In a plot twist worthy of a streaming docuseries, the California-based biotech firm drops the lab coats and rebrands into an Ethereum treasury powerhouse.
Earlier this week, ETHZilla announced it had scooped up 82,186 ETH at an average price of $3,806.71, now valued at about $349 million. The stock tripled on Tuesday, sending its market cap to $1.6 billion.
The company funded its transformation with $156 million from convertible notes and $425 million via a private placement involving more than 60 institutional and crypto-native investors.
Oh, and they got Peter Thiel’s stamp of approval — his Founders Fund disclosed a 7.5% stake in ETHZilla just as the Ether shopping happened.
🏦 BitMine and the $24.5B Goal
If ETHZilla is the new kid on the block, BitMine AMEX:BMNR is the neighborhood whale. This Ethereum treasury giant holds $5 billion in tokens and just filed paperwork with the SEC to potentially raise another $24.5 billion.
The ambition? Accumulate 5% of Ethereum’s total supply — about 6 million Ether coins, worth roughly $26.5 billion at today’s prices. For context, that’s like buying a decent slice of the entire network and then staking it for dessert.
Peter Thiel’s involvement here isn’t small either — Founders Fund disclosed a 9.1% stake in BitMine. Clearly, he’s betting big on Ethereum’s next chapter.
📈 ETFs Overflowing
The timing couldn’t be better. US spot Ethereum ETFs are in on it, breaking records, with over $1 billion in daily inflows for the first time this Monday. Since April 9 — some call it Liberation Day, but for some it's Liquidation Day — Ether BITSTAMP:ETHUSD has rocketed up 240%, while Bitcoin BITSTAMP:BTCUSD has pulled together a comparatively modest 60% gain.
The message from the market is loud and clear: altcoin season is back on the menu.
💼 Corporates Join the ETH Treasury Club
Public companies are now mimicking the MicroStrategy NASDAQ:MSTR Bitcoin playbook — except this time, the ticker is BITSTAMP:ETHUSD .
Fundamental Global, a small-cap reinsurer, surprised the market by filing an S-3 registration to raise up to $5 billion for Ethereum purchases.
Traders and investors didn’t love the dilution risk — the stock cratered 48% after the announcement — but management insists this is a long-term accumulation strategy.
They’ve already closed a $200 million private placement to get started, aiming for a 10% stake in the Ethereum network (yes, seriously) through staking, restaking, and other DeFi strategies. CEO Kyle Cerminara says this move “positions ETH as a core corporate asset.”
🐋 Whales Making Waves
Fundamental Global isn’t alone. In July, SharpLink Gaming NASDAQ:SBET added 77,210 ETH — a $295 million buy — and this week followed up with another $400-million purchase, bringing total holdings to nearly 600,000 ETH worth over $2.6 billion.
GameSquare NASDAQ:GAME also jumped in, announcing in July that it would build an ETH treasury rather than a Bitcoin one. The company raised $8 million to kickstart a $100 million phased buying plan.
🌊 Altcoins Catch the Updraft
It’s not just Ethereum feeling the love. Altcoins are getting swept along for the ride:
Solana COINBASE:SOLUSD cracked $200, up 25% over the past week.
XRP BITSTAMP:XRPUSD gained 12% in the same stretch.
Dogecoin COINBASE:DOGEUSD — because of course — surged 24%.
Chainlink COINBASE:LINKUSD stood out as a top performer, rising over 45% last week. Its boost comes after launching the Chainlink Reserve, now holding $1.5 million worth of LINK tokens.
When the big alt moves, the smaller ones often follow. Traders call it correlation. Cynics call it FOMO.
🔍 The Bigger Picture
Ethereum’s market cap now sits at around $570 billion. The combination of corporate treasuries, ETF flows, and growing DeFi infrastructure is creating a bullish cocktail not seen since the last altcoin cycle.
But let’s not forget the fine print: Ether’s price is heavily momentum-driven right now. The $4,700 level is a psychological barrier, and a retest of the $4,500 range could still happen before a breakout to new highs.
For long-term holders, the story isn’t just about charts, but also about Ethereum’s growing role as a corporate and institutional asset, something Bitcoin pioneered but Ether may now be refining.
Off to you : Now that altseason’s kicked off, how’s your portfolio looking? Are you holding any small-cap moonshots? Or you’re on team Ether? Share your strategy in the comments!

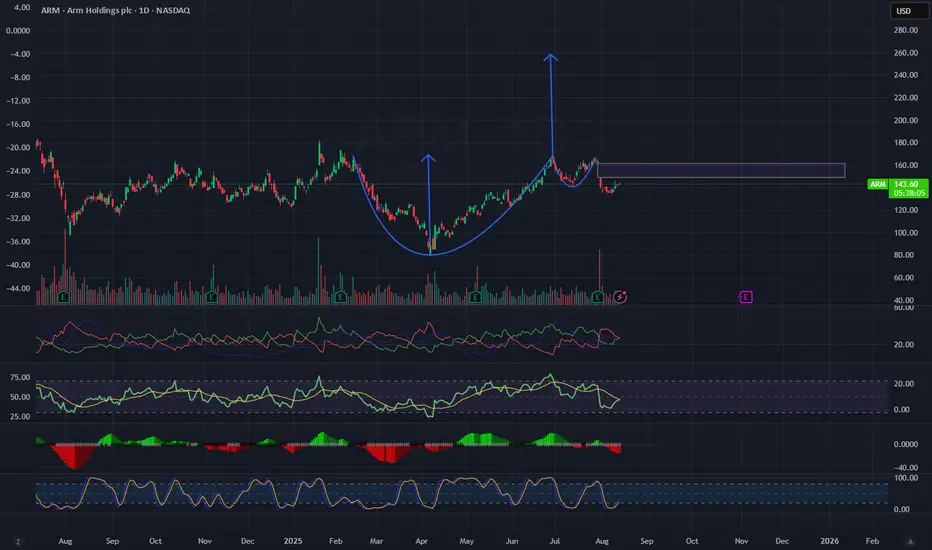
ARM – Cup & Handle Pattern with Potential BreakoutOn ARM’s daily chart, we can see a clear Cup & Handle pattern – twice in a row – with strong upward moves following each completion.
The latest pattern completed around the $165 area, after which the stock pulled back into a healthy correction and is now consolidating in the $140–$150 range.
Technical Analysis:
Pattern: Cup & Handle with a small pullback, indicating potential re-accumulation.
Key Support: $140 (a breakdown below would weaken the setup).
Key Resistance: $150–$155 (a confirmed breakout above could trigger the next bullish leg).
Indicators:
RSI near 50 – neutral, room to move higher.
MACD in a correction phase but close to a potential bullish cross.
ADX showing temporary trend weakness but could strengthen after a breakout.
Stochastic slightly in overbought territory but not extreme.
Volume: Decreasing volume during the pullback – a healthy sign for a potential upward breakout.
Trade Plan:
Entry: On a confirmed breakout above $155 with higher-than-average volume.
Target 1: $165 (previous resistance).
Target 2: $180–$185 (depending on momentum strength).
Stop Loss: Daily close below $140.
Summary:
ARM is showing a classic bullish setup with a strong potential for another upward move. A breakout of the key resistance levels with strong volume could trigger a sharp rally, similar to the previous two bullish waves.
Circle buying opportunity. Bullish chartWith the announcement of the new stock release, more selling should come. I see limit entries of 139 and 144 to be ideal. Overall pattern is 4th wave correction IMO. Target at least double top in short term and much higher long term. People smarter than me would put stop losses under those targets, but I'm a degen. Any accumulation in the green box should be good.

Cable & Fibre!So, generally I'm happy with the way the market is going. Though a little bit uncertain about how high it wants to go before it resumes its downward spiral, things are going good so far.
Looking at Cable, on an hourly chart, we see that between 06:00 am and 08:00 am (New York Time), there is FVG formed and to its left, there is a breaker. This a perfect setup for me, but I will wait to see if price actually wants to go above the 1.3477 level to reach for the 4H as well as 1H FVG.
I've put a sell limit on the fibre at 1.1635, but I will remove it for now, 'till I have confirmed whether price will go above 1.1698 level, to go into the 4H FVG, the mid-point thereof. I have a sell limit there with a stop loss at .1745.

RBA Cut by 25bp: Where From Here?The Reserve Bank of Australia (RBA) finally delivered the 25bp cut I anticipated in July. I take a quick look at how they have updated the economic forecasts that matter, and how Aussie markets reacted.
Matt Simpson, Market Analyst at City Index and Forex.com

AMP Futures - Heikin Ashi meets bar Replay!In this idea we will demonstrate how to access the NEW Heikin Ashi bar replay feature in Tradingview.

