Bitcoin Roadmap | Short-termBitcoin( BINANCE:BTCUSDT ) began to decline from the resistance zone($95,020-$94,840) exactly as expected in my previous idea , successfully reaching all targets.
At the moment, Bitcoin was able to break the support zone($90,650-$90,000). It seems that the pullback to the broken support zone($90,650-$90,000) could be completed with a symmetrical triangle pattern, although given the low trading volume on Saturday and Sunday, this triangle may not function properly.
In terms of Elliott Wave theory, Bitcoin appears to be completing the microwave C of the main wave B, and I expect at least one more impulsive 5-wave move to the upside.
I expect Bitcoin to start rising from the support zone($89,230-$88,000) or the Potential Reversal Zone(PRZ) maximum. A break of the resistance lines could be a good sign for Bitcoin to rise again.
What do you think? Do you believe Bitcoin will dip below $75,000, or will it bounce back?
Cumulative Short Liquidation Leverage: $98,260-$96,690
Cumulative Short Liquidation Leverage: $90,560-$89,990
Cumulative Long Liquidation Leverage: $87,820-$87,290
Cumulative Long Liquidation Leverage: $83,900-$82,400
First Target: $89,911
Second Target: $92,119
Stop Loss(SL): $86,120(Worst)
Points may shift as the market evolves
💡 Please respect each other's opinions and express agreement or disagreement politely.
📌Bitcoin Analysis (BTCUSDT), 1-hour time frame.
🛑 Always set a Stop Loss(SL) for every position you open.
✅ This is just my idea; I’d love to see your thoughts too!
🔥 If you find it helpful, please BOOST this post and share it with your friends.
Elliott Wave

ADAUSDT → Correction (hunt for liquidity) before the fall BINANCE:ADAUSDT is pausing in the 0.41 area and entering a correction phase, during which it may test the zone of interest in a bearish market.
Bitcoin failed to overcome resistance at 92K, with economic data intensifying bearish pressure, resulting in another decline. The market is stagnant within the trading range, and any correction could quickly turn into a sharp decline...
ADA is forming a halt in the 0.41 zone and is entering a phase of local correction. The zone of interest is 0.426 - 0.434 (the area of local trend support breakdown). A retest of resistance may end in a false breakout...
Resistance levels: 0.421, 0.426, 0.434
Support levels: 0.409, 0.392
A false breakout of the resistance zone or a retest of the previously broken support of the uptrend may end in pressure from the bears. The correction may be followed by a continuation of the downtrend and the zone of 0.421 - 0.434
Best regards, R. Linda!

GBPUSD - small correctionIn the short term, we’re in a correction. After that, the outlook points to growth.
How high we rise and what kind of wave it will be depends on the depth of the correction.
The chart is quite technical and shows a clear picture.
Ideally, we shouldn’t drop below 1.321 .
Time will show the final result.
---
Please subscribe and leave a comment.
You’ll get new information faster than anyone else.
Together, we’ll grow and become wealthier.
---

DOGEUSDT → Lack of bullish potential BINANCE:DOGEUSDT.P failed to break the trend. Under pressure from resistance and a global downtrend, the coin is reversing and may decline...
Bitcoin is pausing after a news rally based on rumors. The trend remains bearish. Pressure on the crypto market is present...
DOGE faced pressure in the 0.1477 - 0.155 zone. A rebound from 0.1533 is forming and the price is closing below 0.1477, forming a pre-breakout base of 0.1464. The reaction to support is weakening, confirming the weakness of the buyer. A close below 0.1464 could trigger a further decline within the range.
Resistance levels: 0.1477, 0.15337
Support levels: 0.1464, 0.1366
A breakdown of support, closing below the level, and consolidation in the short zone will once again confirm buyer weakness, which in turn may trigger a further decline.
Best regards, R. Linda!

ethereum rises to 27-42k (in 2026) part 2gm,
i wanted to share a slightly more in depth analysis of my take on ethereum, and why i believe it will go up to a minimum of 27k into 2026.
---
i will start with the basics,
ethereum has been consolidating for at least 1300 days (in what i am calling a triangle)
> 1500 days in total, with the structure which came after it.
that's a very long consolidation. normally i would assume that this is merely a distribution phase, but a closer look on chain uncovers a different story:
from the start of the consolidation, which begun at the last cycle bear market highs, very large entities begun to accumulate ethereum. we refer to these as institutions. and their accumulation has only rapidly continued into the present day moment. they have accumulated so much coin, that the balance on exchanges sits at a 9 year low.
now, this is basic math right here,
if demand is high and supply is low = price goes up.
---
anyone saying we're in a bear market right now is trippin'
we are seeing large scale institutional interest from institutions worth 100 trillion dollas collectively, and they are just getting started. once supply dries up, price will begin to teleport like you have never seen before. (in theory)
---
now, let's talk about the elliott wave theory basics.
from ethereums inception, on a monthly scale, it came up from the lows in what i'm counting a (1)-(2), 1-2. a bullish nest is generally what we refer to this kind of formation, and it often creates a large wave (3), which it did.
i believe the wave (3) high was at the last bear market highs (in 2021), and everything after has been a massive wave (4) which i have chosen to label as a triangle. (this structure could also be labeled as a sharp double zig-zag if you refer to the contract adjusted ethereum future). but to keep it simple, it's a sideways correction which lasts 1500 days.
---
when something bull flags for 4 years, with large scale accumulation, it is assumed that the breakout will be parabolic, generational, extraordinary.
which is why i am targeting the largest distance of the triangle projected above it.
a sweet target of 27k, with a possibility to wick 40k+ on the final euphoria phase before i will indeed assume that the top is in.
---
bear markets often begin when nobody expects them, not when everyone calls for them.
---
🎯 = 27k
ETHUSD 4H Elliott Wave analysisJust a few more weeks of patience until the next big wave begins.
Follow us and stay updated.

BTCUSDT next moveIn my opinion according to elliot waves, we are in the final stage of a WXY wave which will be around 96 - 98 K and then we will go down

TeslaNothing has changed in regard to my analysis last week. MACD is reset and could support a move higher or lower from here. We have pierced the top side of my target box but have yet to invalidate the white pattern. Orange has risen in probability but remains an ALT count at this time. Looking at the overnight market tonight, price is down by a little over $1. That isn't enough to have any real meaning.
Structure continues to have two different outcomes from here. However, until the white count gets invalidated, it will remain my primary analysis. That happens with a breach of $479.42.
PalantirPLTR is trading at the top of tis respective target box. Looking at the overnights, price is currently up by a little over a dollar. That isn't too significant, but the white count doesn't have much room left to the upside before the turquoise pattern takes precedent. If price moves above $187.06, then I will transition to the turquoise pattern. The white count never hit the 1.0 where a=c though. This is the main reason I still favor the white count. However, as I have mentioned several times in the past, that is not a governing rule of price action. It is merely the standard in a corrective pattern.
One thing I do not like about the white count though, is the lack of structure within this last move higher. Traditionally b waves present as 3-wave structures. Although I could technically make 3 waves out of this pattern higher, it isn't very clear. Ultimately time will tell. As I mentioned above, price has little room to the upside before it presents us with clarity. Hopefully, we can get clarity one way or the other this week.

BTCUSD 4H Elliott Wave analysisStay tuned, we'll keep you updated on the possible levels step by step.
Love Elliott wave theory.
Follow us

NIFTY50.....Double-top still alive!Hello Traders,
the NIFTY50 closed the week with a loss of 16 points. This is in fact nothing. But my idea of a „double-top“ is still alive!
NIFTY50 made a new 52-week high!
More importantly, N50 spiked above the upper range of the so-called, Order-blog“ (OB). This probably indicates more selling-pressure for the coming week.
Chart analysis:
The final week's candle is a „Inverted Hammer candle!” There are now two options.
First, we will fill the lower shadow of the candle with volume and need to stop 25891 points or just shy below (for the bulls)!
Otherwise, more selling pressure is to come, what indicates the Inverted Hammer candle.
In this case, the door would be open to 25911 to 25654. More bearish potential exist!
The second option is, that the bulls take control of the market and push the N50 to new highs in the coming week. While there is no limit in this scenario, a target to call out is really difficult. But I try to do.
My long-term target is at 28851 points for the coming month!
So friends. You are well-prepared for the days and weeks ahead!
Have a great weekend....
Ruebennase
Please ask or comment as appropriate.
Trade on this analysis at your own risk.

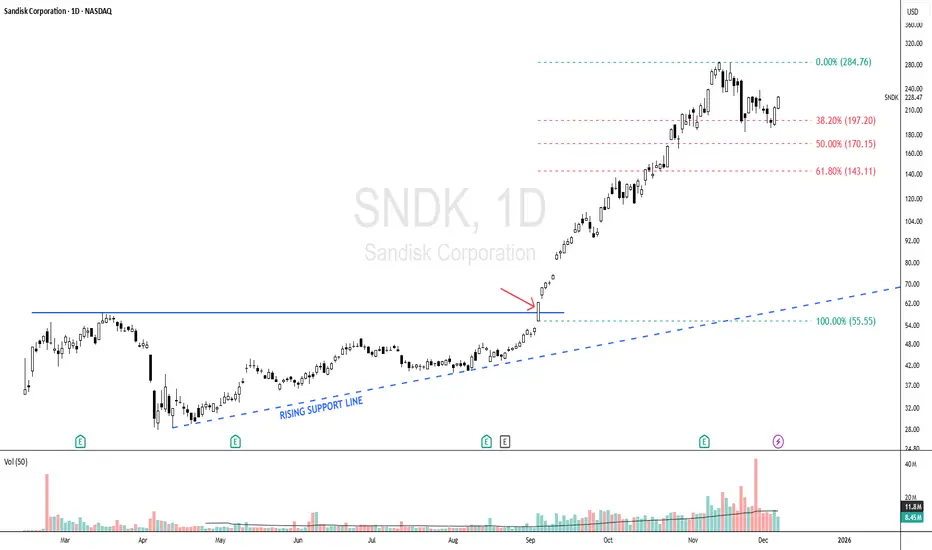
SNDK - Bullish Scenario Since 04 Sept, Momentum Still Intact!SNDK - CURRENT PRICE : 228.47
🔥 Bullish Scenario Supported by Trend Structure & Fibonacci Reactions
SNDK began showing early signs of a bullish scenario when price respected a rising support line , indicating steady accumulation and higher lows forming. The major bullish confirmation occurred on 04 September , when price broke above the 55.55 level (look at red arrow), triggering strong momentum and leading to a rapid vertical rally. As with many fast-moving stocks, a healthy retracement followed, and SNDK pulled back precisely toward the Fibonacci 38.2% golden ratio, where the stock found support and began forming a new base. This behavior suggests the prior uptrend remains intact, and the uptrend may resume as long as the stock continues to hold above this retracement zone.
Some Elliott Wave practitioners may also interpret the current structure as a developing Wave 5, suggesting the potential for another upside leg if the trend continues to follow impulsive wave behavior.
Take note that I'm using logarithmic scale chart because the share price has already risen more than 300% since the 04 September breakout, making it more suitable for analyzing large percentage moves and trend structure.
ENTRY PRICE : 228.47
FIRST TARGET : 270.00
SECOND TARGET : 324.00 (Projected based on Fibonacci extension)
SUPPORT : 183.00 (The low of 21 Nov HAMMER candle)
EU still going upHi traders,
Last week EU slowly went up some more and took the liquidity above as I've said in my previous outlook.
Next week we could see more (corrective or impulsive) upside for this pair.
Trade idea: Wait for a small correction down and look for a change in orderflow to bullish on a lower timeframe to trade longs.
This shared post is only my point of view on what could be the next move in this pair based on my technical analysis.
But I react and trade on what I see on the chart, not what I've predicted or expect.
Don't be emotional, just trade your plan!
Eduwave

USDCAD - Breakout Will Flip the Trend BullishUSDCAD has been sliding inside a well-defined descending channel, completing a full five-wave drop toward the support zone. The structure from the top looks corrective rather than impulsive. That means the downtrend is weakening as it reaches its final leg.
Your count shows Wave 3 finishing at the dashed red line zone, followed by a small Wave 4 bounce, and now the market is pushing into the last Wave 5. This final drop is expected to target the Fibonacci levels near 1.3915 and 1.3895 . Nothing suggests strength until those levels are tested.
The price is still trapped inside the downward channel, and every bounce has been getting sold. That confirms sellers are still in control for now. Wave (C) is close to completion, but buyers haven’t proven anything yet.
The bullish outlook only becomes valid after a clean breakout above the channel. Without that break, any upside move is just noise inside a bearish structure. The breakout must hold with a higher low to confirm a trend reversal.
If the channel breaks decisively, a strong bullish reversal toward 1.40+ becomes possible. The entire structure suggests the downtrend is aging, so a major upside swing is likely once sellers exhaust. Until then, downside targets remain open and caution is necessary.
Stay Tuned!
@Money_Dictators

Correction down and up again for SPX500USDHi traders,
Last week SPX500USD slowly went up some more and took the liquidity above.
Now it made a Weekly bullish FVG.
So nNext week we could see a correction downto fill this and after that more upside for this pair.
Let's see what the market does and react.
Trade idea: Wait for a correction down. After a change in orderflow to bullish you could trade longs.
This shared post is only my point of view on what could be the next move in this pair based on my technical analysis.
But I react and trade on what I see in the chart, not what I've predicted or expect.
Don't be emotional, just trade your plan!
Eduwave

BTC Wave 4 Bounce Looks Like a Trap! Is it?BTC is still moving inside a clear corrective channel, with the current bounce likely forming wave 4 before one final drop toward the 1.618 extension near 79,650 . The highlighted red zone shows a potential trap area where price may lure traders into thinking a reversal has started. Until BTC breaks above the channel convincingly, the broader structure still favors a wave 5 decline. The wave count from 1–2–3 supports this final leg down before any major recovery.
Stay Tuned!
@Money_Dictators

Correction down and more upside for goldHi traders,
Last week gold started a corrective downmove and made a bullish Weekly FVG.
So next week we could see the fill of it and finish the correction down. After that it could go up again.
Let's see what price does and react.
Trade idea: Wait for the correction down to finish and a change in orderflow to bullish to trade longs.
This shared post is only my point of view on what could be the next move in this pair based on my technical analysis.
But I react and trade on what I see in the chart, not what I've predicted or expect.
Don't be emotional, just trade your plan!
Eduwave

Still more upside for BitcoinHi traders,
Last week Bitcoin made a correction down and went up again as I've said in my previous outlook.
Now we could see more upside at least to the bearish Weekly FVG above after the finish of the correction down.
Let's see what the market does and react.
Trade idea: Wait for a small correction down on a lower timeframe and a change in orderflow to bullish to trade longs.
This shared post is only my point of view on what could be the next move in this pair based on my technical analysis.
But I react and trade on what I see in the chart, not what I've predicted or expect.
Don't be emotional, just trade your plan!
Eduwave

GOLD → Retest of upward trend support. Focus on 4200FX:XAUUSD is trading near $4,200, remaining cautious at the start of the week ahead of the Fed's decision. The trend is bullish, with the dollar stagnating. A long squeeze of support could trigger a rebound...
The Fed is expected to cut rates by 25 bps (probability ≈90%). Weak US data supports dovish expectations
Attention is shifting to the Fed meeting and its forecasts for 2026. The lack of important US data today shifts the focus to geopolitics and general market sentiment.
There is not much news this week, but from a geopolitical point of view, attention is focused on Japan-China and Russia-Ukraine-US relations.
Gold is awaiting signals from the Fed. The decision on rates and geopolitical news will determine the direction of the breakout from the current range.
Resistance levels: 4220, 4256
Support levels: 4200, 4195, 4180
The dollar previously broke through the support of the uptrend, but has been stagnating for the past few days. A break below 99.0 could trigger a decline in the index, which could support the price of gold.
Gold is testing the support of the trading range within the uptrend. Focus on the 4200-4195 zone. A long squeeze could trigger growth amid a weak dollar...
Best regards, R. Linda!

Gold Forming a Double Top Pattern?Last week, Gold( OANDA:XAUUSD ) exhibited sharp movements, both upward and downward, making trading quite challenging.
The key question is whether gold will continue its bullish trend.
Currently, gold is positioned near a resistance zone($4,231 – $4,215) and is moving close to significant support lines. Last week, gold created a bull trap above the resistance zone($4,231 – $4,215).
From an Elliott Wave perspective, it appears that gold has completed wave 5 with an expanding ending diagonal and is now undergoing a pullback towards the lower line of this pattern.
Looking at the classic technical analysis on the 4-hour chart, there’s a potential double top formation, and the momentum from the second top is quite strong, suggesting that gold may break through the support lines and confirm the double top pattern.
On the other hand, factors like the DXY Index ( TVC:DXY ) and the US 10-Year Government Bond Yield ( TVC:US10 ), which are currently bullish, could exert downward pressure on gold.
Considering all these points, I expect that gold will break through the support lines and potentially move down to $4,167.
Note: If gold breaks through the support zone($4,185 – $4,133), we can expect further declines.
First Target: $4,167
Second Target: $4,127
Stop Loss(SL): $4,247(Worst)
Points may shift as the market evolves
------------------------------------------------
We should also keep in mind that several important US economic indicators will be released this week, which could significantly impact market direction. So be extra cautious with your positions, especially during data releases:
JOLTS Job Openings➡️09 December
Federal Funds Rate➡️10 December
FOMC Statement➡️10 December
FOMC Press Conference➡️10 December
Unemployment Claims➡️11 December
------------------------------------------------
💡 Please respect each other's opinions and express agreement or disagreement politely.
📌 Gold Analyze (XAUUSD), 4-hour time frame.
🛑 Always set a Stop Loss(SL) for every position you open.
✅ This is just my idea; I’d love to see your thoughts too!
🔥 If you find it helpful, please BOOST this post and share it with your friends.

USDJPY → Attempt to return to the bullish trend from correctionFX:USDJPY may exit the correction phase and continue its upward movement within the trend. The global target has not yet been reached.
The dollar is consolidating after breaking the bullish trend structure. The market is trying to keep the price above 99.0. Growth and a retest of 99.5 are possible. This move may support the growth of the currency pair.
The correction may end. The main trend is bullish, and the market continues to follow the trend lines despite the weak dollar.
A breakout of the correction boundary and maintaining the price above 155.4 may trigger a distribution of 157.8.
Resistance levels: 155.4, 157.15
Support levels: 154.45
Local and global trends are bullish. The correction may end as the price continues to storm the resistance of the local bearish pattern. A breakout of 155.4 and consolidation above this zone may support further growth.
Best regards, R. Linda!

Elliott Wave or NEoWave? Which on is better?A common question people often ask is: Should I learn Elliott Wave or NEoWave? Which one is better? And do I need to study Elliott Wave first before moving on to NEoWave?
Let’s break it down.
The classic Elliott Wave theory originates from the book Elliott Wave Principle, written and compiled by Robert Prechter and A.J. Frost.
Both authors were not the original creators of the theory .. they simply collected and organized the works of Ralph Nelson Elliott, whose ideas were scattered across various sources, and compiled them into a single book.
Given the context of that era .. the trading environment, technology, and available tools .. it’s fair to say R.N. Elliott developed the theory to a level that was almost complete for his time.
Back then, there were no PCs, no laptops, no internet… and charts had to be drawn by hand.
In that sense, Elliott was genuinely a genius.
But despite its impact and popularity, the classical version still contains many weaknesses.
And someone eventually stepped in to identify those flaws .. a passionate young man named Glenn Neely, who dedicated himself to studying wave theory seriously and wanted to eliminate the criticism that Elliott Wave was nothing more than “a subjective theory that doesn’t work in real trading.”
Because he was born in an era where computers were emerging and technology was accelerating, he had the thought of applying science and mathematics to make wave analysis more accurate and repeatable.
After more than seven years of work, Neely published an extremely complex .. and extremely difficult .. book: Mastering Elliott Wave.
This book essentially became the foundation of early NEoWave, because nearly all of the first-generation NEoWave concepts were packed inside it.
So… which one is better?
The answer, without hesitation: Mastering Elliott Wave wins by a landslide.
Yes, it’s difficult.
But that difficulty comes with benefits:
– Higher accuracy
– Clearer structure
– Much stronger logic
These are things classical Elliott Wave simply cannot do.
The blue book (Elliott Wave Principle) lacks something crucial that the red book (MEW) provides:
a practical and functional Degree system.
(The truth is, even MEW’s Degree system isn’t perfect .. which is why I eventually built my own system on top of it.)
Neely also introduced time and price principles to calculate Degrees .. determining which waves are major, which are minor, etc.
This method does not exist in the classical version at all, which only provides extremely abstract degree labels.
So, do you need to learn Elliott Wave first before studying NEoWave?
Let me give you a simple analogy.
Elliott Wave = manual transmission car
NEoWave = automatic transmission car
The question is:
“If you buy an automatic car, do you need to learn manual first?”
The answer: Absolutely not.
Even though NEoWave originated from Elliott Wave, the internal logic has diverged significantly.
(And in today’s world, NEoWave has already moved far past the classical version.)
In fact, I personally believe you shouldn’t study both at the same time .. especially if you’re a beginner .. because the rules of the two systemas will conflict with ech other and waste your time.
For example, some patterns that classical Elliott Wave strictly prohibits, NEoWave has tested and proven to be possible.
In summary:
NEoWave takes the material from classical Elliott Wave and develops it into a far more precise, detailed system.
But even NEoWave still has flaws that make real-world trading difficult .. which is exactly why I’m working on improving and modernizing it.
At the end of the day, no theory lasts forever, because markets are driven by humans.
The psychology of today’s generation isn’t the psychology of people 100 years ago.
And modern markets influenced by AI-driven trading are not the same as Elliott’s era or Neely’s era.
This is why we need new-generation theories built for new-generation data.
- written by me(brainiak/ew-lab) thanks for reading!

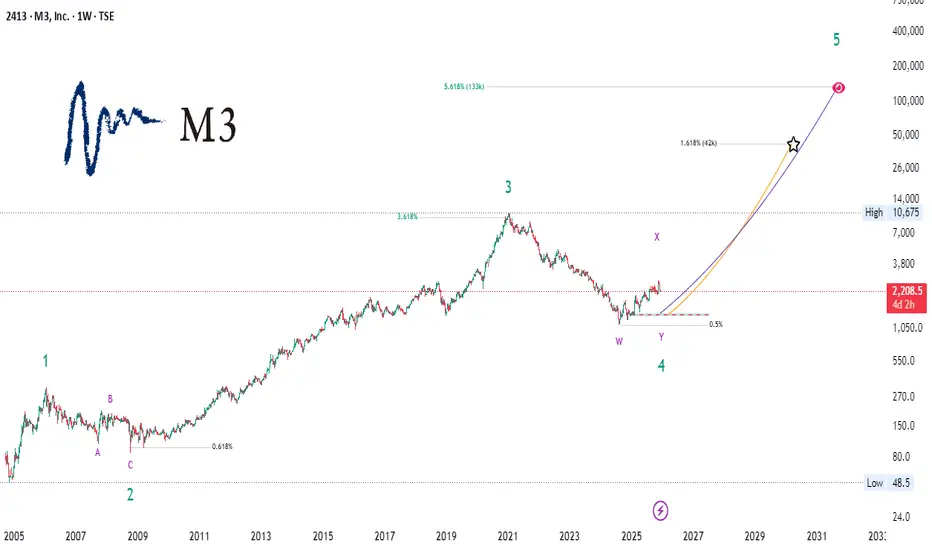
M3 (2413) — Wave 4 Completion and Long-Term StructureM3 (2413) — A Decade-Long Correction May Have Ended | The Architecture of a Potential Supercycle Wave 5
This study examines M3 (TSE:2413) through a deep-time structural lens, highlighting what may be the most technically significant inflection point in the stock’s modern history. By contextualizing the price evolution since 2005 within an Elliott Wave framework, this analysis aims to illuminate the broader architecture that could guide the next multi-year phase.
🔹 Why This Moment Matters
For nearly a decade, M3 has been navigating an extended W–X–Y corrective structure following its major Wave 3 peak. This was no ordinary pause—it was one of the longest and most complex retracements ever recorded in this symbol.
Despite its depth, the correction respected the higher-timeframe trend impeccably:
Termination at the 0.5–0.618 Fibonacci cluster
Structure consistent with a completed higher-degree Wave 4
Price stabilization occurring precisely where long-term cycles often reset
Such convergence across timeframes is rare and often meaningful.
🔹 A Framework for What Comes Next
If Wave 4 has indeed completed, M3 may be entering the foundational phase of Supercycle Wave 5 , historically the most structurally powerful leg in an established growth trend.
This chart outlines two macro trajectories:
Primary Path (Institutional Scenario)
A measured, sustainable advance toward the 1.618 Fibonacci extension , aligning with classical Wave 5 proportion and long-term market symmetry.
Extended Path (Innovation Cycle Scenario)
A more ambitious arc projecting into the 3.618–5.618 zone , reflecting behavior seen in past secular expansion phases—particularly in companies whose growth reaccelerates after prolonged consolidation.
Both paths are illustrated with curvature rather than straight-line projections to better represent the non-linear acceleration patterns commonly observed in late-cycle impulsive structures.
🔹 What the Chart Shows
The completed W–X–Y pattern marking the Wave 4 trough
A multi-year prior impulse (Wave 3) whose Fibonacci relationships remain intact
Historical highs and structural inflection zones for orientation
Two potential long-term trajectories, color-coded for clarity
A convergence of geometry, momentum stabilization, and structural completion—all aligning at the current price region
This confluence forms a compelling technical environment rarely seen on high-timeframe charts.
🔹 Strategic Perspective
This analysis does not make deterministic predictions.
Instead, it provides a macro-structural framework for institutions, portfolio strategists, and long-horizon investors seeking to understand where M3 may be positioned within its secular growth cycle.
Episodes of prolonged corrective unwinding often precede decisive shifts in trend character. If this framework proves correct, M3 may be transitioning from one of its largest consolidations into one of its most expansionary cycles.
🔹 Final Note
This chart is for educational and analytical purposes only.
It does not constitute financial advice.
If you found this useful, feel free to comment with your interpretation of the Wave 4 structure.